Analyzing Spatio-Temporal Spread of Covid19 in India
←
→
Page content transcription
If your browser does not render page correctly, please read the page content below
COVID-19 Pandemic: Case Studies,
Commentaries, and Opinions [COVID]
                 Volume 2020 Issue 04
Research Article

Analyzing Spatio-Temporal Spread of Covid19 in
India
K C Gouda1,5,*, Nikhilasuma P1, Priya Singh1, Reshma Kumari1, Mahendra Benke2, Chandrika M3, P Samantray4,
Rani Devi1,5, Smrutishree Lenka1,4, Kiran M Hungud6, S Himesh1,5
1
 CSIR Fourth Paradigm Institute, Wind Tunnel Road, Bangalore-37, India
2
 India Meteorological Department, Pune, India
3
 Jain University, Bangalore, India
4
 Visvesvaraya Technological University, Belagavi, India
5
 Academy of Scientific and Innovative Research, Ghaziabad, UP, India
6
 Karnataka State Remote Sensing Application Centre, Bangalore, India

Received: August 27, 2020; Accepted: September 09, 2020; Published: September 11, 2020

R-Infotext Citation: K C Gouda, Nikhilasuma P, Kumari R, Singh P, Benke M, et al. (2020) Analyzing Spatio-Temporal Spread of
Covid19 in India. COVID-19 Pandemic: Case Studies & Opinions 01(04): 57–67.

    Abstract
In this work, we analyzed the spatial and temporal spread of the COVID-19 cases in India at country and state scales for the time period
10th March to 10th June, 2020, when the spread is growing faster and the number of positive cases touched 250000 in India. The results
clearly suggest the onset of COVID-19 in different part of India is happened by people with travel history from outside India and there
is exponential growth of the cases in India during April-May 2020. The infection growth rate and the doubling rate of COVID-19
spread at various time period in the analysis for India and the states which severely affected are discussed. This study provides an insight
to the propagation dynamics of COVID-19 in India and major states which can be a good input for the disease spread prediction model
and for the decision making to containment the COVID-19 in India.

Keywords: COVID-19, Spatio-temporal, Spread, Growth rate, Doubling time, India

    Introduction                                                          in the patients [3–4]. The close contacts like family
                                                                          members, colleagues, friends etc. of patients are in high
The whole world is facing an ongoing global pandemic                      risk of the COVID-19 transmission [4]. A recent study
due to the corona virus disease (COVID-19) which                          reviewed the possible mode (i.e. droplets and aerosols)
spreads by the Severe acute respiratory syndrome corona                   of spread of COVID-19 virus in the environment and
virus 2 (SARS-CoV-2) from person to person [1–2] and                      among peoples [5]. Another study also emphasized that
it is a threat to the global environment. It is almost six                few hundreds of SARS-CoV-2 virus would be sufficient
months when first COVID-19 case reported in Wuhan                         to spread the disease among susceptible hosts [6].
in China and then WHO declared the global pandemic
on 11th March 2020 (WHO, 2020). The disease outbreak                          The first positive case of COVID-19 case in India
resulted major harm and challenges to almost all the                      reported in Thrissur, Kerala on 30th January 2020 and
countries in world as the number of infection and                         the patient has traveled from Wuhan and then gradually
the associated mortality is increasing rapidly and the                    the number rises and crossed to 250,000 by beginning
transmission is high even with asymptomatic behavior                      of June and spread across country within time span of

September 11, 2020                                              COVID-19 Pandemic: Case Studies & Opinions, Volume 01(04): 57–67, 2020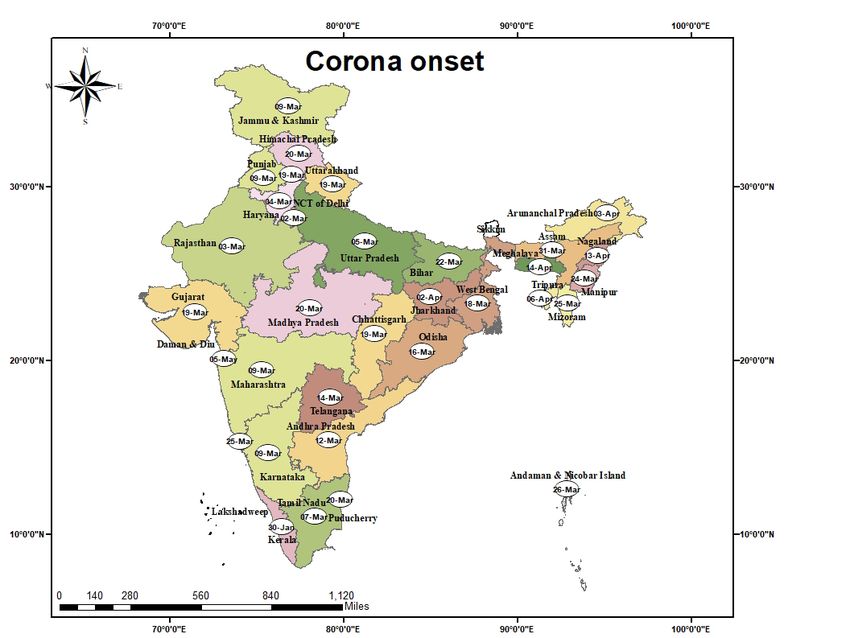
Spatio-Temporal Spread of Covid19

3 months. Government of India imposed four phases                  and Family Welfare (MoHFW), Government of India
of country wise lockdown starting 24th March 2020 to               (https://mohfw.gov.in) [26] and Worldometers (https://
containment the epidemic viral disease spread. As India            www.worldometers.info) [27] at daily scale for the
is a very large country with different physio-geographical         analysis period 10 March to 10 June 2020.
and environmental conditions so it is very difficult to
                                                                       The spatial spread analysis of COVID-19 in India is
estimate the COVID-19 spread at regional scale. Also
                                                                   carried out using the geo-spatial mapping in GIS tools.
the weather and climate is very diverse in India and in
                                                                   The trajectory of spread is represented as an onset map
2020 the winter prevailed in January-February with low
temperatures, followed by intense summer (rise in daily            where the 1st day of the cases confirmed/reported in
temperatures even to more than 40–45oC in various                  each state and union territories are mapped. The spatial
parts) during March-May and witnessed rainfall due                 spread of COVID-19 (the number of total positive cases)
to the pre-monsoon thunderstorm in eastern, south                  are mapped at interval of 1 week starting 14th March
peninsular and some parts of north and central India.              to 6th June are prepared and presented. Similarly, for
Two tropical cyclones in Bay of Bengal and Arabian Sea             temporal analysis over India and six most affected states
in May 2020 resulted major disasters in the states like            (i.e. Maharashtra, Gujarat, Rajasthan, Tamilnadu Uttar
West Bengal, Maharashtra, parts of Odisha and Gujarat.             Pradesh and Delhi), the histogram of daily new cases
Recently several researchers reported the relation of              observed is presented along with the cumulated total
meteorological parameters and the dispersion potential of          positive cases in logarithmic scale.
COVID-19 at multiple spatial scales like global, national
                                                                       Different statistical algorithms are adopted to analyze
and local scales [7–11]. So, in a country like India there
                                                                   the growth rate and doubling rate of the COVID-19 in
is a need of analysis which adopts the multi-disciplinary
                                                                   India and at different state levels. The COVID-19 positive
approach integrating biophysical and human variables
                                                                   case growth rate over India and different states and Union
[12] for studying the epidemics like COVID-19. Few
                                                                   territories are computed using the confirmed cases of
recent studies indicated the direct relation between
                                                                   present day and previous day. To calculate the growth
environmental, topographic, socio-economic and
                                                                   rate of the COVID-19 positive cases reported in India
demographic themes in the COVID-19 spreads [13–15].
Recently several works are being reported which deals              and all states the method of exponential curve fitting has
with the study of the spread of the COVID-19 in various            been used. For this the data of COVID-19 positive cases
parts of world [16–24].                                            (at daily scale) are used and an exponential trend yt = abt
                                                                   is being fitted by the least square method to obtain the
    As the geographical situation deals with environmental,        trend values as follow.
territorial and location specific perspective [25] so in
this study the geographical distribution of the spread of             The exponential trend is yt = abt                      (1)
COVID-19 in the large country i.e. India is analyzed
to understand the spatial and temporal degree of                       Where t =Time Period, yt = Total COVID-19 positive
transmission of the positive cases during March to June            cases at time t (day), a = Initial value of the positive cases
2020.The geo-spatial and statistical analysis are being            (i.e. at t=0) and b = Constant.
carried out in understanding the transmission trajectory              Then the logarithmic value of eqn (1) is computed as
and disease intensity in India which can be used as a good         the COVID-19 spreads exponentially and the equation
guidance for the interpretation of the COVID-19 spread,            becomes
modeling and prediction of the transmission of disease
both in space and time and finally the decision making to             log yt = log a + t log b                               (2)
fight the COVID-19 in India.                                          Let as assume Y= log yt, A= log a, B= log b
                                                                      The linear trend Y= A + Bt between Y (cases) and t
  Material and Methodology                                         (day) is equivalent to the exponential trend yt = abt.

The COVID-19 infection data over India is being                       Then the principle of least square is used for estimating
collected from various sources like Ministry of Health             A and B which are given by

September 11, 2020                                        COVID-19 Pandemic: Case Studies & Opinions, Volume 01(04): 58–67, 2020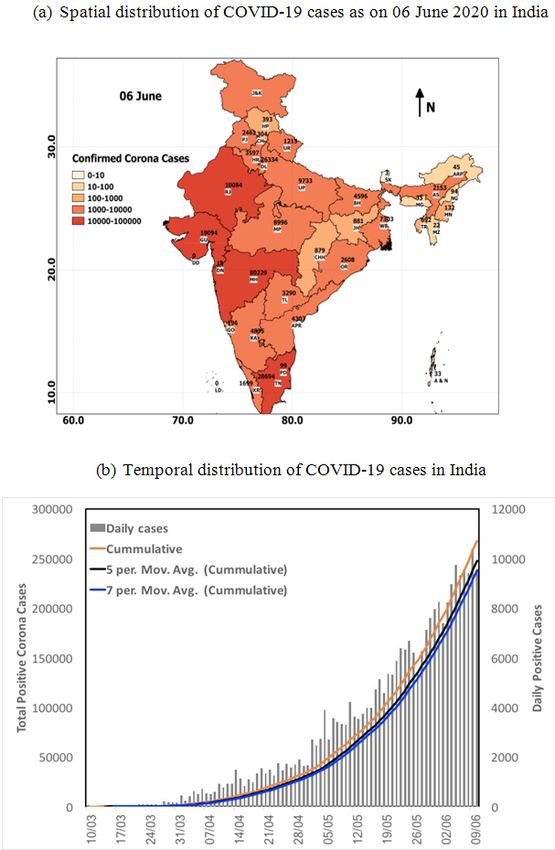
Spatio-Temporal Spread of Covid19

   ∑Y = nA + B∑t                                               (3)            Results and Discussion
   ∑tY = A∑t + B∑t                                             (4)
                                                                            Onset of COVID-19
    These equations (3 and 4) are solved for A and B and
                                                                            The COVID-19 case was first reported from Kerala in
finally using these values in equation 2, the trend values
                                                                            India on 30 January 2020, the day WHO declared global
i.e. a and b are estimated by taking the antilog values of
                                                                            health emergency and the patients have travelled from
A and B respectively. i.e. a=antilog (A) and b=antilog (B)
                                                                            Wuhan city in China where the COVID-19 originated
   Then for computing the rate of Growth the following                      in late December 2019. In February no cases is reported
algorithm is being adopted                                                  in India but by March 15 it spreads to Delhi, Rajasthan,
                                                                            Tamilnadu, Telangana, Uttar Pradesh, Haryana,
   P(t) = Po*exprt                                             (5)          Jammu, Ladakh, Maharashtra, Punjab and Karnataka.
    Where P (t) = Total COVID-19 positive cases at time                     Figure 1 represents the date of origin of COVID-19 cases
t (day), PO = Initial value of COVID-19 positive cases                      first in each state in India during January to April 2020.
                                                                            By March end Assam, Bihar, Chandigarh, Chhattisgarh,
(t=0), Gr = Rate of growth and t = Time Period
                                                                            Goa, Himachal Pradesh, Madhya Pradesh, Manipur,
   Finally the doubling rate i.e. time taken to double the                  Odisha, Puduchery, Uttarakhand, West Bengal and by
cases as compared to previous number of COVID-19                            April it covers all over India. This indicated the trajectory
positive cases at all India and state level computed using                  of COVID-19 spread was in south India followed by
the growth rate (Gr) as follow.                                             north, west, east and finally north-east part of country. It
                                                                            is also observed that almost in all state the first reported
   Doubling Rate (Dr) = ln(2) / Gr                                          cases have travel history from outside India.

Figure 1: Date of onset (1st positive case reported) of COVID-19 in each state of India.

September 11, 2020                                                COVID-19 Pandemic: Case Studies & Opinions, Volume 01(04): 59–67, 2020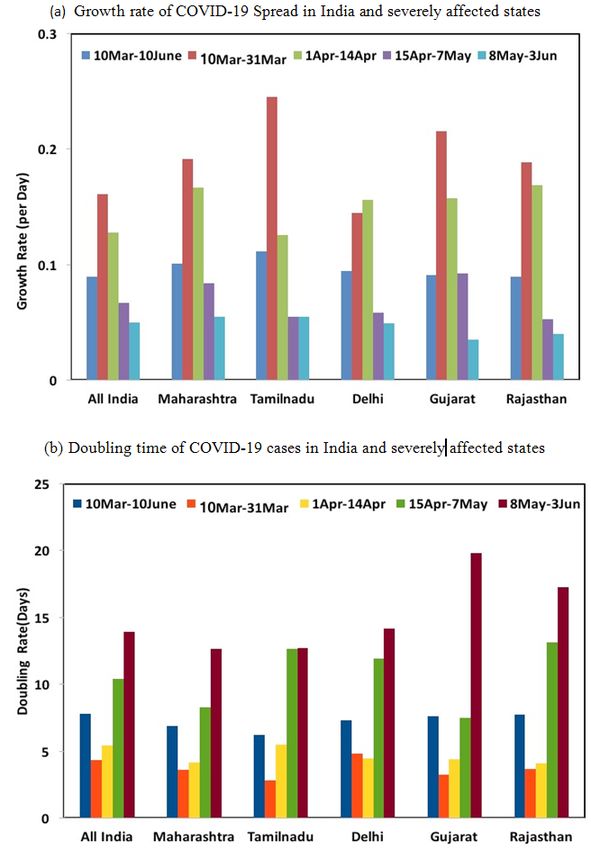
Spatio-Temporal Spread of Covid19
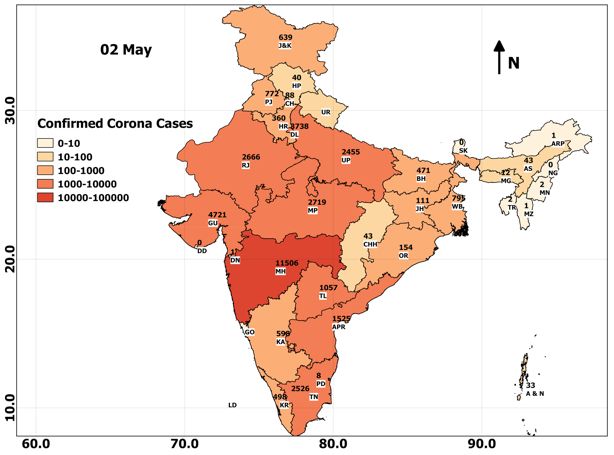
Spatial and Temporal distribution of COVID-19 COVID-19 spread in the country. This clearly indicates
the progression of the disease become exponential in April
The state wise distribution of the heat map of COVID-19
and May 2020 over India. The 5-day average value is
as of 6th June 2020 presented in figure 2a. The colors show
found to be 222 on 1st April rising to 1689 on 1st May and
the number of confirmed positive COVID-19 cases in peaked to 7753 on 1st June supporting the exponential
each states in India. It is observed that the states like rise of the disease progression. The curves also show the
Maharashtra, Gujarat, Rajasthan, Tamilnadu and Delhi growing situation in India and the flattening of curve is
recorded maximum number of cases as compared to other still long away as on 10th June 2020. The corresponding
states. Maharashtra state recorded highest numbers with state wise spatial analysis at an interval of 1 week starting
80229 followed by Tamilnadu with 28694 and Delhi 28th March to 31st May 2020 are presented in figure 3a
with 26334 cases. In many other states the number found and 3b, which indicate the epidemic progressed rapidly
to be in the range 1000–10000cases except few states like and severely in the states of Maharastra, Tamilnadu,
Chhattisgarh, Himachal Pradesh, Jharkhand and all states Delhi, Gujarat, Rajasthan, Uttar Pradesh describing the
in north east India (except Assam) where the number of west and south part are more endemic during the three
cases are below 1000. The cumulative positive cases of month analysis period. Keeping this in mind the state wise
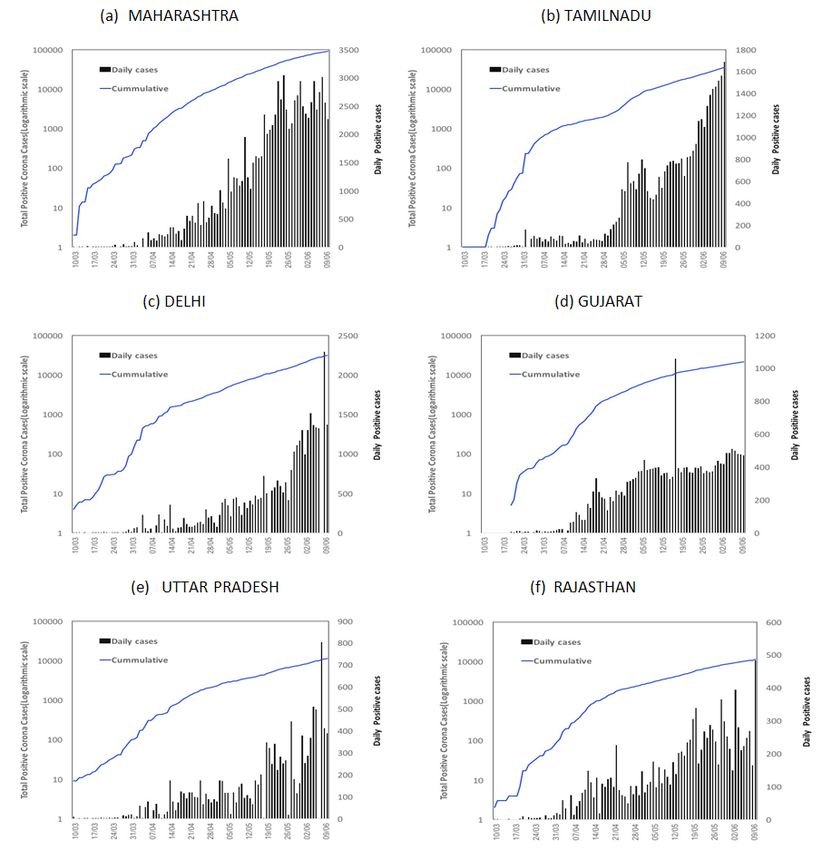
COVID-19 in India is shown in figure 2b along with the temporal progression of COVID-19 over these selected 6
daily new positive cases (secondary y-axis) reported for the states are estimated and presented in figure 4. The analysis
period 10th March to 10th June 2020 (3 months) and the shows in Maharashtra, Delhi and Tamilnadu the cases are
moving average (5day and 7day) of cumulative cases are rapidly growing stage with average daily new cases around
also combined to compare the temporal variations in the 2500, 1000 and 1000 respectively in the early June 2020.
Figure 2: (a) Spatial and (b) Temporal distribution of COVID-19 cases in India.
September 11, 2020 COVID-19 Pandemic: Case Studies & Opinions, Volume 01(04): 60–67, 2020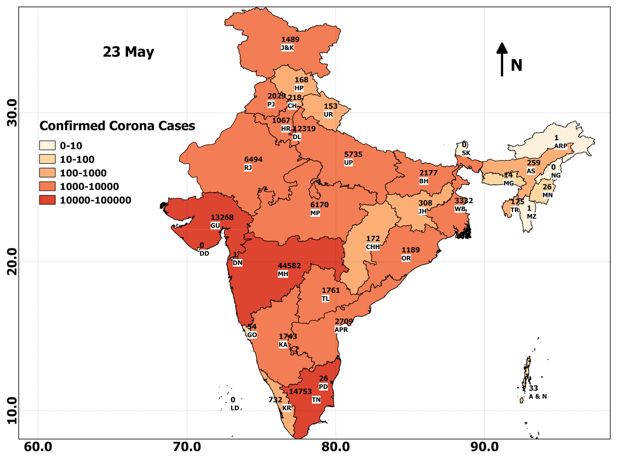
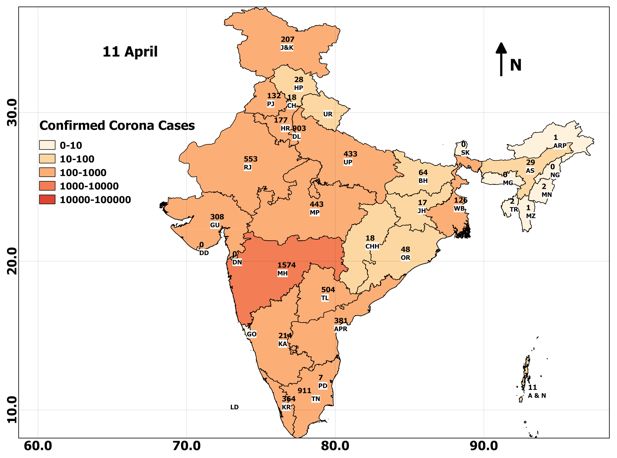
Spatio-Temporal Spread of Covid19

Figure 3(a): Spatial distribution of COVID-19 cases in India for weeks ending on 14th March to 18th April 2020.

September 11, 2020                                              COVID-19 Pandemic: Case Studies & Opinions, Volume 01(04): 61–67, 2020
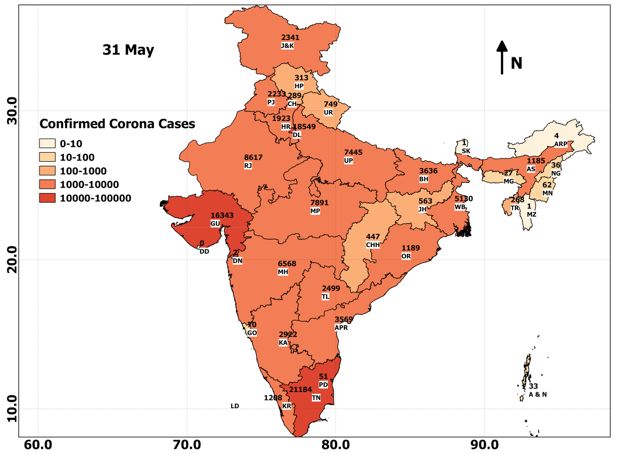
Spatio-Temporal Spread of Covid19

Figure 3(b): Spatial distribution of COVID-19 cases in India for weeks ending on 25th April to 31st May 2020.

September 11, 2020                                              COVID-19 Pandemic: Case Studies & Opinions, Volume 01(04): 62–67, 2020
Spatio-Temporal Spread of Covid19

Figure 4: Temporal distribution of COVID-19 positive cases and daily new cases observed in six states of India.

    As mentioned earlier the first case in India reported                 Figure 5 shows the number of days took to reach different
on 30th January and it took 60 days (29th March) to                       numbers in the total COVID-19 cases in India and it is
report the first 1000 cases, 99 days (7th May) to report                  seen that the numbers from 30000 to 100000 is attained
50,000 cases and 111days (19th May) to reach 100,000                      at an average of 3500 cases per day during the lockdown
cases. Similarly, it took 120 days (28th May), 126 days                   period, whereas in the later part in late May and early
(3rd June), 132 days (9th June) to report 150000, 200000                  June the number spreads 100000 to 150000 in 9 days
and 250000 positive COVID-19 cases all over India.                        on an average of 5500 cases per day as in this period lot

September 11, 2020                                               COVID-19 Pandemic: Case Studies & Opinions, Volume 01(04): 63–67, 2020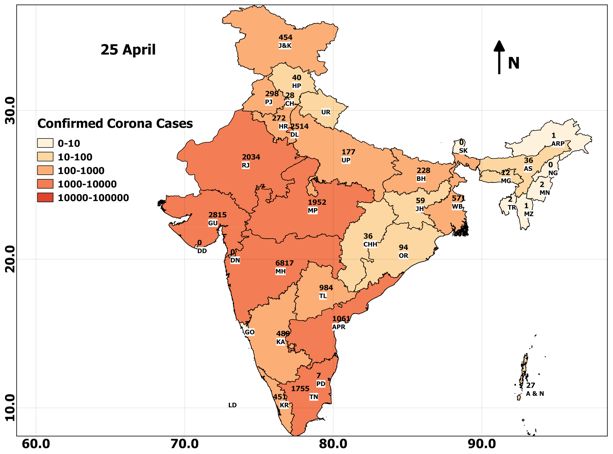
Spatio-Temporal Spread of Covid19

of interstate movement of people particularly migrant                     average rate of 8300 cases/day when the last phase of
labors happened and the infected number increased from                    lockdown is lifted in India after May 31, 2020.
150000 to 250000 very rapidly only in 12 days with an

Figure 5: Number of days taken to reach at different total positive COVID-19 counts ranges in India.

Growth rate of COVID-19 in India                                          to very high above 200000 in India the growth rate is
                                                                          found to be declining i.e. 0.05 at all India and about 0.03
The exponential growth rate of the COVID-19
                                                                          to 0.05 in the individual states which affected severely
transmission across India and different state levels are
                                                                          also same declining trend observed in other states i.e.
computed for 5 time windows defined based on the
                                                                          Punjab, Andhra Pradesh, Madhya Pradesh, Telangana
cumulative number of total COVID-19 cases in India
                                                                          etc. indicating significant decrease in the growth rate.
and presented in figure 6a. The 5 windows chosen are 10
March to 10 June (whole period), 10 March to 30 March                         The doubling rate is a measure of the intensity of the
(when cases reached 1000+), 1 April to 14 April (when                     spread of epidemic disease which generally provides the
cases reached 10000+), 15 April to 7 May (when cases                      idea about the time period (in these case days) in which
reached 5000+) and 8 May to 3 June (when cases reached                    the cases of infected people became double as compared
200000+) at all India level. During whole analysis of 3                   to the previous value. Figure 6b denotes the doubling rate
months period the exponential growth rate of COVID-19                     of the COVID-19 in India and the most affected states.
at all India found to be 0.09 but for Maharashtra and                     It is observed that in March the value was very low i.e.
Tamilnadu the value is 0.1 and 0.11 respectively. Same                    4.31 for all India and about 2–4days for the states as the
analysis in the early stage i.e. (10–31March) shows                       number of positive cases were reporting very small and it
Tamilnadu and Gujarat has higher growth rate (0.22 and                    increases to 5.42 days during the first half (1 -14 April)
0.25) followed by Maharashtra and Rajasthan (0.19) and                    of April 2020 for all India cases and also remained on
at that time window all India growth rate is 0.16. In the                 an average 4.4 days for other states considered. During
1–14April time period almost all the six states and all                   15 Apr- 7 May when the numbers became very high the
India witnessed similar growth rate (0.13 to 0.17) and                    doubling rate also reduced to 10.42 days for India and
it remained lower (0.05–0.09) in the next 3 weeks’ time                   more than 11 days for Tamilnadu, Delhi and Rajasthan
(15 April to 7 May) and when the case number jumps                        but it was only close to 8 days over Maharashtra and

September 11, 2020                                               COVID-19 Pandemic: Case Studies & Opinions, Volume 01(04): 64–67, 2020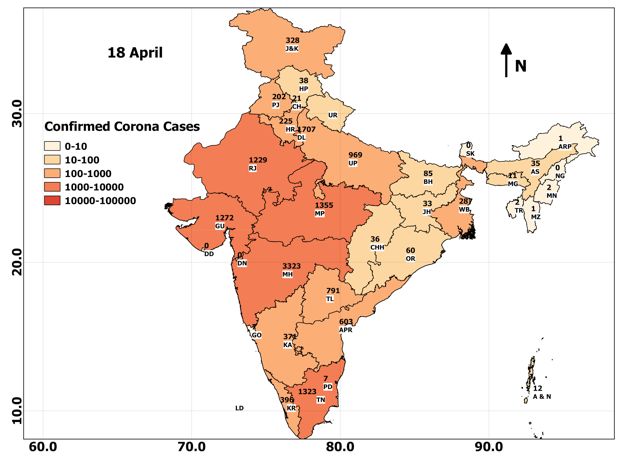
Spatio-Temporal Spread of Covid19

Delhi which reported drastically increase in the positive                 Rajasthan (17.29 days) and Gujarat (19.81). This analysis
COVID-19 cases in these two states. Similarly, in the                     clearly quantifies the doubling spread was not uniform
last phase of lockdown (8 May-3 June) the doubling rate                   across space and time and the metro cities like Mumbai,
is about close to 14 days in India at the time when the                   Chennai and Delhi are most affected cities where the
number of cases already crossed 200,000 and the rate was                  cases are rising exponentially with doubling in low period
about 12 days for most vulnerable states i.e. Maharashtra,                as compared to the other cities and states.
Tamilnadu and 14 days for Delhi whereas it is very slow in

Figure 6: The (a) exponential growth rate and (b) doubling rate in days of COVID-19 spread in India and severely affected 5 states.

September 11, 2020                                              COVID-19 Pandemic: Case Studies & Opinions, Volume 01(04): 65–67, 2020
Spatio-Temporal Spread of Covid19

 Conclusion                                                         Govt. of India and another project funded under National
                                                                    Mission on Himalayan Studies (NMHS) of Ministry of
The global pandemic due to COVID-19 has been                        Environment, forest and climate change, Govt. of India
spreading world over and also it affected India and                 (grant no: GBPNI/NMHS-2019–20/MG/315). The
within 2 months’ time all the state in India reported the           CSIR 4PI high-performance computing (HPC) facility
positive cases of COVID-19 patients. The spatial and                used for computing is acknowledged gratefully. The
temporal spread analysis reported here clearly indicates            authors acknowledge Head, CSIR 4PI for support and
that the disease spread rapidly and the trajectory of               encouragement.
COVID-19 spread In India is started in south India
followed by north, west, east and finally north-east part
of country and almost in all state the first reported cases          References
have travel history from outside India. The analysis of             1.    Lewis D (2020) Is the coronavirus airborne? Experts can’t
the spatial spread at different stages i.e. early in March,               agree. Nature News. [View]
intense summer season, multiple lockdown periods etc.               2.    Morawska L, Cao J (2020) airborne transmission of
is very important which can be used to understand the                     SARS-CoV-2: the world should face the reality. Environ
different social and population dynamics along with the                   Int 105730. [View]
environmental dynamics for the prevention of the rapid              3.    Bai Y, Yao L, Wei T, Tian F, Jin DY, et al. (2020) Presumed
transmission of COVID-19 in a large country like India.                   asymptomatic carrier transmission of COVID-19. JAMA
The spread also results of the huge inter-state movements                 323: 406–1407. [View]

of the people like migrant labors which increases the cases         4.    Gao Z, Xu Y, Sun C, et al. (2020) A Systematic Review
                                                                          of Asymptomatic Infectionswith COVID-19. J Microbiol
in various states like Odisha, UP, Bihar, Jharkhand etc.
                                                                          Immunol Infect In Press. [View]
This study provides the geographical mapping I n terms of
                                                                    5.    Jayaweera M, Perera H, Gunawardana B, Manatunge J
the spatial as well as temporal analysis of the COVID-19                  (2020) Transmission of COVID-19 virus by droplets and
spreads in terms of the growth rate and doubling rate of                  aerosols: A critical review on the unresolved dichotomy.
the disease at each state level and the outcomes could be                 Environ Res 188: 109819. [View]
a valuable information and can be integrated with the               6.    Beggs CB (2020) Is there an airborne component to
more robust geo-spatial tools and statistical methods as                  the transmission of COVID-19?: a quantitative analysis
well as predictive models (statistical/regression/artificial              study. medRxiv Pre Print. [View]
intelligence) in the appropriate policy and decision                7.    Bariotakis M, Sourvinos G, Castanas E, Pirintsos SA
making by the governments for the social mobilization                     (2020) Climatic influences on the worldwide spread of
                                                                          SARS-CoV-2. MedRxiv Pre Print. [View]
and the quick response from the community, This spatio-
                                                                    8.    Ahmadi A, Fadai Y, Shirani M, Rahmani F (2020)
temporal spread of COVID-19 understanding provides
                                                                          Modeling and forecasting trend of COVID-19 epidemic
huge information about the epidemic dynamics starting                     in Iran until May 13, 2020. Medical Journal of The Islamic
from early stage in India and it can also be useful for                   Republic of Iran (MJIRI) 34: 183–195. [View]
deciding the mitigation plans at multiple scales like               9.    Gupta S, Raghuwanshi GS, Chanda A (2020) Effect of
regional, state and national.                                             weather on COVID-19 spread in the US: a prediction
                                                                          model for India in 2020. Sci Total Environ 728: 138860.
                                                                          [View]
 Acknowledgment                                                     10.   Bashir MF, Ma B, Komal B, Bashir MA, Tan D, Bashir
                                                                          M (2020) Correlation between climate indicators and
This work is supported by the projects funded by                          COVID-19 pandemic in New York, USA. Sci Total
the Department of Science and Technology under                            Environ 728: 138835. [View]
Epidemiology Data Analytics (EDA) of Interdisciplinary              11.   Tosepu R, Gunawan J, Effendy DS, Lestari H, Bahar
cyber physical systems (ICPS) programme (Grant                            H, Asfian P (2020) Correlation between weather and
number: DST/ICPS/EDA/2018) and DST-RFBR                                   Covid-19 pandemic in Jakarta, Indonesia. Sci Total
project (Grant number INT/RUS/RFBR/P-336 2019)                            Environ 725: 138436. [View]

September 11, 2020                                         COVID-19 Pandemic: Case Studies & Opinions, Volume 01(04): 66–67, 2020
Spatio-Temporal Spread of Covid19
12. Turner BL (2002) Contested identities: human- 26. https://mohfw.gov.in
environment geography and disciplinary implications in 27. https://www.worldometers.info
a restructuring academy. Ann Assoc Am Geogr 92: 52–74.
[View]
13. Coccia M ( 2020) Factors determining the diffusion of
COVID-19 and suggested strategy to prevent future
accelerated viral infectivity similar to COVID. Sci Total
Environ 138474. [View]
14. Mollalo A, Vahedi B, Rivera KM (2020) GIS-based
spatial modeling of COVID-19 incidence rate in the
continental United States. Sci Total Environ 728: 138884.
[View]
15. Oto-Peralías D (2020) Regional Correlations of
COVID-19 in Spain. OSF Preprints. [View]
16. Guan WJ, Ni ZY, Hu Y, Liang WH, Ou CQ, He JX, Du
B (2020) Clinical characteristics of coronavirus disease
2019 in China. New England Journal of Medicine 382:
1708–1720. [View]
17. Huang H, Wang Y, Wang Z, Liang Z, Qu S, Ma S, Liu
X (2020) Epidemic Features and Control of 2019 Novel
Coronavirus Pneumonia in Wenzhou, China. SSRN China
3/3/2020. [View]
18. Arab-Mazar Z, Sah R, Rabaan AA, Dhama K, Rodriguez-
Morales AJ (2020)Mapping the incidence of the
COVID-19 hotspot in Iran – implications for travelers.
Travel Med Infect Dis [View]
19. Giuliani D, Dickson MM, Espa G, Santi F (2020)
Modelling and Predicting the Spatio-Temporal Spread
of Coronavirus Disease 2019 (COVID-19) in Italy
(3/20/2020). SSRN. [View]
20. Rezaei M, Nouri AA, Park GS, Kim DH (2020)
Application of geographic information system in
monitoring and detecting the COVID-19 outbreak. Iran
J Public Health 49: 114–116. [View]
21. Dagnino R, Weber EJ, Panitz LM (2020) Monitoramento
do Coronavírus (Covid-19) nos municípios do Rio
Grande do Sul, Brasil. SocArXiv. [View]
22. Desjardins MR, Hohl A, Delmelle EM (2020) Rapid
surveillance of COVID-19 in the United States using
a prospective space-time scan statistic: detecting and
evaluating emerging clusters. Appl Geogr 118: 102202.
[View]
23. Silva RJ, Silva K, Mattos J (2020) Análise espacial sobre a
dispersão da covid-19 no Estado da Bahia. [View]
24. Santana MV (2020) Juárez COVID-19 en México:
*
Corresponding author: Dr K C Gouda, CSIR Fourth
comportamiento espacio temporal y condicionantes Paradigm Institute, Wind Tunnel Road, Bangalore-37,
socioespaciales, febrero y marzo de 2020. Posición 3: India;
2683–8915. [View]
Phone: +91-80-25051344;
25. Pattison WD (1964) The four traditions of geography. J
Geogr 63: 211–216. [View] Email: kcgouda@csir4pi.in
September 11, 2020 COVID-19 Pandemic: Case Studies & Opinions, Volume 01(04): 67–67, 2020You can also read