Determination of ceftriaxone, ceftizoxime, paracetamol, and diclofenac sodium by capillary zone electrophoresis in pharmaceutical formulations and ...
←
→
Page content transcription
If your browser does not render page correctly, please read the page content below
Turk J Chem
                                                                                              34 (2010) , 921 – 933.
                                                                                              c TÜBİTAK
                                                                                              doi:10.3906/kim-1005-628

Determination of ceftriaxone, ceftizoxime, paracetamol,
and diclofenac sodium by capillary zone electrophoresis
   in pharmaceutical formulations and in human blood
                                                    serum

         Amber SOLANGI1,∗, Saima MEMON2 , Arfana MALLAH3 , Najma MEMON1 ,
               Muhammad Yar KHUHAWAR1 , Muhammad Iqbal BHANGER1
             1
               National Center of Excellence in Analytical Chemistry, University of Sindh,
                                            Jamshoro-PAKISTAN
                                       e-mail: ambersolangi@gmail.com
              2
                Institute of Advance Research Studies in Chemical Sciences, University of Sindh,
                                                 Jamshoro-PAKISTAN
                  3
                      M. A. Kazi Institute of Chemistry, University of Sindh, Jamshoro-PAKISTAN

                                                Received 20.05.2010

        A simple and fairly fast capillary zone electrophoresis method has been developed for the determination
    and separation of ceftriaxone, ceftizoxime, paracetamol, and diclofenac sodium in a mixture, in pharmaceu-
    tical formulations, and in blood serum. A 50 mM sodium tetraborate background electrolyte solution (pH
    9.0) was found to be suitable for separation of all the drugs. An uncoated fused-silica capillary of a total
    length of 57 cm (effective length 50 cm) was used for separation. All the analytes were completely separated
    within 8.0 min at an applied voltage of 30 kV and detection was performed at 214 nm .Validation of the
    method was performed in terms of linearity, accuracy, precision and limit of detection, and quantification.
    The linearity of the calibration curves for paracetamol was 5-125 μ g/mL, for ceftizoxime was 5-500 μ g/mL,
    for diclofenac was 1-125 μ g/mL, and for ceftriaxone was 10-1000 μ g/mL, while LOD of the paracetamol,
    ceftizoxime, diclofenac, and ceftriaxone was found to be 1.0, 1.0, 0.5, and 5.0 μ g/mL, respectively. The
    proposed method was applied for the determination of active ingredients in pharmaceutical formulations
    and active drugs in human blood serum. The recovery was found to be ≥ 99% with the relative standard
    deviation (RSD) ≤ 2.1% for both matrices.

    Key Words: Capillary zone electrophoresis, paracetamol, ceftriaxone, ceftizoxime, diclofenac sodium
∗ Corresponding   author

                                                                                                                   921
Determination of ceftriaxone, ceftizoxime, paracetamol, and..., A. SOLANGI, et al.,

Introduction
Commonly patients are treated simultaneously with different drugs including antibacterial, analgesic, and anti-
inflammatory drugs. Cephalosporin (either ceftriaxone or ceftizoxime) is very often prescribed with paracetamol
and diclofenac in different wards of hospitals especially in the Ear, Nose, and Throat ward. Cephalosporins are
β -lactam antibiotics with the same fundamental structural requirements as well as pharmacological effects
as penicillin. 1 These are used for the treatment of infections caused by gram-positive and gram-negative
bacteria. Ceftriaxone (CTR) and ceftizoxime (CFT) belong to the third generation of cephalosporin, capable
of inhibiting the biosynthesis of bacterial cell walls, and are most effective drugs used in modern chemotherapy.
The cephalosporins of third and fourth generation cannot be absorbed orally and are administered intravenously
or intramuscularly. 2,3 Paracetamol (PCT), (N -acetyl- p−aminophenol) is a common analgesic and antipyretic
drug that is used for the relief of fever, headaches, and other minor pains. It can be prescribed singly or with other
related drugs. 4,5 Diclofenac (DIC) is a comparatively safe and effective non-steroidal anti-inflammatory drug
(NSAID) with anti-rheumatic, anti-inflammatory, analgesic, and antipyretic properties. It is widely prescribed
for the treatment of degenerative joint diseases and other arthritic conditions. 6 It is available as either sodium
or potassium salt. Chemical structures of all 4 drugs are given in Figure 1.
       The selection of the drugs in this study depends on the frequency of their use. Antibiotics along with
diclofenac and paracetamol is the most frequently prescribed combination of the drugs used in this country,
where ceftriaxone and ceftizoxime are very common choices for antibiotics. Quantitative determination of these
drugs from biological fluids and tissues is necessary for monitoring the physiological and biochemical processes
involved in the drug metabolism and for timely correction and optimization of the treatment schedule. 7 It is
also very important for quality control of the drugs. Determination of the content of antibiotics and analgesics
in biological fluids and in commercially available formulations is therefore of analytical interest.
       Several analytical procedures are available for the analysis of cephalosporins using spectrophotometric
and high performance liquid chromatographic methods. 8−14 Electroanalytical techniques have also been em-
ployed successfully for the determination of numerous cephalosporins. 15,16 Analytical methods are also reported
for the determination of PCT singly or with a combination of other drugs from pharmaceuticals and biological
fluids 17,18 and for quantitative determination of DIC in pharmaceutical preparations. 19 Among all the tech-
niques mentioned above, none of them is reported for the combination of drugs mentioned here. Moreover,
reported liquid chromatographic methods describe solid-phase extraction clean-up techniques, which increase
overall analysis time, while electroanalytical techniques require redox properties for all analytes to be determined
simultaneously.
       Recently capillary zone electrophoresis (CZE) has appeared as an appropriate and friendly technique
for the analysis of complex formulations in terms of sample volume and sample clean-up, and it also affords
the separation power with detector compatibility for most of the drug’s analyte. It is shown as a valuable
alternative for the separation of cephalosporin 20,21 and for simultaneous determination of PCT with other
drugs. 22,23 CZE with chemiluminescence (CL) detection is also reported as a sensitive method for PCT. 24 DIC
is also determined using CE. 25,26 CZE is a microanalytical technique that provides advantages in terms of
simplicity, high efficiency, low cost, low sample consumption, and short analysis time.
     Therefore, the aim of the present study was to work out a fast and convenient (simple sample preparation)
CZE method for the simultaneous determination of 2 antibiotics (CTR and CFT), 1 analgesic (PCT), and 1

922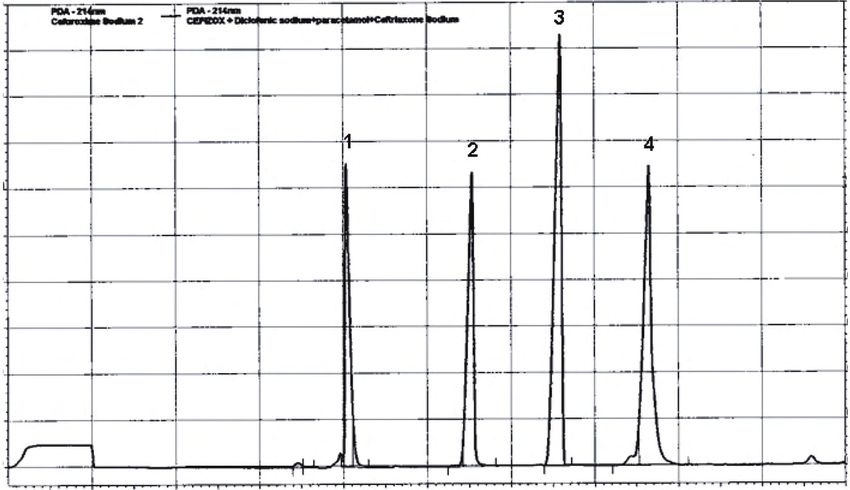
Determination of ceftriaxone, ceftizoxime, paracetamol, and..., A. SOLANGI, et al.,

                                                                                                    O

                                                                                                             ONa
                                                                                                N
                                                                   COONa
                                                      O                                                  N
                                            OMe
                                                              N                         S           N
                                        N

                               N                                                                    Me
                                                              H    S
                                                          H
                        NH2
                                             O
                               S
                                                          Ceftriaxone

                                    N
                                                              O
                                                                                                    S
                                                                       H
                                                      C       C        N
                              NH2       S

                                                      N       OCH3                          N
                                                                               O

                                                                                                    COOH
                                                          Ceftizoxime
                                                                           H
                                                                           N

                                                                                   O
                                        HO
                                                          Paracetamol
                                                                                   O

                                                                       O-
                                                                  NH

                                                 Cl                                Cl

                                                  Na+
                                                 (K+)
                                                          Diclofenac

                               Figure 1. Chemical structures of examined drugs.

anti-inflammatory (DIC) drug in a mixture, and separately in commercial formulations (injections and tablets)
and then also to find out if the method can be used for the simultaneous determination of 3 classes of drugs in
human blood serum to provide analytical services to local hospitals in this country.

Experimental
Instrumentation
The capillary electrophoresis (CE) system consists of Beckman Coulter P/ACE MDQ instrument (Beckman
Instruments Inc. Fullerton, CA, USA) equipped with an autosampler, photo-diode array detector, and a data

                                                                                                                   923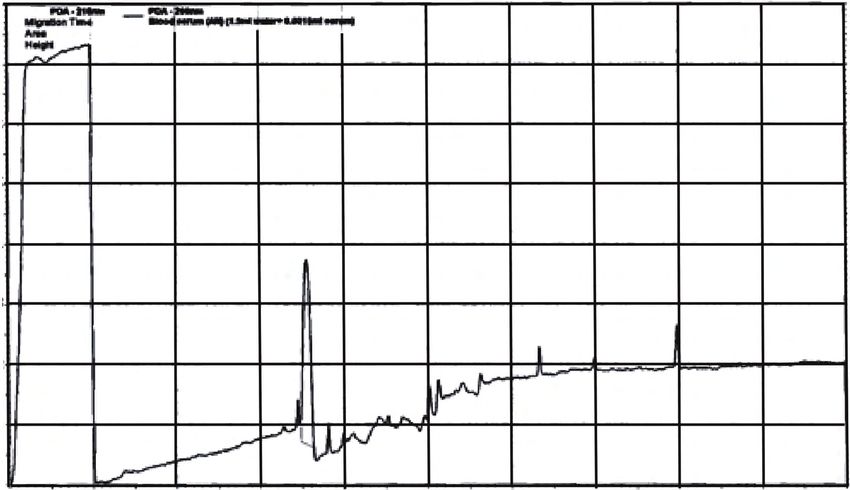
Determination of ceftriaxone, ceftizoxime, paracetamol, and..., A. SOLANGI, et al.,

handling system comprising an IBM personal computer and P/ACE system MDQ (32 Karat) software. The
fused silica capillaries were obtained from Beckman and had the following dimensions: 57 cm total length, 50
cm effective length, 75 μm ID, 375 μm OD. The temperature of the capillary and the sample was maintained
at 25 ˚C. At the beginning of the day the capillary was regenerated and conditioned with methanol for 1 min,
followed by water for 0.5 min, hydrochloric acid (0.1 M) for 2 min, water for 0.5 min, sodium hydroxide (0.1
M) for 2 min, water for 0.5 min, and then running electrolyte for 2 min. The pH measurement was made with
an Orion 420A pH meter connected to a glass-electrode and an internal reference electrode.

Reagents and solutions
All reagents were of analytical grade and solvents were of chromatographic purity. Pure standard compounds
of CFT, CTR, PCT, and DIC sodium were obtained from Abbott Laboratories, Karachi, Pakistan. Methanol,
sodium tetraborate, sodium hydroxide, and boric acid of GR grade were obtained from E-Merck, Germany.
The pH of sodium teteraborate was adjusted from 7.0 to 10 at an interval of 1 unit with boric acid or sodium
hydroxide and concentration was adjusted to constant value of 50 mM. Buffer electrolyte solutions were prepared
fresh daily. All the solutions were prepared with double distilled deionized water.

Standard solution
Stock solutions of each drug containing CFT, CTR, PCT, and DIC were prepared separately by dissolving 0.1
g of each drug in 100 mL of double distilled deionized water.

Analytical procedure
An aliquot of solution containing 5-500 μg/mL of CFT, 10-1000 μg/mL of CTR, 5-125 μg/mL of PCT, and
1-125 μg/mL of DIC sodium was placed in septum vial (1.5 mL). Before each sample injection the capillary
was washed with sodium hydroxide (0.1 M) for 2 min, with water for 0.5 min, and then equilibrated with the
running buffer for 2 min. The sample was injected by autosampler by hydrodynamic (injection pressure 0.5 psi
and injection time 4 s) method. The electropherogram was recorded using 50 mM sodium tetraborate (pH 9.0)
as a run buffer at an applied voltage 30 kV. The detection was performed at 214 nm.

Analysis of pharmaceutical preparation
Eight tablets of Neurofenac 50 mg (Novartis, Jamshoro, Pakistan) for DIC and Panadol 500 mg ((Glaxo Smith
Klin Pakistan Ltd)) for PCT were ground separately to a very fine powder. An amount equivalent to 5 mg
for each active ingredient was transferred into a 10 mL volumetric flask. Well mixed powder corresponding to
5-10 mg of active ingredient for the analysis of Cefizox injections 1000 mg (Bosch Pharma, Karachi, Pakistan)
for CFT and Rocephen injection 1000 mg (Merck Marker (Pvt.) Ltd. Quetta, Pakistan) for CTR was weighed
and dissolved in water. The final volume was adjusted to 10 mL and was shaken thoroughly to dissolve, the
volume was brought to the mark, and it was sonicated for 10 min. The final solution was filtered through filter
paper (Whatman # 42) and a clear solution was analyzed followed by analytical procedure. The quantitation
was carried out using an external calibration curve.

924
Determination of ceftriaxone, ceftizoxime, paracetamol, and..., A. SOLANGI, et al.,

Analysis of biological fluids
Blood samples (5 mL) from volunteers were collected after 2 h administration of the tablets Neurofenac (DIC
sodium) and Panadol (PCT) and taking Cefizox (CFT) injection intravenously. Each blood sample was collected
by vein puncture in a clean screw capped vial and centrifuged at 3000 rpm for 15 min. Supernatant was
separated and acetonitrile added (5 mL) and the contents were mixed for 2 min. The sample was centrifuged
for 15 min at 4000 rpm, supernatant was collected and organic solvent was evaporated at 45 ˚C under a nitrogen
stream. Subsequently the sample was transferred to a volumetric flask, volume was adjusted to 10 mL, and
then the sample was filtered through filter paper (Whatman #42). The clear solution was run for recording
electropherograms following the analytical procedure. The quantitation was made by external calibration curve.
A blank determination was carried out following the same procedure with a blood sample (5 mL) from a volunteer
who had not taken any medicine at least for 1 week.

Results and discussion

Development of separation method by capillary electrophoresis
All 4 drug compounds are water soluble, which omits solubility issues generally encountered in simultaneous
assay methods. Moreover, the 4 drugs are UV absorbing and show appreciable absorbance on 214 nm. Other
parameters that affect the separation, like buffer type and concentration, pH, and applied voltage, were
optimized for the baseline separation and simultaneous quantification of all 4 drugs.

Buffer selection

In order to obtain the optimum capillary electrophoretic conditions, 3 buffers namely sodium hydrogen phos-
phate, sodium bicarbonate, and sodium tetraborate in the pH range of 5-10 were investigated. Among these
buffers the best results were obtained with sodium tetraborate (pH 9.0) in terms of peak shape, resolution,
selectivity, and sensitivity. Therefore, it was selected and further optimized.

Effect of buffer pH

The separation mechanism in capillary electrophoresis is mainly based on differences in solute size and charge
at a given pH, which in turn governs the movement of analyte through the capillary. Therefore, electrophoretic
mobility of each of the compound at different pH was calculated using an equation previously used by the
authors. 15 Table 1 shows the values of electrophoretic mobility.
       In order to optimize the effect of pH of the buffer electrolyte (sodium tetraborate) on migration time, the
electrophoretic mobility as a function of pH was plotted (Figure 2). No separation was observed at pH lower
than 7.0. At pH 6.0 and below all the drugs co-eluted as only one broad peak. Therefore, the pH interval of 7.0-
10.0 was chosen for the preliminary study aiming to investigate the separation behavior of the standard mixture
containing CTR, CFT, PCT, and DIC sodium by CZE. By increasing the pH to 7.0, all 4 peaks appeared,
in which CTR and PCT were well separated while CFT and DIC overlapped and could not be resolved. At
pH 8.0, there was an improvement in separation of all 4 drugs but the resolution of CFT and DIC was poor.

                                                                                                            925
Determination of ceftriaxone, ceftizoxime, paracetamol, and..., A. SOLANGI, et al.,
Table 1. Analytical parameters of determination.
% RSD (n = 6)
μ ep (cm2 /kVmin (at
Determination R2
Range (μg/mL)
Migration time
Migration time
Inter-day error
Intra-day error
Name of Drug
Coefficient of
LOD μg/mL
LOQ μg/mL
C.L. 95%)
Peak area
Mobility
S.No.
(min)
-3.89 ±
1 Paracetamol 0.997 5-125 4.037 1.0 2.5 0.3 0.1 0.11
0.003 3.3
-6.76 ±
2 Ceftizoxime 0.995 5-500 5.537 1.0 0.5 0.5 0.15 0.2
0.0032 3.3
Diclofenac -9.51 ±
3 0.998 1-125 6.592 0.5 1.8 0.2 0.2 0.2
sodium 0.001 1.65
-11.50 ±
4 Ceftriaxone 0.996 10-1000 7.650 5.0 1.2 0.5 0.31 0.15
0.004 16.5
This can be rationalized on the basis that at pH greater than 7.0 the capillary walls as well as drugs become
negatively charged and the buffer makes a good electrical double layer at the capillary. Under the influence
of normal voltage, drug species move towards cathode and may separate on the basis of mass (the greater the
pH
0
6 7 8 9 10
-3
-6
Ionic Mobility
-9
-11
-15
-18
Paracetamol Ceftizoxime
Dichlofenac Ceftriaxone
Figure 2. Plot of pH vs. electrophoretic mobility.
926Determination of ceftriaxone, ceftizoxime, paracetamol, and..., A. SOLANGI, et al.,
mass the later it appears) or charge (more negative charge makes the species slower). Migration times observed
were in a different order (CTR > DIC > CFT > PCT) as compared to the molecular weights, which are in
the order of CTR > CFT > DIC > PCT. As PCT, DIC, and CFT have similar charges but different masses,
PCT appears first because of its lowest molecular mass. DIC, having a lower mass than CFT, appears after
CFT. This can possibly occur because CFT has a carboxylic group attached to the conjugated double bond and
hence has a less negative character as compared to the DIC, which has aliphatic oxygen; therefore CFT moves
faster and appears before DIC. CTR has the maximum charge (i.e. 2) as well as mass and so it appears last
(7.65 min). At pH 9.0, all 4 peaks were well separated from each other, moving with different migration times
with resolution factors greater than 6.0, whereas with increasing pH to 10 the trend was inversed where CTR
and DIC were moving with the same migration time and CFT and PCT were well separated. Therefore, finally
pH 9.0 was selected for separation of all 4 analytes.
Effect of buffer concentration
Effect of buffer concentration was studied in the 4 selected concentrations of sodium tetraborate (25-100 mM)
under constant instrumentation conditions (voltage 30 kV, injection time 4 s, injection pressure of 0.5 psi,
temperature 25 ˚C, and wavelength 214 nm). The optimal separation was obtained with 50 mM sodium
tetraborate buffer (pH 9), which was selected.
Effect of voltage and injection time
The effect of applied voltage on the separation was examined within 20-30 kV at an interval of 5 kV. The
migration time increased with the decrease in applied voltage, without any improvement in the resolution of
drugs. Therefore, the applied voltage of +30 kV was selected to achieve the shortest analysis time and the
highest separation efficiency. Sample injection time (1-5 s) and pressure (0.2-1.0 psi) were varied to achieve a
lower detection limit without affecting the quality of peak shape and reproducibility. An injection pressure of
0.5 psi and duration of 4 s injection time offered the best results and was selected.
At the optimized conditions the order of appearing of peaks in the electropherogram for all 4 drugs is
indicated in Figure 3.
Validation of the method
Linearity
In order to verify the method linearity within a concentration range of 5-125 μg/mL for PCT, 5-500 μg/mL
for CFT, 1-125 μg/mL for DIC and 10-1000 μg/mL for CTR, 3 replicates were prepared at 5 concentration
levels. The calibration curves were plotted for each of the 4 drugs (concentration vs. average peak height) and
response was linear with coefficients of determination of R 2 = 0.98, 0.995, 0.998, and 0.997, respectively. The
limit of detection (LOD) and limit of quantification (LOQ) measured as signal to noise ratio of 3:1 and 10:1
were obtained within 0.5-5 μg/mL and 1.65-16.5 μg/mL, respectively (Table 1).
927Determination of ceftriaxone, ceftizoxime, paracetamol, and..., A. SOLANGI, et al.,
Mixture
0.250 0.250
0.225 0.225
0.175 0.175
0.150 0.150
AU 0.125 0.125
0.100 0.100
0.075 0.075
0.050 0.050
0.025 0.025
0.000 0.000
0 1 2 3 4 5 6 7 8 9 10
Minutes
Figure 3. Electropherogram of mixture of PCT CFT, DIC sodium, and CTR: CE conditions: 30 kV, 214 nm; buffer:
(50 mM) Sodium tetraborate pH 9.0. Peaks: (1) PCT (2) CFT, (3) DIC, (4) CTR.
Precision and Accuracy
The intra- and inter-day precision (repeatability) was determined by total analysis of 6 replicate samples (n =
6), under the same conditions, by the same analyst, on the same day and on different days. The reproducibility
of the separation in terms of migration time and peak area/ height for all 4 drugs was examined and RSD
values of 0.2%-0.5% and 0.5%-2.5%, respectively, were obtained (Table 1). Three concentration levels of the
commercial samples were evaluated after performing the corresponding dilution. Determinations were made in
triplicate and the average recovery was more than 99%.
Selectivity
The response (migration time and peak shape) of the 4 analytes in test mixtures containing the analytes
and common excipients (glucose, lactose, sorbitol, gum arabic, starch, magnesium stearate, methylparaben,
and propylparaben) was compared with the response of solutions containing only the analyte with acceptable
results. The excipients were added at at least twice the concentration of the drug. No peak shape alterations
were observed, although new small peaks were present in the electropherograms. The excipients did not interfere
with the determination with relative % error within ±1.5%. It is important to consider that excipients do not
interfere in the determination of the 4 active ingredients since the samples used to evaluate recovery were
prepared with excipients.
928Determination of ceftriaxone, ceftizoxime, paracetamol, and..., A. SOLANGI, et al.,
Sample analysis of commercial pharmaceutical preparations
The procedure was examined for the analysis of 4 drugs from pharmaceutical preparations. The samples were
prepared using the procedure given above. The clear solution was run for recording electropherograms following
the analytical procedure. A fresh calibration curve was prepared followed by the analysis of the drug from
pharmaceutical preparation, after dissolution in water. The results of analysis for drugs in 4 pharmaceutical
preparations agreed with the labeled values with RSD (n = 4) within 0.2%-2.5% (Table 2).
Table 2. Recovery assay of all drugs from pharmaceutical formulations.
Name of Name of Amount Amount Amount % %RSD
S. No. compound tablet labeled added found Recovery n=4
(mg/Tab) (mg) (mg/Tab) (mean)
1 Ceftizoxime Cefizox 1000 0 1010∗ - 0.2
Injection
1 1011 100 0.5
5 1015.3 99.9 0.5
10 1025.8 100.5 0.6
∗
2 Paracetamol Panadol 500 0 525 2.1
1 524.2 99.8 1.9
5 528.9 99.7 1.9
10 539.2 99.8 1.8
∗
3 Diclofenac Neurofenac 50 0 45.0 2.1
Sodium
0.5 45.6 100 2.0
1 46.2 99 2.0
2 48.1 99 2.1
4 Ceftriaxone Rocephen 500 0 515∗ 1.9
Injection
1 516 100 2.0
5 520.5 99 2.1
10 529.9 99.7 2.1
*Taken as actual values
All 4 pharmaceutical preparations were also analyzed for the contents of CFT, CTR, DIC, and PCT
by the standard addition method. All solutions of pharmaceutical preparations were prepared as above and
standards were added and volume was adjusted to 10 mL in each case. The recovery of the drugs was calculated
within 99%-100%. The results are summarized in Table 2.
Sample analyses of human blood serum
A blank determination was carried out following the same procedure with a blood sample (5 mL) from a volunteer
who had not taken any medicine at least for 1 week (Figure 4). The blood samples (5 mL) of volunteers were
929Determination of ceftriaxone, ceftizoxime, paracetamol, and..., A. SOLANGI, et al.,
Mixture
0.008 0.008
0.007 0.007
0.006 0.006
0.005 0.005
AU
0.004 0.004
0.003 0.003
0.002 0.002
0.001 0.001
0.000 0.000
0 1 2 3 4 5 6 7 8 9 10
Minutes
Figure 4. Electropherogram of blood serum (as a blank) of a healthy volunteer who had not taken any drug for 1 week.
CE conditions same as in Figure 3.
Blood serum
0.250 0.250
0.225 0.225
0.175 0.175
0.150 0.150
AU 0.125 0.125
0.100 0.100
0.075 0.075
0.050 0.050
0.025 0.025
0.000 0.000
0.5 1.0 1.5 2.0 2.5 3.0 3.5 4.0 4.5 5.0 5.5 6.0 6.5 7.0 7.5 8.5
Minutes
Figure 5. Electropherogram of human blood serum of a patient who had taken PCT (500 mg) CFT (1000 mg), and
DIC sodium (50 mg): CE conditions same as in Figure 3.
930Determination of ceftriaxone, ceftizoxime, paracetamol, and..., A. SOLANGI, et al.,
collected after 2 h administration of the tablets Neurofenac for DIC, Panadol for PCT, and Cefizox injection
for CFT intravenously. The blood sample was treated using the procedure given above. The clear solution was
run for recording electropherograms following the analytical procedure (Figure 5). From the electropherogram
it can be observed that the simple sample pretreatment with acetonitrile is enough to clean the sample and
excellent % recoveries were possible. Quantitation was done by external calibration curve. This eliminates the
need for an internal standard.
Blood serum
0.20 0.20
0.18 0.18
0.16 0.16
0.14 0.14
0.12 0.12
AU
0.10 0.10
0.08 0.08
0.06 0.06
0.04 0.04
0.02 0.02
0.00 0.00
0.5 1.0 1.5 2.0 2.5 3.0 3.5 4.0 4.5 5.0 5.5 6.0 6.5 7.0 7.5 8.5
Minutes
Figure 6. Electropherogram of blood serum added with 25 μ g of PCT and 35 μ g CFT, CE conditions same as in
Figure 3.
Table 3. Recovery assay of drugs from biological fluids (blood serum).
Name of Name of Amount Amount Amount %
S.No. compound tablet taken added found Recovery %RSD
(mg/Tab) (μg) (mg/L)
1 Ceftizoxime Cefizox Injection 1000 0 197.36 - 2.1
35 230.26 99 2.3
2 Paracetamol Panadol 500 0 66.88 - 1.7
25 91.8 99 2.5
∗
3 Diclofenac Sodium Neurofenac 50 – ND
*ND = not detected
The amounts of drugs from serum were 197.36 μg/mL of CFT and 66.88 μg/mL of PCT with RSD of
2.1% and 1.7%, respectively. The amount of DIC could not be detected due to its pharmacokinetics. The %
931Determination of ceftriaxone, ceftizoxime, paracetamol, and..., A. SOLANGI, et al.,
recovery from serum was calculated by spiking the known amount (35 μg) of CFT and 25 μg of PCT in serum
samples (Figure 6) and was found to be 99% with %RSD in the range of 2.3%-2.5% (Table 3).
Conclusion
A simple CZE method has been developed that enables complete separation of 4 drugs within only 8 min.
Successful analysis of drugs from commercially available pharmaceuticals shows the efficiency of method for
application in quality control. The selectivity and separation efficiency of CZE was found to be suitable for
the analysis of biological samples (serum). The results obtained in this study prove CZE to be an attractive
alternative to HPLC for the analysis of drugs in clinical samples as well as in commercial formulations.
References
1. Dawson, R.; Elliott, D.; Elliott, W.; Jones K. (eds.), Data for Biochemical Research, Clarendon, Oxford; 1986.
2. Bryskler, A.; Procyk, T.; Tremblay, D.; Lenfant, B.; Fourtillan, J. B. J. Antimicrob. Chemother. 1990, 63, 26-59.
3. Brockmeier, D.; Dagrosa, E. Hoechst Clin. Res. 1992, 20, 14-17.
4. Ayora-Cañada, M. J.; Pascual-Reguera, M. I.; Ruiz-Medina, A.; Fernández-de Córdova, M. L.; Molina-Dı́az, A. J.
Pharm. Biomed. Anal. 2000, 22, 59–66.
5. Ruiz-Medina, A.; Fernández-de Córdova, M. L.; Ayora-Cañada, M. J.; Pascual-Reguera, M. I.; Molina-Dı́az, A.
Anal. Chim. Acta. 2000, 404, 131-139.
6. Sweetman, S. C. (Ed.), Martindale: The Complete Drug Reference, 35th ed., Pharmaceutical Press, London &
Chicago; 2006.
7. Sokolova, L. I.; Chernyaev, A. P. Pharma. Chem. J. 2002, 36, 263-269.
8. Al-Momani, I. F. J. Pharm. Biomed. Anal. 2001, 25, 751-757.
9. Doadrio, A. L.; Mayorga, A.; Orenga, R. J. Braz. Chem. Soc. 2002, 13, 95-100.
10. El-Walily, A. F. M.; Gazy, A. A.; Belal, S. F.; Khamis, E. F. J. Pharm. Biomed. Anal. 2000, 22, 385-392.
11. El-Shaboury, S. R.; Saleh, G. A.; Mohamed, F. A.; Rageh, H. J. Pharm. Biomed. Anal. 2007, 45, 1-19.
12. Samanidou, V. F.; Hapeshi, E. A.; Papadoyannis, I. N. J. Chromatogr. B. 2003, 788, 147-158.
13. Samanidou, V. F.; Ioannou, A. S.; Papadoyannis, I. N. J. Chromatogr. B. 2004, 809, 175-182.
14. Nemutlu, E.; Kır, S.; Katlan, D.; Beksaç, M. S. Talanta 2009, 80, 117-126.
15. Solangi, A. R.; Mallah, A.; Khuhawar, M. Y.; Bhanger, M. I. Pak. J. Anal. Envir. Chem. 2006, 7, 107-111.
16. Al-ghamdi, A. H.; Al-shadokhy, M. A.; Al-warthan, A. A. J. Pharm. Biomed. Anal. 2004, 35, 1001-1009.
17. Šatı́nský, D.; Neto, I.; Solich, P.; Sklenáová, H.; Conceição, M.; Montenegro, B. S. M.; Araújo, A. N. J. Sep. Sci.
2004, 27, 529-536.
18. Knochen, M.; Giglio, J.; Reis, B. F. J. Pharm. Biomed. Anal. 2003, 33, 191-197.
19. Mazurek, S.; Szostak, R. J. Pharm. Biomed. Anal. 2008, 48, 814-821.
20. Gaspdr, A.; Kardos, Sz.; Andrdsi, M.; Klekner, A. Chromatographia 2002, 56, 109-114.
932Determination of ceftriaxone, ceftizoxime, paracetamol, and..., A. SOLANGI, et al.,
21. Solangi, A. R.; Memon, S. Q.; Khuhawar, M. Y.; Bhanger, M. I. Acta Chromatographica 2007, 19, 81-96.
22. Azhagvuel, S.; Sekar, R. J. Pharm. Biomed. Anal. 2007, 43, 873-878.
23. Suntornsuk, L.; Pipitharome, O.; Wilairat, P. J. Pharm Biomed. Anal. 2003, 33, 441-449.
24. Shulin, Z.; Wenling, B.; Hongyan, Y.; Dan. X. Anal. Chim. Acta. 2006, 559, 195-199.
25. Aurora-Prado, M. S.; Steppe, M.; Tavares, M. F. M.; Kedor-Hackmann, E. R. M.; Santoro, M.; Inês, R. M. J.
AOAC. International 2002, 85, 333-337.
26. Jin, W.; Zhang, J. J. Chromatogr A. 2000, 868, 101-107.
933You can also read