EVALUATION OF THE RELATIONSHIP BETWEEN INFORMAL EMPLOYMENT, INCOME TAX AND ECONOMIC GROWTH ON TERMS OF TURKEY ECONOMY1 - DERGIPARK
←
→
Page content transcription
If your browser does not render page correctly, please read the page content below
Special Issue on Applied Economics and Finance

       Evaluation Of The Relationship Between Informal
    Employment, Income Tax And Economic Growth On Terms
                     Of Turkey Economy1
    Kayıt Dışı İstihdam, Gelir Vergisi Ve Ekonomik Büyüme Arasındaki İlişkinin
                    Türkiye Ekonomisi Açısından Değerlendirilmesi

                                        Mustafa Goktug KAYA, Turkey, goktugkaya@hotmail.com

Abstract: The informal economy has become one of the most important problems in our country as a result of informal employment in working life.
While economic, legal, social and cultural reasons are influential in the emergence of informal employment, the financial burden on employment are
shown as one of the most important causes of informal employment in Turkey. However, the greatest loss of informal economic activities to the
economy is tax loss. The tax burden on formal employees is increased to eliminate deficits in the government's budget result of informal activities.
This situation further increases the informality. For this reason, the state is trying to reduce informality with policies. In this study, the relationship
between informal employment, the index of industrial production as a determinant of economic growth and tax revenues was investigated by using
Multiple Regression Analysis with monthly data for 1996-2017 period. According to the analysis results, there is a positive relationship between the
industrial production index and informal employment, but a negative relation with the income tax.

                           Keywords: Informal Economy, Informal Employment, Income Tax, Industrial Production Index, CPI, Turkey

Öz: Kayıt dış ı ekonomi, ç alış ma hayatında kayıt dış ı istihdam ş eklinde karş ımıza ç ıkarak ülkemizde en önemli sorunlarından biri haline gelmiştir.
Kayıt dış ı istihdamın ortaya ç ıkmasında ekonomik, hukuki, sosyal ve kültürel bir takım nedenler etkili olmakla birlikte, Türkiye’de kayıt dış ı istihdamın
en önemli nedenlerinden biri olarak istihdam üzerindeki mali yükler gösterilmektedir. Bununla birlikte kayıtdışı iktisadi faaliyetlerin ekonomiye
verdiği en büyük zarar vergi kaybıdır. Kayıt dış ı faaliyetler sonucu devletin bütç esinde ortaya ç ıkan aç ıklar kayıtlı ç alış anlar üzerine vergi yükünün
arttırılması yoluyla kapatılmaya çalışılmaktadır. Bu durum ise kayıtdışılığı daha fazla arttırmaktadır. Bu çalışmada 1996-2017 dönemi aylık verileri
kullanılarak kayıtdışı istihdam, ekonomik büyümenin belirleyicisi olarak sanayi üretim endeksi ve vergi gelirleri arasındaki ilişki Çoklu Regresyon
Analizi ile araştırılmıştır. Analiz sonuçlarına gore sanayi üretim endeksi ile kayıtdışı istihdam arasında pozitif buna karşılık gelir vergisi ile negatif
bir ilişki söz konusudur.

                        Anahtar Sözcükler: Kayıt Dışı Ekonomi, Kayıt Dışı İstihdam, Gelir Vergisi, Sanayi Üretim Endeksi, TÜFE, Türkiye

1.Introduction

Beginning from 1970s, in the direction of crises all over the world, in order for capitalism to be rid of depression from
it enters, neoliberal policies were applied and, with a new strategy of capital accumulation, profit rates of capital were
tried to be increased. However, this process, in the developed and developing countries, led informal economy to grow.
Informal economy expresses all economic processes and activities, which cannot be legally documented and are not
taken into consideration in gross domestic product (GDP) calculations and which is not included in the official records.
In general, informal economy, which are explained in the way that government cannot take any share from the gains
that comes to exist as a result of economic activities that are not taken under record or activities realized, is an important
economic problem seen in all countries but emerging at the different levels according to the developedness states of
countries. In informal economy, due to the fact that the data cannot be under record, macro variables of countries such
as national income, employment, and unemployment are faultily calculated.
     Informal economy has many political, social, and legal reasons varying from country to country. Among these
reasons, there are economic reasons such as inflation, crises, economic instabilities, excessive tax load; political reasons
such as political instability and populist policies; social policies such as rural-urban migration, security problem; and
legal reasons such as bribery, corruption, and tax amnesty.
     The most important issue considered and discussed in informal economy and accepted as reflecting face informal
economy to business life is informal employment. Informal employment is expressed as missing reporting of the

1
  Bu çalışma Mustafa Göktuğ Kaya özet bildirisi olarak, “ICOAEF’18, IV. International Conference on Applied Economics and Finance & EXTENDED
WITH SOCIAL SCIENCES, November 28 – 29 – 30, 2018 / Kuşadası – Turkey” Kongresinde sanal oturumda sunulmuştur ve kongre procedia özet
kitapçığında basılmıştır.
Kaya, M., G. / Journal of Yasar University, 2019, 14 (Special Issue), 108-117
employment durations of employees and wages paid for them to the official institutes or not reflecting employment
information to the official documents. One of the most important problems informal employment leads to is not to be
deducted tax from the incomes obtained as production and service made. Therefore, one of the most important issues
that are necessary to be emphasized related to informal employment or economy comes to our face as tax avoidance
and tax evasion.
In the developing countries, the reasons leading the rates of informal employment to increase are insurance
deduction and high-rate taxing policies. For struggling with informal employment and preventing informal economy,
some steps should be taken in the direction of lightening financial loads on the employees and employers and providing
justice in taxing. In related to these steps, there are some points such as distributing tax load more fairly, adjusting the
rates of direct and indirect tax in total taxes, making a reform in tax system, and taking tax exemptions and tax amnesty
under control.
Although the studies have been carried out for reducing the rate of informal economy in total economy in Turkey,
it is a reality that these studies are not enough. In this study, using the monthly data of the period 1996-2017, the
relationship between informal employment and industrial production index as determinant of economic growth, and tax
incomes was studied by Multiple regression Analysis. In this direction, in this study, firstly, the general information is
given about informal economy and informal employment, among its components and, assessing the dimension of
informal employment in Turkey, tax relationship is dealt with.
2. Informal Employment in Conceptual Framework And Its Development in Turkey
Informal economy is a comprehensive concept, which does not have s single definition and which comes to our face in
the literature under many the names such as underground economy, shadow economy, and unofficial economy (Erkuş
and Karagöz, 2009: 128). In a broad sense, informal economy is “all activities creating income, which are used in GDP
calculation and which cannot be predicted according to the known statistical methods” (Derdiyok, 1993:54).
In the strict sense, informal economy is expressed as “not documenting all or some part of the processes that are
the subject of tax due to high and unfair tax load or the other reasons for tax avoidance” (Ay et al, 2014:24). In taxing
sense, informal economy is defined as “all of activities left out of information area of tax office with the motive of tax
aversion and tax avoidance” (Altuğ, 1999:3).
Informal employment is one of the most important parts of informal economy. Informal employment, without
complying with legal rules regulating social security system and business life, emerges in the form of employing worker
as informal and without declaration or working on its own behalf (GİB,2009:25). At the present time, it is estimated
that about 55% of the sector working as paid-employment are active in informal way (Karaaslan, 2010: 2). Informal
employment comes to our face in two forms: First is those not reporting the jobs at all, in other words, foreign illegal
workers, child labors, those having incomes from social security institute and the second is those underreporting jobs
as wage or day (Karaaslan, 2010:30-50).
While increase of informal employment has an important effect at the point of reducing labor cost by reducing
unemployment and eliminating the obligations such as tax and insurance, it leads government incomes to decrease,
unfair competition, economic data not to be able to be calculated accurately, foreign illegal labor to increase, employees
not to have security, them not to be able to benefit from social security services, and not to have right to compensation.
In addition, since activities made as a result of informal employment are not taxed, government undergoes to tax loss,
and public services cannot be fulfilled at the adequate level. As a result of these, direct tax such as income tax and
company tax that cannot be collected are tried to be met by increasing indirect incomes (Güloğlu, Korkmaz and Kip,
2003:55-60).
In Turkey, informal employment comes to our face in two forms. First is that the person himself/herself prefers to
work in informal way, in which the farmer, craft, trader, and self-employed people are included. The second is that the
person is employed in informal way by his/her employers without his/her will.
Table 1. Reasons for Informal Employment
Types Reasons
Economic -Unemployment -poverty
-failure of the formal sector to meet labor supply
-injustice in the distribution of income and tax burden
109Kaya, M., G. / Journal of Yasar University, 2019, 14 (Special Issue), 108-117
-change in the sectoral structure of employment
-tax and insurance premiums height
Social - Population growth - migration - narrow urbanization - low level of education
From public - confusion of legislation - a multitude of jobs - difficulty and insufficiency of control
From business - Small enterprises - low competitiveness of enterprises
-contract manufacturing -non-branding
From social -social security forgiveness -minimum wage -retirement age and pension system
security system
From tax -tax amnesty
system
Source: E. Karaaslan, Kayıt dışı İstihdam ve Neden Olduğu Mali Kayıpların Bütçe Üzerindeki Etkileri: Türkiye
Örneği, 2010, p.53
As will also be seen from the above table, among the causes of informal employment, there are economic causes
such as unemployment, poverty, that formal sector not to be able meet labor supply; social causes such as population
increase, immigration, irregular urbanization; public-based causes such as complexity of legislation and multiplicity of
bureaucratic process; business –based causes such as not being able to brand, contract manufacturing, prevalence of
small enterprises; social security system –based causes such as minimum wage, retirement age, retirement system; and
taxing system –based causes such as frequent tax amnesty.
There are an opposite directional relationships between informal economy and developedness level of countries.
While the rates of informal employment are lower in developed countries, in developing countries, they are higher. In
Turkey, while the rates of informal employment are lower at the present time than many developing countries, when
compared to OECD and EU-member countries, it is seen that this rate is higher than most of them (Yağmur, 2013:7).
In other words in the developed countries, while unemployment and underemployment decrease as economy grows, in
the developing countries, it increases as economy grows (Chen, 2012:2).
Table 2. Informal Employment in Turkey between the years 2006-2017 (%)
Years Agriculture non- Industry Service Construction General
agricultural
2006 87,77 34,06 38,12 31,88 - 46,97
2007 88,14 32,34 35,51 30,63 - 45,44
2008 87,84 29,76 31,61 28,77 - 43,5
2009 85,84 30,08 33,43 28,4 - 43,84
2010 85,47 29,06 32,68 27,11 - 43,25
2011 83,85 27,76 31,5 25,71 - 42,05
2012 83,61 24,51 27,89 22,73 - 39,02
110Kaya, M., G. / Journal of Yasar University, 2019, 14 (Special Issue), 108-117
2013 83,28 22,4 25,23 20,9 - 36,75
2014 82,27 22,32 20,26 21,09 36,61 34,97
2015 81,16 21,23 19,13 20,05 35,58 33,57
2016 82,09 21,72 20,2 20,35 35,76 33,49
2017 83,33 22,1 20,03 20,95 35,80 33,97
Source: Sosyal Güvenlik Kurumu, Kayıt Dışı İstihdam Oranları, 2018
When the table above is examined, most of those informal employed in Turkey are in the agricultural sector. At the
present time, more than 80% of those working in agricultural sector are still working in informal way. In informality,
industrial sector follows agricultural sector. In the period of 2006-2017, the rate of informality in Turkey reduced from
46s % to 33s %. However, this fall is not enough.
In Turkey, one of the most important reasons for informality is tax load on employment.
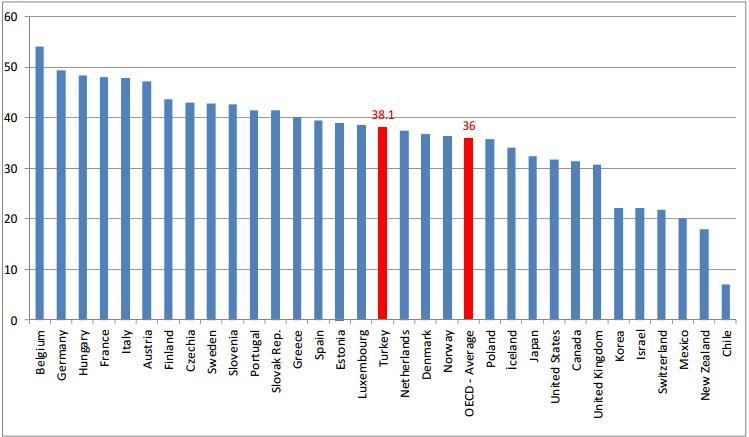
Graph 1. Tax Load on Employment (2016 %)
Source: Hazine ve Maliye Bakanlığı, Ekonomi Sunumu, 2019
In 2016, in Turkey, the tax load on employment is 38.1%. In the same period, OECD average is 36%. In Turkey,
heavy tax load in employment reduces competitive power of businesses. In OECD countries, tax rates from direct taxes
is higher than the rates of indirect taxes such as VAT and SCT (Special Consumption Tax). In the developing countries,
that the rates of indirect tax rates are higher than indirect tax rates increases injustice in the distribution of tax load. In
return to this, in OECD countries, there are a fairer tax system and less informality (Işık and Kılınç, 20096:149).
111Kaya, M., G. / Journal of Yasar University, 2019, 14 (Special Issue), 108-117
Table 3. the rates of Indirect and Direct Taxes in Total Taxes in Turkey (%)
Years Indirect taxes Direct taxes
2006 70,7 29,3
2007 68,1 31,9
2008 66,9 33,1
2009 66,9 33,1
2010 71,4 28,6
2011 70,1 29,9
2012 69,2 31,8
2013 71,8 28,8
2014 69,9 30,1
2015 70,8 29,2
2016 69,6 30,4
2017 67,8 32,2
Source: C. Rakıcı ve C. Aydoğdu, 2000 Yılı Sonrası Türkiye’de Vergi Performansının Değerlendirilmesi, 2017, p.234;
Gelir İdaresi Başkanlığı, Genel Bütçe Vergi Gelirleri, 2018
In Turkey, when the share of direct and indirect taxes in total taxes is examined, in 2006, while the rate of indirect
tax incomes such as VAT, SCT, stamp tax, and fees in total tax incomes is 70.7%, in 2017, it fell to 67.8%. As seen, in
the years, more fall were not experienced. In return to this, while the rate of direct taxes such as income tax, company
tax, and etc. is 29.3% in 2006, it could rise to 32.2% in 2017. In general, in the countries, where the share of indirect
taxes is high, informal economy become higher. In another words, this injustice distribution in the direct and indirect
taxes comes to our face as the most important reason for informal economy.
With the increase of the social role of the state taxes that the public financing tool has become an important source
of income. When the looking from this perspective, for the countries of strategic importance the economy in the center
of from the taxes loss and leakage is a serious problem (Öz et al, 2012:330).
That tax load is not fairly distributed prompts taxpayers to avoid tax. This case leads informal economy to grow. In
this direction, for making informal economy recorded, in exemption and exception applications, changes for promoting
production should be made; indirect and direct tax rates should be again regulated and justice should be provided;
stoppage should not be used as final taxing instrument; steps should be taken in the solution of structural problems such
as social security; and supervisions directed to tax should be increased (Kalkınma Bakanlığı, Kalkınma Planları).
3.Literature Review
In Turkey, although many studies are carried out related to informal economy and informal employment, the number of
studies dealing taxing dimension of informal employment with econometric analysis is quite a little. There is no a full
consensus directed to whether informal employment positively or negatively affect economy.
Ay, Sugözü and Köse (2005), in their study, studied the relationship between informal economy and tax incomes
in Turkey, using the data of the period 1968-2001 by means of time series analysis. According to the findings obtained,
in Turkish economy, while the increase occurring in the share in GDP of total tax incomes taxpayers to go toward
informal economy, when this variation is negative, the tendency in question decreases. Ay, Sugözü and Erdoğan
assessed the relationship between informal economy and tax load, inflation and tax amnesties specific to Turkish
economy, using the data of the period 1985-2012. According to the method of Extended Monetary Rate, the dimension
112Kaya, M., G. / Journal of Yasar University, 2019, 14 (Special Issue), 108-117
of informal economy in Turkey was calculated. According to Granger Causality Test, there are an unilateral causality
from tax load to informal economy and from inflation to tax load. According to general assessment made in the study,
for reducing informal economy, arrangements should be made toward lightening tax load and providing price stability.
Baldemir, Gökalp and Avcı (2006) analyzed the relationship between informal economy and tax incomes and tax
load, interest rates, Wholesale Price Index (WPI), and openness for the period 1980-2002 in Turkey, using Mimic Model
and concluded that the variables of openness positively affected informal economy and, in return to this, that
unemployment rates negatively affected.
Akalın and Kesikoğlu (2007) dealt with the relationship between informal economy and economic growth.
According to the analysis results, informal economy affects economic growth in positive direction. In addition,
according to Granger causality test made, there is a causality from informal economy to growth.
Elveren and Özgür (2016), in their study, analyzed the relationship between informal economy and income
inequality in Turkey between the years of 1963 -2008 by means of Johansen co-integration and Granger Causality Test,
using representative production –income inequality index as a new index for informal economy. According to the
analysis results, an increase in income inequality expand informal sector, and unemployment affects informal sector in
negative direction.
4.Dataset And Method
In our model, in order to find the effect of informal employment that is its main determinant on gross domestic product,
the use of datasets belonging to tax incomes, employment and production factors was preferred. In order to be able to
identify the relationship between these factors and informal economy, our main determinant, multiple regression
analysis was used.
Datasets used in regression model were obtained from statistical databases of Turkish Statistical Institute (TSI),
Social Security Institution (SSI), and Central Bank of Turkish Republic (CBTR). The data were subjected to the various
classifications and decomposition methods and made usable in the model. In econometric analysis of the data, Eviews
7 package software was used. As a result of the study carried out about the suitability of dataset, in the model, sample
interval suitable for using was identified as monthly time series between the years of 2006-2017. For time series, due
to the fact that monthly data of 144 periods, it was seen that these were suitable for in terms of the distribution of data
and outputs of econometric analysis.
In the model, the dataset of Industrial Production Index, which is the main determinant of GDP, was used. The
reason for this is that our model forms with monthly dataset and that GDP data for the interval of the relevant period
are not monthly present.
4.1.Findings and Discussion
While beginning to the prediction of model, firstly, the logarithms of time series were taken. If econometric analysis
will be made in a time series, the most important point is the stationarity of that series. In the analyses carried out in the
series that are not stationary, the problem with spurious regression may occur. This case does not reflect the relationship
between the variables in the real meaning .(Granger and Newbold,1974: 111-120). That a series does not contain unit
root means that the mean and variance of series do not vary in time (Gujarati and Porter,2009:22). The basic graphic
analysis of examining the stationarity of time series is made by means of correlogram and unit root analysis.
Table 4.Results of ADF Statistic
ADF Statistic
Cratical Value
Variables Test Statistic
1% 5% 10%
Industrial production index 0,29 -3,48 -2,88 -2,58
*Industrial production index -14,47 -3,48 -2,88 -2,58
informal employment -1,02 -3,48 -2,88 -2,58
informal employment* -3,95 -3,48 -2,88 -2,58
113Kaya, M., G. / Journal of Yasar University, 2019, 14 (Special Issue), 108-117
income tax 1,24 -3,48 -2,88 -2,58
income tax* -7,69 -3,48 -2,88 -2,58
indirect tax -0,01 -3,48 -2,88 -2,58
indirect tax* -3,72 -3,48 -2,88 -2,58
CPI 4,24 -3,48 -2,88 -2,58
• expresses test results after the 1st differences of series were taken
In order to be able to examine whether or not time series have unit root, in this study, Augmented Dickey Fuller
test was used. As a result of the test, unit root was identified, it was observed that series became stationary, when its 1 st
difference was taken. This case is seen in the outputs of test in the table taking place above. That stationarity is provided
means that long term balance is also provided. After model prediction is made, deviation tests from possible assumptions
were made. Firstly, whether or not error terms are normally distributed was tested by Jarque Bera test and it was
understood that error terms had normal distribution (Jarque-Bera Test= 0,39>0,05). In this stage, the presence of
autocorrelation problem was studied and that model- dependent laggings are added prevented the possible
autocorrelation problem. Due to the fact that laggings take place in the model, instead of Durbin-Watson, Durbin’s
alternative test was made and as a result of this, it was understood that model did not have any problem with
autocorrelation. Secondly, in the model, the presence of the problem with varying variance was studied and White
heteroscedasticity test was made. Accepting H0, it was seen that remains had constant variance at 5% significance level
and that there was no problem with varying variance in the model (White Heteroscedasticity: 0,56>0,05). Lastly,
Ramsey Reset test was made and whether or not there was diagnosis error in the model was controlled. It was identified
that such an error was not present. For preventing the effect of break, dummy variable was added to the model and
Model 3 multiple regression model taking place in the table was predicted.
As a result of the analysis made, multiple regression models taking place below were predicted. Firstly, Model 1
was formed. In Model 1, besides that R2 is not at the desired level, skips were seen and, firstly, lagging was added to
the model, then, 11th lagging, another skip period, was added to the model. Here, that the lagged value of independent
variable to the model enabled the possible autocorrelation problem to be eliminated. It was seen that 1 st and 11st laggings
of dependent variable added to the model in two stages also raised R2 in the model i.e. that it provided a significant
improvement. In this way, Model 2 was predicted. However, in the interval of the relevant period, for the year 2008, in
which break was identified, adding to dummy variable to the model, the effect of break on the model was prevented.
Thanks to this, Model 3 was predicted. Lastly, Model 3 obtained, error terms were tested by Jarque-Bera normality test
and test statistics turned out bigger than 0.05, thus, normality assumption actualized. In addition, all parameters
(including dummy variables) were tested at the significance level of 0.05 and found significant.
Table 5. Result of Least Square Methods
Dependent Variable: Industrial Production Index
Method: Least Squares
Included observations: 144
Model 1 Model 2 Model 3
Variable Coefficient t-Statistic Coefficient t-Statistic Coefficient t-Statistic
Informal Employment 0,17 2,33 0,21 2,41 0,37 2,53
Income tax -0,15 -1,99 -0,19 -1,95 -0,13 -2,08
Indırect tax 0,11 5,13 0,26 5,92 0,29 6,66
CPI 1,06 2,82 1,13 3,06 1,19 3,31
114Kaya, M., G. / Journal of Yasar University, 2019, 14 (Special Issue), 108-117
First Lag - - -0,3 -3,66 -0,13 -2,4
11. Lag - - -0,53 -2,84 -0,29 -2,53
dummy - - - - -0,05 -2,22
C 0,49 1,83 0,41 3,54 0,12 4,51
R-squared 0,20 0,24 0,68
Adjusted R-2 0,16 0,21 0,66
Prob(F-statistic) 0 0 0
In the model taking place above, if the coefficients belonging to the independent variables are interpreted, a 1%
increase that will occur in informal employment will provide a 0.37% increase will provide industrial production index.
In the same way, a 1% increase in income tax will reduce industrial production by 0.13%. Namely, while there is a
positive relationship between industrial production index and informal employment, there is a negative directional
relationship between informal employment and income tax. When an evaluation is made in terms of indirect taxes, in
contrast to income tax, it was observed that there was a positive directional relationship. In the model, the highest rate
determinant was CPI (Consumer Price Index) . A 1% increase or decrease that will occur in CPI will cause to 1.19 %
increase or decrease in industrial production: In other words, it was understood that it had an effect of 120%. Here, it is
considered that an increase occurring in indirect taxes in respect of years leads model to give a positive result.
Dependent Variable: Informal Employment
Method: Least Squares
Included observations: 36
Model 1 Model 2
Variable Coefficient t-Statistic Coefficient t-Statistic
GDP 0,51 4,13 0,31 2,98
Total Employment 0,53 3,26 0,39 2,16
Manufacturing Production - - 0,19 3,49
Agricultural Employment - - 0,25 4,21
C 0,03 2,93 0,01 2,55
R-squared 0,77 0,80
Adjusted R-2 0,74 0,78
Prob(F-statistic) 0 0
In order to measure the effect of GDP, employment, and production on informal employment, Model 1 and Model
2 taking place in the table above were predicted. As a result of multiple regression model established, a 1% increase
that will occur in GDP will cause to 0.51% in informal employment. Again, in the same way, it shows a similar effect
on total employment and a 1% increase that will occur in total employment will cause to a 0.53% increase on informal
employment. Although the result obtained here shows the positive relationship between GDP and informal employment,
it also confirms the effect of cheap labor force on GDP increase. The result clearly revealing in Model 2 shows that the
increases in employment and production will directly increase informal employment i.e. that the cheap labor force is
attractive.
115Kaya, M., G. / Journal of Yasar University, 2019, 14 (Special Issue), 108-117
5.Conclusion
Informal economy is one of the most important problems countries have experienced in the recent years. When regarded
in terms of countries, the reasons for informality differ according to their political, economic, social, and cultural
structures. Despite these differences, among the most important reasons for informality, there are economic and
financial reasons such as excessive tax load, inflation, economic instability, and crises. Beside economic reasons,
political complexity and lack of legal legislation have also importance.
High tax rates and insurance premiums prompt employers to informality in labor force market. Therefore, in order
to struggle with informal employment and prevent informal economy, some steps should be taken for lightening
financial loads on workers and employers and providing tax justice. In other words, in total tax rates, the rates of direct
and indirect tax should be better regulated. The loads on the wages should be lightened and recorded economy should
be promoted.
In this study, using the monthly data of the period 1996-2017, informal employment, the relationship between
informal employment, industrial production index as the determinant of economic growth, and tax incomes by means
of Multiple Regression Analysis. According to the results of analysis, while an increase that will occur in informal
employment increases industrial production, an increase that will occur in tax income reduces industrial production.
When an evaluation is made in terms of indirect taxes, in contrast to income tax, it was observed that there was a positive
directional relationship. Especially, an increase or decrease that will occur in CPI causes to an increase or decrease in
industrial production in the same way; it is estimated that this case increases indirect taxes. In addition, an increase that
will increase in GDP and total employment will cause to an increase in informal employment. Although the result
obtained here shows the positive relationship between GDP and informal employment, it also approves the effect of
cheap labor force on GDP. One of the most important results obtained from the model is that the increases that will
occur in the employment and production will directly increase informal employment i.e. that the cheap labor force is
attractive.
116Kaya, M., G. / Journal of Yasar University, 2019, 14 (Special Issue), 108-117
REFERENCES
Akalın, G., Ferdi K. (2007), “Türkiye’de Kayıt dış ı Ekonomi ve Büyüme İliş kisi”, ZKÜ Sosyal Bilimler Dergisi, 3(5),
71-87
Altuğ, O. (1999). Kayıt Dışı Ekonomi, Türkmen Kitabevi, İstanbul
Ay, A., İ. H. Sugözü, N. Köse (2005), “Vergi Yükündeki Değiş melerin Kayıt Dış ı Ekonomiye Etkisinin Simetrikliği
Üzerine Bir İnceleme: Türkiye Örneği (1968–2001)”, İktisat İş letme ve Finans Dergisi, 20(233), August, 52–64
Ay, A., İ.H. Sugözü, S. Erdoğan (2014), “Türkiye’de Vergi Yükünün, Enflasyonun ve Vergi Affı Beklentisinin Kayıt
Dış ı Ekonomiye Etkisi Üzerine Ampirik Bir Uygulama (1985-2012)”, Selçuk Üniversitesi Sosyal Bilimler
Enstitü Dergisi, Dr.Mehmet Yıldız Özel Sayısı, 23-32
Baldemir, E., F.Gökalp, M. Avcı (2006), “Türkiye’de Kayıt dışı Ekonominin Mimic Model İle Tahminlenmesi”, SDÜ
İİBF Dergisi, 1-14
Chen, M. A. (2012). “The Informal Economy: Definitions, Theories and
Policies”, Women in Informal Employment Globalizing and Organizing
(WIEGO) Working Paper, No: 1, August.
Elveren A. and G. Özgür (2016), “The Effect of Informal Economy on Income Inequality: Evidence from Turkey”,
Panoeconomicus, 63(3), 293-312
Erkuş, H. and Karagöz, K. (2009). “Türkiye’de Kayıt Dışı Ekonomi ve Vergi
Kaybının Tahmini”. Maliye Dergisi, 156, 126-140.
Gelir İdaresi Başkanlığı, Genel Bütçe Vergi Gelirleri, 2018
Granger, C. W. J. and Newbold, P. (1974). “Spuriousregressions in econometrics”.
Journal of Econometrics, No: 2, 111- 120.
Gujaratı, D. N. (2006). Temel Ekonometri, Trans. Ümit Şenesen and
Gülay Göktürk Şenesen, Literatür Yayıncılık, İstanbul.
Gujarati, D.N. and Porter, D.C. (2009). Basic Econometrics. 5th Edition, McGraw Hill Inc., New York.
Güloğlu, T., Korkmaz, A. and Kip, M. (2003). “Türkiye’de Kayıtdışı İstihdam
Gerçeğine Bir Bakış”. Sosyal Siyaset Konferansları Dergisi, 45 (1), 51-95.
Hazine ve Maliye Bakanlığı (2019), Ekonomi Sunumu, https://www.hmb.gov.tr/sunumlar/ekonomi-sunumu/sayfa/1,
Accessed 11.02.2019
Işık, N. ve Kılınç, E. C. (2009), “OECD Ülkelerinde Vergi Yükü ve Vergi Türleri:
Karşılaştırmalı Bir Analiz”, KMU İİBF Dergisi, 11(17), 147-173.
Kalkınma Bakanlığı, Kalkınma Planları, www.kalkinma.gov.tr, (15.09.2018)
Karaaslan, E. (2010). Kayıt Dışı İstihdam ve Neden Olduğu Mali Kayıpların Bütçe
Üzerindeki Etkileri: Türkiye Örneği. Mali Hizmetler Derneği, Yayın No:7,
Ankara.
OECD, (2016), Revenue Statistics 1965-2015, Statistiques Des Recettes Publiques
1965-2015.
Öz E., Buyrukoğlu S., Bozdoğan D. (2012), "Ulusal/Uluslararası Boyutta Vergi Kaçakçılığı, Vergiden Kaçınma ve
Kayıt dışı Ekonomiye Etkileri", Prof. Dr. Aytaç EKER'e Armağan, DEÜ İİBF Maliye Bölümü, 330-346
Rakıcı C. and C. Aydoğdu (2017), “2000 Yılı Sonrası Türkiye’de Vergi Performansının Değerlendirilmesi”,
Sosyoekonomi, Vol 25(33), 221-239
Sosyal Güvenlik Kurumu (SGK), (2018).
http://www.sgk.gov.tr/wps/portal/sgk/tr/ , Accessed 03.07.2018.
TCMB, Elektronik Veri Dağıtım Sistemi, http://www.tcmb.gov.tr , Accessed 03.07.2018.
TÜİK, (2018), İşgücü İstatistikleri, www.tuik.gov.tr, Accessed 01.09.2018.
Yağmur, A. S. (2013). “Seçilen Ülkeler ve Ülkemizdeki Kayıt Dışı İstihdamın
Karşılaştırılması ve Seçilen AB Üyesi Devletlerde Kayıt Dışı İstihdamla
Mücadele Örnekleri”. Sosyal Güvence Dergisi, N. 3, 1-19.
117You can also read