Simulation assessment of the half-power bandwidth method in testing shock absorbers
←
→
Page content transcription
If your browser does not render page correctly, please read the page content below
Open Eng. 2021; 11:120–129

Research Article

Zbigniew Lozia and Piotr Zdanowicz*

Simulation assessment of the half-power
bandwidth method in testing shock absorbers
https://doi.org/10.1515/eng-2021-0011                           fort. With the development of damping components of sus-
Received Jul 13, 2020; accepted Sep 28, 2020                    pension systems, newer and better methods of diagnosing
                                                                such parts are sought. The “on-vehicle” tests are particu-
Abstract: The work deals with usability of the half-power
                                                                larly useful thanks to their low cost and short time. Pre-
bandwidth method in the diagnostic testing of automotive
                                                                dominantly, “forced vibration tests” are used for this pur-
shock absorbers. In all the simulation tests, the front and
                                                                pose [1, 2]. At present, efforts are made to adopt in Eu-
rear suspension system of a present-day medium-class mo-
                                                                rope a uniform (standard) method of forcing the vibration
tor car was considered. At the first stage, calculations were
                                                                for all the shock absorber testers. As one of the peculiari-
made in the frequency domain for a linear “quarter-car”
                                                                ties of such a method, the stroke of the tester’s vibration
model with two degrees of freedom; then, simulations
                                                                plate is to be constant, equal to e.g. 6 mm, as it is in the
were carried out in the time domain with using a similar
                                                                case of the EUSAMA machines [1–4]. Unfortunately, such
but strongly nonlinear model. In the latter case, actual
                                                                testers, which are most popular, suffer from a major draw-
characteristics (corresponding to those obtained from test
                                                                back: the final test result strongly depends on tire infla-
rig measurements) of shock absorber damping, suspen-
                                                                tion pressure (i.e. tire stiffness), sprung mass, sliding fric-
sion and tire elasticity, sliding friction in the suspension,
                                                                tion in the suspension system, test conditions, and tester
and “wheel hop” were considered. The calculations were
                                                                characteristics [1, 2, 4, 5]. In consideration of the above,
carried out every time for twelve levels of viscous damp-
                                                                the authors, when searching for new “on-vehicle” shock
ing in the suspension system, which made 48 calculation
                                                                absorber assessment methods and having reviewed the
series in total. The factors of gain in the vertical force be-
                                                                literature, paid particular attention to publications [3, 6],
tween the tester’s vibration plate and the vehicle tire (rela-
                                                                where a suggestion was made to introduce some modifi-
tive to the input force applied) and the dimensionless coef-
                                                                cations to the EUSAMA testers and to use the half-power
ficients of viscous damping in the suspension system, de-
                                                                bandwidth method for determining the dimensionless co-
termined by the half-power bandwidth method, were thor-
                                                                efficients of damping in the motor vehicle suspension sys-
oughly analyzed. The calculation results were presented in
                                                                tem. This method is derived from modal analysis [7]. How-
graphical form. Attention was also paid to the distortions
                                                                ever, it is applied to systems with a single degree of free-
caused by the force of inertia of the tester’s vibration plate.
                                                                dom and with low damping (where the dimensionless
Keywords: suspension, damping coefficient, peak-picking damping coefficients are below 0.1 – see also e.g. [8]). The
method                                                          authors decided to assess the usability of this method in di-
                                                                agnostic testing of automotive suspension systems, where
                                                                the relative damping coefficient reaches and even exceeds
                                                                a value of 0.3. A novelty in relation to publications [3, 6] is
1 Introduction
                                                                here the use of a linear and a strongly nonlinear quarter-
                                                                car model.
The technical condition of automotive shock absorbers is
essential for vehicle motion safety and occupants’ com-

                                                                            2 The half-power bandwidth
*Corresponding Author: Piotr Zdanowicz: Warsaw University                     method in the testing of
of Technology, Faculty of Transport, Koszykowa Street 75, 00-662
Warsaw, Poland; Email: piotr.zdanowicz@pw.edu.pl                              automotive shock absorbers
Zbigniew Lozia: Warsaw University of Technology, Faculty of Trans-
port, Koszykowa Street 75, 00-662, Warsaw, Poland; Łukasiewicz Re-          The authors of publication [3] have shown that the said
search Network – Automotive Industry Institute PIMOT, Jagiellońska
                                                                            half-power bandwidth method [7] may be used to deter-
Street 55, 03-301 Warsaw, Poland; Email: zbigniew.lozia@pw.edu.pl

  Open Access. © 2021 Z. Lozia and P. Zdanowicz, published by De Gruyter.                  This work is licensed under the Creative Commons
Attribution 4.0 License
Simulation assessment of the half-power bandwidth method in testing shock absorbers | 121
mine the dimensionless coefficient of damping in the sus- the effect of amplification of the vertical force (measured
pension system. They used a modified EUSAMA tester under the tester’s vibration plate) in the resonance area,
(with a system to measure the vertical force under the vi- for the first natural frequency. In this connection, the input
bration plate, at a sinusoidal input with a constant ampli- frequency should decline in the core phase of the test from
tude of 3 mm), but with the test duration time being sig- 3 Hz to 0 for a period of 30 s (with a rate of 0.1 Hz/s). For the
nificantly extended (to 140 s). Thus, small changes in the suspension deflection rates during the test to be similar to
input frequency were obtained (from 25 Hz to 0, with a rate those occurring in typical road conditions, the amplitude
of 0.18 Hz/s) and, in consequence, quasi-state conditions of the sinusoidal input was increased to 12.5 mm. Addition-
of motion were ensured for the core phase of the test. Ad- ally, an assumption was made that the curves used as char-
ditionally, the vertical displacement of the tester’s vibra- acteristics of the factor of gain in the force measured in the
tion plate was measured. Thus, with using the fast Fourier tester were symmetrical and, therefore, a simplified equa-
transform, factors of gain in the vertical force measured tion (2) might be applied here:
under the EUSAMA tester’s vibration plate (relative to the
f C2 − f C1
input force), i.e. the absolute values of their transmittance ϑ C2 = ≈ ϑ C1 (2)
2 · f Cm
(for linear systems), may be determined. By analyzing the
curves representing these quantities close to the second
natural frequency of the undamped system and with us-
ing the half-power bandwidth method (Figure 1), the esti- 3 Simulation models used
mated value of the coefficient of viscous damping in the
motor vehicle suspension system may be determined from The usability of the half-power bandwidth method in the
formula (1) [3, 7]: diagnostic testing of automotive shock absorbers was as-
sessed in two stages. At first, simulations were carried out
2 2
f C2 − f C1 in the frequency domain with using a linear quarter-car
ϑ C1 = (1)
4 · f 2Cm model placed on a suspension tester (Figure 2a). Next, time
where: fCm is the frequency corresponding to the maxi- domain simulations were performed using an analogous,
mum value of the factor of gain in the force measured in highly non-linear model (Figure 2b and 2c).
the tester (HFDZmax ) and fC1 and fC2 are the frequencies
√
corresponding to the value HFDZ max / 2 (see Figure 1).
3.1 Linear model
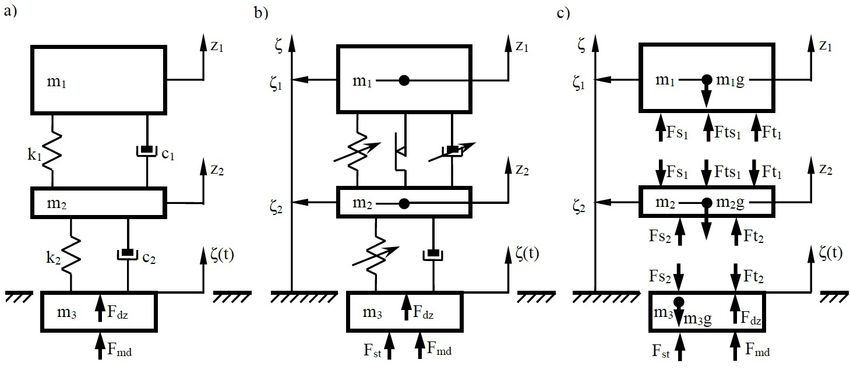
In this representation (Figure 2a), sprung mass m1 , un-
sprung mass m2 , and mass m3 of tester’s vibration plate
were taken into account. The vertical displacements of
model bodies relative to their equilibrium positions (for
the exciter, i.e. the vibration plate, being in its rest posi-
tion) are denoted here by z1 and z2 ; ζ is the time-varying
kinematic input applied by the exciter. The stiffness and
damping of the suspension system are denoted by k1 and
c1 , respectively, and the radial stiffness and damping of
the tire are denoted by k2 and c2 , respectively. To check the
distorting impact of the inertia of tester’s vibration plate
(exciter) on the final shock absorber test results, the dy-
namic component of the normal reaction at the tire-exciter
contact point (Fdz ) and the dynamic component of the
Figure 1: Illustration showing the characteristic points of the factor
of gain in the force measured in the tester (HFDZ) in the half-power
force measured in the tester (Fmd ) were distinguished.
bandwidth method The equations of motion were derived in accordance
with the principle of dynamic force analysis (see [9]), with
taking into account the forces of inertia of individual mass
The considerations presented in publication [3] were elements. The equations in their full and concise matrix
continued in [6] (by the same authors). It was ascertained
that shock absorbers might be tested with making use of122 | Z. Lozia and P. Zdanowicz
form have been shown below (3): transmittance for the dynamic vertical force at the tire-
[︃ ]︃ [︃ ]︃ [︃ ]︃ [︃ ]︃ exciter contact point was finally obtained (with remember-
m1 0 z̈1 c1 −c1 ż
· + · 1 + (3) ing that q1 = z1 and q2 = z2 ):
0 m2 z̈2 −c1 c1 + c2 ż2
[︃ ]︃ [︃ ]︃ [︃ ]︃ [︃ ]︃ F dz (i · ω)
k1 −k1 z 0 0 H Fdz (i · ω) = = (10)
+ · 1 = · ζ̇ + ·ζ ζ (i · ω)
−k1 k1 + k2 z2 c2 k2
= (i · c2 · ω + k2 ) · [1 − H q2 (i · ω)]
M · q̈ + C · q̇ + K · q = C ζ · ζ̇ + K ζ · ζ
The difference between the dynamic component of the
where: M, C, K, C ζ , and K ζ are, respectively, the matrices of force measured in the tester (Fmd ) and the dynamic vertical
inertia, viscous damping, stiffness, and matrices represent- force at the tire-exciter contact point (Fdz ) arises from the
ing the excitation impact exerted through the tire damping force of inertia of tester’s vibration plate (exciter):
and the radial stiffness of the tire; q, q̇, and q̈ are the vec-
F md (i · ω)
tors of generalized displacements, velocities, and acceler- H Fmd (i · ω) = (11)
ζ (i · ω)
ations, respectively.
The Laplace transform of (3) at zero initial conditions F dz (i · ω) + m3 · ζ̈ (i · ω)
H Fmd (i · ω) =
and some subsequent transformations have resulted in the ζ (i · ω)
obtaining of equation (4) and its solution (5): F dz (i · ω) − m3 · ω2 · ζ (i · ω)
H Fmd (i · ω) =
(︁ )︁ ζ (i · ω)
M · s2 + C · s + K · q (s) = C ζ · s + K ζ · ζ (s) (4)
(︀ )︀
H Fmd (i · ω) = (i · c2 · ω + k2 ) · [1 − H q2 (i · ω)] − m3 · ω2
H Fmd (i · ω) = H Fdz (i · ω) − m3 · ω2
(︁ )︁−1 (︀
q (s) = M · s2 + C · s + K
)︀
· C ζ · s + K ζ · ζ (s) (5)
The quantities describing the properties of the linear
The operational transmittances (transfer functions) model, i.e. the Hertz and radian natural frequency (f01/02
for displacements, velocities, and accelerations were ex- and ω01/02 , respectively) of the undamped system (12), crit-
pressed by relations (6), (7), (8) as the ratios of the Laplace ical damping coefficient ckr1 (13), and relative damping co-
transform of the output signal to the Laplace transform of efficient ϑ1 (14) were also used:
the input signal (excitation): k1 · m2 + (k1 + k2 ) · m1
ω201/02 = ∓ (12)
[︃ ]︃ 2 · m1 · m2
H q1 ( s ) q (s) √︃
H q (s) = = = (6) [︂ ]︂2
H q2 ( s ) ζ (s) k1 · m2 + (k1 + k2 ) · m1 k ·k
∓ − 1 2 =
(︁ )︁−1 (︀ 2 · m1 · m2 m1 · m2
= M · s2 + C · s + K
)︀
· Cζ · s + Kζ (︀ )︀2
= 2π · f01/02
[︃ ]︃
H q̇1 (s) q̇ (s) √︃
H q̇ (s) = = = s · H q (s) (7) k1 · k2 · m1
H q̇2 (s) ζ (s) c kr1 = 2 · (13)
k2 + k1 · 1 + m
(︀ )︀
2
m1
√︂
[︃ ]︃ k1 · k2 · m1
H q̈1 (s) q̈ (s) c kr1 ≈ 2 · for m1 ≫ m2
H q̈ (s) = = = s2 · H q (s) (8) k2 + k1
H q̈2 (s) ζ (s)
To pass from the Laplace transform to the Fourier c1
ϑ1 = (14)
transform, it will be enough to pass from domain s to pa- c kr1
rameter i · ω (with assuming that the real part is equal to
zero). For the linear model used here, the Fourier trans-
3.2 Nonlinear model
form of the dynamic component of the vertical force at the
tire-exciter contact point was described by (9):
[︁ ]︁ At the second stage, numerical computations were carried
F dz (i · ω) = c2 · ζ̇ (i · ω) − ż2 (i · ω) + (9) out in the time domain with using a strongly nonlinear
quarter-car model (Figure 2b and 2c). Force Fst balances
+ k2 · [ζ (i · ω) − z2 (i · ω)]
the weight of system masses (m1 ·g, m2 ·g, m3 ·g). The dy-
Based on equations (6)–(9) and in result of appropri- namic components Fmd and Fdz were taken separately to
ate transformations, a compact end form of the spectral compare the results obtained for the two models.Simulation assessment of the half-power bandwidth method in testing shock absorbers | 123
Figure 2: Quarter-car model on a diagnostic shock absorber tester: a) general structure of linear version; b) general structure of nonlinear
version; c) force system in nonlinear version
The actual elasticity characteristics of vehicle suspen- where: om0 is the difference between coordinates ζ1 and
sion and tires, sliding friction in the suspension system, ζ2 at which Fs1 = 0.
and tire separation from the ground were taken into ac- The force of sliding friction in the suspension system
count. The description of these properties was exactly con- is represented as follows:
sistent with the results of test rig measurements of the ⎧
⎨Ats · sgn u̇
real system. The equations of motion (15) of the nonlinear 1 1 for | u̇ 1 | > u̇ 1gr
Fts1 = (18)
quarter-car model were derived according to the principle ⎩Ats1 · u̇1 for |u̇1 | ≤ u̇1gr
u̇1gr
of dynamic force analysis.
{︃ where: Ats1 is amplitude of the force of sliding friction in
ζ̈ 1 = Fs1 +Fts
m1
1 +Ft 1
−g the suspension system and u̇1gr is boundary value of the
(15)
−Fs1 −Fts1 −Ft1 +Fs2 +Ft2
ζ̈ 2 = m2 −g suspension system deflection rate, see (19):
where: ζ̈ 1 and ζ̈ 2 are accelerations of the sprung and un- u̇1 = ζ̇ 2 − ζ̇ 1 (19)
sprung mass; Fs1 , Fts1 , and Ft1 are forces of elasticity,
sliding friction, and viscous damping in the suspension The force of viscous damping in the suspension sys-
system; Fs2 and Ft2 are forces of elasticity and damping tem is described by (20):
in the tire; and g is acceleration of gravity. {︃
−i z · c o · (−u̇1 · i z )Wo for u̇1 < 0
The elasticity force in the suspension system was ap- Ft1 = (20)
proximated by a linear function and a 2nd or 3rd degree i z · c u · (u̇1 · i z )Wu for u̇1 ≥ 0
polynomial:
⎧ where: i z is a coefficient describing the kinematic rela-
tions in the suspension system; c0 and c u are shock ab-
⎨A1s1 · u1 for u1 ≤ u1gr
⎪
⎪
3
Fs1 = A2s1 · u1 + B2s1 · u1 + 2 (16) sorber damping coefficients for the rebound and compres-
⎪
⎪
⎩+C2s · u + D2s sion stroke; Wo and Wu are exponents of the function that
1 1 1 for u > u1 1gr
describes the shock absorber damping for the rebound and
where: A1s1 and A2s1 to D2s1 are coefficients of the func- compression stroke.
tions that describe the elasticity force in the suspension The tire elasticity force was approximated by a 3rd de-
system at low and high deflection values, respectively; u1gr gree polynomial:
is boundary between areas of different descriptions of the
Fs2 = As2 · u32 + Bs2 · u22 + Cs2 · u2 (21)
elasticity force; u1 is deflection of the suspension system,
according to (17): where: As2 to Cs2 are coefficients of the polynomial that
u1 = ζ2 − ζ1 + om0 (17) describes the tire elasticity force and u2 is radial deflection124 | Z. Lozia and P. Zdanowicz
of the tire, according to (22): Table 2: Additional parameters of the nonlinear model and the
diagnostic tester
{︃
ζ − ζ2 + R for ζ − ζ2 + R ≥ 0
u2 = (22) Symbol Unit Value for the Value for the
0 for ζ − ζ2 + R < 0
front “quarter rear “quarter
where: R is free radius of the pneumatic tire. car” car”
According to equation (23), the damping force in the A1s1 N/m 2.267E+05 4.400E+05
tire model is a linear function of the rate of tire deflection A2s1 N/m3 0 7.290E+05
in the radial direction: B2s1 N/m2 1.852E+04 −5.037E+04
C2s1 N/m 2.310E+04 2.155E+04
Ft2 = c2 · u̇2 (23) D2s1 N 1.526E+03 4.094E+02
u1gr m 0.0075 0.001
where: c2 is damping coefficient and u̇2 is deflection rate,
om0 m 0.337 0.309
according to (24):
Ats1 N 200 40
u̇1gr m/s 0.005 0.005
{︃
ζ̇ − ζ̇ 2 for ζ − ζ2 + R ≥ 0
u̇2 = (24) cu N·sWu /mWu 975 850
0 for ζ − ζ2 + R < 0
co N·sWo /mWo 1700 3200
The solutions of the equations of motion (15) were ob- Wu - 0.8 0.65
tained in the time domain by approximate techniques in- Wo - 1 1.2
volving numerical integration, with using an authorial pro- iz - 0.9936 0.7068
gram built in the Matlab-Simulink environment [2]. As2 N/m3 −9.367E+07 −3.021E+07
Bs2 N/m2 5.653E+06 3.592E+06
Cs2 N/m 1.525E+05 1.553E+05
R m 0.311 0.311
4 Parameters of the models and of m3 kg 14.5 14.5
the test conditions ζ max m 0.025 or 0.006 0.025 or 0.006
All the simulation tests were carried out for nominal pa-
rameters of the front and rear “quarter” of the selected with using the dimensionless (relative) coefficient (14) and
medium-class car (Tables 1 and 2), which had been previ- with applying every time 12 values of this parameter, rang-
ously subjected to test rig measurements. ing from 0.04 to 0.48 (with ∆ϑ1 = 0, 04).
For the nonlinear model, the force of viscous damping
in the suspension system was reproduced from the nomi-
Table 1: Parameters of the linear model
nal characteristic curve, with multiplying it by a percent-
age factor appropriately selected so that the energy dissi-
Symbol Unit Value for the Value for the
pated in a single cycle in the shock absorber being sim-
front “quarter rear “quarter
ulated was equal to that dissipated in the corresponding
car” car”
linear element of the model.
m1 kg 346 160
The analysis was focused on the factors of gain in the
m2 kg 36 35
vertical force at the tire-exciter contact point (relative to
k1 N/m 25570 24882
the input force) and on the relative coefficients of viscous
k2 N/m 253161 206526
damping in the suspension system, determined by the half-
c2 N·s/m 150 150
power bandwidth method. The distortions caused by the
f01 Hz 1.30 (8.19) 1.87 (11.77)
force of exciter’s inertia were also shown if deemed signif-
(ω01 ) (rad/s)
icant.
f02 Hz 14.01 (88.03) 12.96 (81.42)
(ω02 ) (rad/s)
ckr1 N·s/m 5669 3770
In pursuance of the objective of this work, only the
viscous damping in the suspension system was changed,Simulation assessment of the half-power bandwidth method in testing shock absorbers | 125
Figure 3: Factors of gain (AHFDZ) in the vertical force at the tire-exciter contact point (relative to the input force) close to the first natural
√
frequency of the front “quarter car” for various damping values ϑ1 (Theta1): The horizontal lines represent the values of AHFDZ max / 2;
a) results for the linear model; b) results for the nonlinear model
Figure 4: Factors of gain (AHFDZ) in the vertical force at the tire-exciter contact point (relative to the input force) close to the second natural
√
frequency of the front “quarter car” for various damping values ϑ1 (Theta1): the horizontal lines represent the values of AHFDZ max / 2;
a) results for the linear model; b) results for the nonlinear model
could be determined but only for the 6 lowest damping lev-
5 Results of simulation els (of the range 0.04÷0.24). Close to the second natural
computations frequency, in turn, the use of the half-power bandwidth
method was reasonable in 7 of 12 cases. In contrast, the val-
The spectral characteristic curves obtained from the simu- ues of ϑ C1 and ϑ C2 could be estimated for all the damping
lation tests carried out with using the linear model of the levels under consideration (Figure 5a), if the factors of gain
front “quarter car” were almost symmetrical, especially in the force under the tester’s vibration plate (measured
when the value of the dimensionless coefficient of damp- by means of real diagnostic testers) were used. For the cal-
ing in the suspension system did not exceed 0.24 (Fig- culations carried out with using the nonlinear model of
ures 3a, 4a, and 5a). Close to the first natural frequency, the the front “quarter car”, the results obtained were less op-
diagnostic parameters ϑ C1 and ϑ C2 (equations (1) and (2)) timistic. The spectral characteristic curves showed some126 | Z. Lozia and P. Zdanowicz
Figure 5: Factors of gain (AHFDZM) in the force measured by the real diagnostic tester, i.e. under the exciter (relative to the input force),
close to the second natural frequency of the front “quarter car” for various damping values ϑ1 (Theta1): the horizontal lines represent the
√
values of AHFDZ max / 2; a) results for the linear model; b) results for the nonlinear model
Figure 6: Values of diagnostic parameters ϑ C1 (Theta_C1) and ϑ C2 (Theta_C2) as functions of the dimensionless coeflcient of damping
in the suspension system ϑ1 (Theta1), obtained from an analysis of the factor of gain in the vertical force at the tire-exciter contact point
(relative to the input force) close to the first natural frequency of the front “quarter car”: a) results for the linear model; b) results for the
nonlinear model
symmetry, but only close to the second natural frequency. For the nonlinear model of the front “quarter car”, in
For the curves presented in Figures 3b, 4b, and 5b, the pa- turn, high sliding friction forces in the suspension system
rameters ϑ C1m and ϑ C2m could only be estimated for the prevented the obtaining of final test results except for the
first 2, first 5, and all the damping levels in question, re- tests with the two lowest damping levels, where the results
spectively. were several times overestimated at that (Figure 6b). Some-
The final simulation results, determined from the spec- what better results were obtained for the rear suspension
tral characteristic curves close to the first natural fre- system (Figure 8b). However, the ϑ C1 and ϑ C2 values could
quency of the linear model corresponded to the applied only be determined for the five lowest damping levels and
values of the dimensionless coefficient of damping of the the values corresponding to the levels of 0.04 and 0.2 were
range 0.04÷0.24 (Figures 6a and 9a). For higher values of overestimated even by as much as several ten percent.
this coefficient, a trend to overestimate the values of ϑ C1 In the case of using the factors of gain in the verti-
and ϑ C2 (even by about 25%) was noticed or the values cal force at the tire-exciter contact point (relative to the
could not be determined at all. input force) close to the second natural frequency of theSimulation assessment of the half-power bandwidth method in testing shock absorbers | 127 Figure 7: Values of diagnostic parameters ϑ C1 (Theta_C1) and ϑ C2 (Theta_C2) as functions of the dimensionless coeflcient of damping in the suspension system ϑ1 (Theta1), obtained from an analysis of the factor of gain in the vertical force at the tire-exciter contact point (relative to the input force) close to the second natural frequency of the front “quarter car”: a) results for the linear model; b) results for the nonlinear model Figure 8: Values of diagnostic parameters ϑ C1m (Theta_C1m) and ϑ C2m (Theta_C2m) as functions of the dimensionless coeflcient of damp- ing in the suspension system ϑ1 (Theta1), obtained from an analysis of the factor of gain in the force measured by the real diagnostic tester, i.e. under the exciter (relative to the input force), close to the second natural frequency of the front “quarter car”: a) results for the linear model; b) results for the nonlinear model Figure 9: Values of diagnostic parameters ϑ C1 (Theta_C1) and ϑ C2 (Theta_C2) as functions of the dimensionless coeflcient of damping in the suspension system ϑ1 (Theta1), obtained from an analysis of the factor of gain in the vertical force at the tire-exciter contact point (relative to the input force) close to the first natural frequency of the rear “quarter car”: a) results for the linear model; b) results for the nonlinear model
128 | Z. Lozia and P. Zdanowicz

Figure 10: Values of diagnostic parameters ϑ C1 (Theta_C1) and ϑ C2 (Theta_C2) as functions of the dimensionless coeflcient of damping
in the suspension system ϑ1 (Theta1), obtained from an analysis of the factor of gain in the vertical force at the tire-exciter contact point
(relative to the input force) close to the second natural frequency of the rear “quarter car”: a) results for the linear model; b) results for the
nonlinear model

Figure 11: Values of diagnostic parameters ϑ C1m (Theta_C1m) and ϑ C2m (Theta_C2m) as functions of the dimensionless coeflcient of damp-
ing in the suspension system ϑ1 (Theta1), obtained from an analysis of the factor of gain in the force measured by the real diagnostic tester,
i.e. under the exciter (relative to the input force), close to the second natural frequency of the rear “quarter car”: a) results for the linear
model; b) results for the nonlinear model

front “quarter car”, quite good conformity was obtained                   described the shock absorber condition, but only within
between the final test results and the predefined values,                 the medium damping range. For very low and very high
but only when the latter were relatively low (Figures 7a                  damping levels (0.04÷0.12 and above 0.36), the overes-
and 10a). For the front suspension system, significant over-              timation of the final test results reached a few ten per-
estimation of parameters ϑ C1 and ϑ C2 (even by as much as                cent. The phenomenon of tire separation from the exciter
several ten percent) was observed when the damping level                  (“bouncing”) resulted in conspicuous distortions of the ini-
exceeded 0.16. For the rear suspension system, the value of               tial parts of the curves plotted (Figures 10b and 11b).
this threshold was 0.28.                                                       Wherever the calculations made for the front “quarter
     For the nonlinear front “quarter car” model, the cal-                car” were based on the factors of gain in the force mea-
culations produced test results overestimated by several                  sured under the tester’s vibration plate, their results better
ten to about two hundred percent in the whole range of                    represented the suspension damping applied, in compari-
changes in the damping (Figure 7b). The results obtained                  son with the case that the vertical force at the tire-exciter
in this case were markedly better for the rear suspension                 contact point was taken as a basis (see Figures 7 and 8).
system (Figure 10b). Parameters ϑ C1 and ϑ C2 adequately                  For the linear model, the diagnostic parameters were gen-
Simulation assessment of the half-power bandwidth method in testing shock absorbers | 129
erally underestimated (by up to about 25%); conversely,
those obtained for the nonlinear representation remained
References
overestimated, but definitely less than it can be seen in [1] Stańczyk TL, Jurecki R. [Comparative analysis of testing methods
Figure 7b. A different situation was observed for the rear of hydraulic shock absorbers]. Proceedings of the Institute of
suspension system: here, the ϑ C1m and ϑ C2m values repre- Vehicles, Warsaw University of Technology. 2014;4(100):25-45.
sented the suspension damping levels worse than ϑ C1 and Polish.
ϑ C2 did and they were underestimated in most cases (see [2] Zdanowicz P. Assessment of vehicle shock-absorbers’ condition
having considered dry friction in the suspension [dissertation].
Figures 10 and 11).
Warsaw: Warsaw University of Technology; 2012.
[3] Calvo JA, Diaz V, San Román JL. Establishing inspection criteria to
verify the dynamic behaviour of the vehicle suspension system by
a platform vibrating test bench. International Journal of Vehicle
6 Recapitulation Design. 2005;38(4):290-306.
[4] Lozia Z, Zdanowicz P. Simulation assessment of the impact of
Based on the simulation tests carried out, the usability of inertia of the vibration plate of a diagnostic suspension tester on
the half-power bandwidth method in the diagnostic test- results of the EUSAMA test of shock absorbers mounted in a ve-
hicle. IOP Conference Series: Materials Science and Engineering.
ing of automotive shock absorbers was found to be limited.
2018;421(2):1-10.
The final calculation results were approximately in
[5] Lozia Z, Mikołajczuk J. Ocena przydatności testu diagnosty-
conformity with expectations but in general, this was only cznego stanu amortyzatorów zamontowanych w pojeździe, wyko-
true for low suspension system damping values. However, rzystującego wymuszenie kinematyczne w kontakcie koła z
such cases, occurring when the shock absorbers are in podłożem. The Archives of Automotive Engineering. 1997;2:3-24.
poor condition, are most important in the practical appli- Polish.
[6] Calvo JA, San Román JL, Alvarez-Caldas C. Procedure to verify
cations of this method. At high damping levels, overesti-
the suspension system on periodical motor vehicle inspection.
mation of the diagnostic parameters was usually observed, International Journal of Vehicle Design. 2013;63(1):1-17.
although different situations occurred as well. [7] He J, Fu ZF. Modal analysis. 1st ed. Woburn: Butterworth-
A distorting impact of sliding friction in the suspen- Heinemann; 2001.
sion system on the final test results was noticed. The cases [8] Pugi L, Reatti A, Corti F. Application of modal analysis methods
to the design of wireless power transfer systems. Meccanica.
have also been shown where the new diagnostic parame-
2019;54:321–31.
ters proposed cannot be determined at all.
[9] Lozia Z. The use of a linear quarter-car model to optimize the
The results presented indicate the usability of the lin- damping in a passive automotive suspension system – a follow-
ear model, although many important characteristics of a on from many authors’ works of the recent 40 years. The Archives
real object are not taken into account in such a model. of Automotive Engineering. 2016;71(1):33-65.
In authors’ opinion, experimental verification of the
results obtained is necessary because in practice, at low-
frequency input (even if the input amplitude is raised to
12.5 mm), the extremum of the response of the system
under test becomes hardly distinguishable. Moreover, the
shock absorber under test usually fails to function in such
conditions if the sliding friction in the suspension system
is strong enough.
Acknowledgement: The work was done within project
“UNILINE QUANTUM (. . . )” sponsored by the European
Union within the European Regional Development Fund,
Smart Growth Operational Programme, Sub-measure 1.1.1.
Project No: POIR.01.01.01-00-0949/15. Task carried out by
the authors for UNIMETAL Sp. z o.o. in Złotów.You can also read