EVALUATION OF CRITICAL EXPERIMENTS IN THE UNIVERSITY OF WISCONSIN NUCLEAR REACTOR (UWNR) WITH UNCERTAINTY QUANTIFICATION - EPJ Web of ...
←
→
Page content transcription
If your browser does not render page correctly, please read the page content below
EPJ Web of Conferences 247, 10032 (2021)                                                               https://doi.org/10.1051/epjconf/202124710032
PHYSOR2020

                     EVALUATION OF CRITICAL EXPERIMENTS IN
              THE UNIVERSITY OF WISCONSIN NUCLEAR REACTOR (UWNR)
                       WITH UNCERTAINTY QUANTIFICATION

                                    Young-Hui Park1 , Ye Cheng2 , Rabab Elzohery2 ,
                             Paul P.H. Wilson1 , Jeremy A. Roberts2 , and Mark D. DeHart3
                                  1
                                    Computational Nuclear Engineering Research Group,
                           Department of Engineering Physics, University of Wisconsin-Madison
                                     1415 Engineering Drive, Madison, WI 53705, US
                           2
                          Computation and Optimization for Reactor Physics Simulation Group,
                       Department of Mechanical and Nuclear Engineering, Kansas State University
                                     3002 Rathbone Hall, Manhattan, KS 66506, US
                                        3
                                            Reactor Physics Analysis and Design Department,
                                                      Idaho National Laboratory
                                                      Idaho Falls, ID 83415, US

                                ypark234@wisc.edu, yc4v7@ksu.edu, rababelzohery@ksu.edu,
                               paul.wilson@wisc.edu, jaroberts@ksu.edu, mark.dehart@inl.gov

                                                                  ABSTRACT

               An improved computational model of the University of Wisconsin Nuclear Reactor
               (UWNR) was developed to support the benchmark evaluation of recent data acquired
               during an experimental campaign conducted at UWNR. Previous efforts led to a scripted
               UWNR model for automated generation of MCNP6 and Serpent inputs. This capabil-
               ity was extended to SCALE/KENO. All three tools were used to evaluate a variety of
               zero-power, fresh-critical configurations, and the results agreed well. The MCNP6 model
               was extended to support shuffling the core configuration, which allows the modeling of
               burnup for evaluation of depleted critical configurations. The MCNP6 model successfully
               predicts core reactivity over time, after accounting for the initial reactivity bias. The inclu-
               sion of SCALE/KENO input generation enables sensitivity and uncertainty analyses using
               the TSUNAMI and Sampler modules of SCALE. A preliminary uncertainty analysis was
               performed with TSUNAMI for nuclear data uncertainties while direct perturbation cal-
               culations were performed using MCNP6 for geometry and material uncertainties, which
               helped to identify model parameters with the largest effect on the eigenvalue. A transient
               UWNR transport Model in Mammoth/Rattlesnake is under development to simulate the
               transient experiments. The existing MCNP6 and Serpent models are used to provide the
               CAD file for meshing and homogenized cross-sections. In conclusion, the evaluation of
               UWNR benchmark data provides increased confidence in various states of the UWNR
               computational model and will provide a unique model for use by other analysts.
         KEYWORDS: Benchmark, critical configuration, reaction rate measurement, uncertainty quantification,
         transient experiment

  © The Authors, published by EDP Sciences. This is an open access article distributed under the terms of the Creative Commons Attribution License 4.0
  (http://creativecommons.org/licenses/by/4.0/).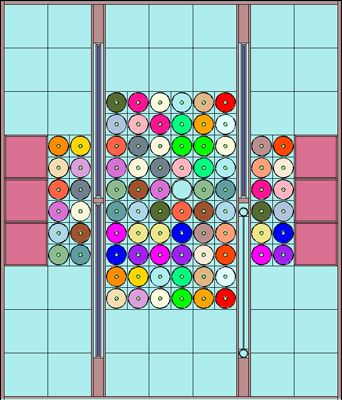
EPJ Web of Conferences 247, 10032 (2021)                                         https://doi.org/10.1051/epjconf/202124710032
PHYSOR2020

                                               1. INTRODUCTION

         The University of Wisconsin Nuclear Reactor (UWNR) located in Madison, Wisconsin is a 1
         megawatt (MW) TRIGA       R
                                      (Training, Research, Isotopes, General Atomics) reactor converted from
         MTR (Materials Testing Reactor). Efforts have been made to improve the computational model
         of the reactor as a part of a NEUP (Nuclear Energy University Program) NEAMS (Nuclear En-
         ergy Advanced Modeling and Simulation) project on evaluation of experimental data measured in
         UWNR[1,2]. These improvements include (1) improved data provenance, (2) build consistency
         from automatic input generation using Python scripts, (3) human readability and transparency of
         model changes, (4) configuration management by version control, and (5) modularity for alternate
         representations. Previous efforts have added the capability of generating inputs for Serpent[3] as
         an alternate representation of the existing MCNP6[4] model, providing cross-code validation and
         in-depth burnup analysis[5]. The present work adds another layer on the modularity of the UWNR
         computational model, leading to an increased confidence on validation of the model as well as pro-
         viding additional tools for more in-depth analysis. With the addition of SCALE/KENO[6] to the
         model, detailed sensitivity and uncertainty analyses have been facilitated by utilizing TSUNAMI
         and Sampler, submodules of SCALE. Meanwhile, the MCNP6 model was extended with a capa-
         bility to track core depletion across different core configurations. With this feature, core depletion
         can be simulated from the initial J21-R14 core through core shuffles to the current K21-R6 core
         (see Figure 1 for configuration details), allowing comparison with reactor operation logs as another
         way of validating the model. Overall model bias can be established by simulating the approach-
         to-critical experiment which is a set of criticality measurements at the time of initial core loading.
         With this bias adjusted over the lifetime of the reactor, core depletion simulation results can be
         better compared with reactor operation log.

                                           2. MODEL DESCRIPTIONS

         The computational model of the UWNR is built using raw data including dimensions of major
         reactor components and as-built fuel compositions. The model is scripted in Python to automate
         generation of input files for MCNP6, Serpent, and KENO and to ensure the consistency of input
         files generated.

         2.1. Model Geometry

         The reactor core is located near the bottom of a 8.38 m deep pool surrounded by a concrete shield.
         Several beam ports and a thermal column extend from the outer surface of the concrete shield to
         the edge of the core. The core is composed of fuel bundles and graphite reflectors placed on a 9-
         by-7 grid plate. Blade-shaped control elements divide the core into 3 regions. Each of the 21 fuel
         bundles is composed of 4 fuel elements in a 2×2 grid, except one near the core center that contains
         the transient rod in place of one fuel element. Each fuel element consists of cylindrical fuel meat
         with a central zirconium rod. The fuel meat is axially divided into three “slugs” of roughly equal
         height. To the top and bottom of the fuel are cylindrical, graphite reflectors. The fuel meat and
         graphite are enclosed in stainless steel cladding and capped with stainless steel end fittings.

         The core was originally placed in the J21-R14 configuration, which consists of 21 fuel bundles
         and 14 graphite reflectors, as shown in Figure 1(a). Start-up tests indicated a lower reactivity than

                                                           2
EPJ Web of Conferences 247, 10032 (2021) https://doi.org/10.1051/epjconf/202124710032
PHYSOR2020
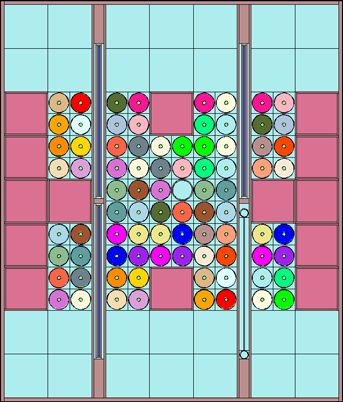
(a) J21-R14 core configuration (b) K21-R06 core configuration
Figure 1: MCNP6-plotted geometry of UWNR core. Fuel pins are represented in various
colors as they have different material numbers for burnup simulation.
predicted. Further analysis led to the development of the K21-R06 configuration shown in Figure
1(b). All fresh critical data were generated with the J-core configuration. Depleted critical data
and the recent experiments are based on the correct K-core configuration.
2.2. Material Composition
The UWNR was completely refueled in 2009 with low enriched uranium (LEU) 30/20 fuel (30 wt%
U enriched to 20 % in U-235). The fuel meat is a homogeneous mixture of UZrH1.6 with Er poison
(0.9 w/o). Compositions for each fuel slug were provided by the manufacturer and, therefore,
support the detailed modeling of fresh critical configurations and the evolution of materials for
depleted critical configuration. More detail on these compositions can be found elsewhere[2].
The reactor is controlled by elements of three types, each with a different composition and purpose.
The cylindrical transient rod is made of boron carbide with a stainless steel cladding inside an
aluminum guide tube. The three safety blades are made of boral (35 wt% boron carbide, 65 wt%
aluminum) with an aluminum cladding. Finally, the regulating blade is a stainless steel sheet
welded to stainless steel tubes on vertical edges.
3. MODEL VALIDATION
Preliminary verification and validation (V&V) of the model was performed via comparison of
MCNP6 and Serpent results for a set of fresh critical configurations [2]. Here, work to support
further V&V is presented and includes the addition of KENO results for the fresh configurations
and the initial development of a depletion sequence and its comparison to operational data.
3EPJ Web of Conferences 247, 10032 (2021) https://doi.org/10.1051/epjconf/202124710032
PHYSOR2020
3.1. Approach to Critical Experiment on Fresh Critical Configuration
As part of refueling, a sequence of critical experiments collectively known as the approach-to-
critical (ATC) experiments was performed. Fuel bundles were added to an empty core, one at a
time. Upon initial criticality, critical control element bank heights were determined and recorded
for each additional fuel bundle. Following each fuel-bundle addition, single reflector worth mea-
surements were made at multiple positions, and additional reflector elements were inserted. In
total, the experiments included 21 unique, fresh critical configurations, where, e.g., configuration
J21-R01-a2 has 21 fuel bundles and one reflector in the peripheral, A2 position.
Figure 2: Comparison of MCNP6, Serpent, and KENO results for ATC experiments.
Simulations were performed using MCNP6, Serpent, and KENO for each ATC configuration using
slug-averaged fuel compositions. Departures from criticality represent reactivity biases and are
shown for each code and configuration in Figure 2. For the simulations, 106 /105 /106 histories per
cycle, 20/200/20 inactive cycles, and 80/500/230 active cycles were used with MCNP6, Serpent,
and KENO, respectively.
The KENO results shown in Figure 2 provide increased confidence in the UWNR computational
model. Specifically, the KENO results lie between MCNP6 and Serpent results, and exhibit the
same systematic bias over all configurations. The mean reactivity biases observed are 1071 ± 46
pcm, 982 ± 34 pcm, and 1044 ± 35 pcm for MCNP6, Serpent, and KENO.
3.2. Depletion Comparison with Reactor Operation Log
Detailed records of core burnup, critical bank heights, and excess core reactivity have been made
since the 2009 fuel conversion and provide one source of data for validation of the model for de-
pleted fuel configuration. From these records, the simplified burnup history shown in Figure 3
was derived to reduce the total number of unique configurations modeled by manual selection of
4EPJ Web of Conferences 247, 10032 (2021) https://doi.org/10.1051/epjconf/202124710032
PHYSOR2020
burnups that coincide with large changes in the average core power. Although the UWNR occa-
sionally operates at full power for several hours, the present model depletes the core continuously
at an average power defined as the difference between successive burnups (selected for the simpli-
fied history) divided by the time elapsed between those burnups.
Figure 3: Simplified burnup input model with comparison to operation logs
Preliminary depletion calculations were performed using MCNP6. The core was modeled initially
with control elements fully withdrawn in the J-core configuration using slug-averaged, fresh-fuel
compositions. A single MCNP6 burnup calculation was performed following the the burnup pro-
file (red) shown in Figure 3. The resulting depleted fuel compositions were parsed and used to
define a second, K-core model with all control elements fully withdrawn, which was then depleted
following the burnup profile (blue) shown in Figure 3.
For all calculations, ENDF-B/VIII.0 data at 300 K were used, which represents an approximation
to the true thermal conditions. Future analysis will assess the discrepancy introduced by this ap-
proximation. For all cases, 105 histories per cycle, 20 inactive cycles, and 40 active cycles were
used.
Figure 4 shows the predicted and measured cold excess reactivity as a function of core burnup.
Solid lines represent original MCNP6 results with 1-σ error bars. The bias determined in Section
3.1 can be used to correct for the discrepancy between the simulation results and measurements.
Here, a correction of +1071 pcm from the slug-averaged model was assumed to be constant over
the entire fuel burnup and was subtracted from all original MCNP6 results, leading to the bias-
adjusted results shown as dotted lines.
With the bias adjustment, all predicted reactivities are within 3-σ of measured values (for which
no formal uncertainty analysis has yet been completed). Moreover, the dependence of reactivity
on burnup is consistent between the two data sets. These observations indicate that the newly
added core shuffling feature of the UWNR scripted inputs successfully models the continued de-
5EPJ Web of Conferences 247, 10032 (2021) https://doi.org/10.1051/epjconf/202124710032
PHYSOR2020
Figure 4: Comparison of cold excess reactivity measurements from operation logs with
original and bias-adjusted simulation results by MCNP6
pletion of fuels across different core configurations, and, therefore, provides a starting point for
the validation of the UWNR computational model with depleted critical configurations. Future
studies will examine the impact of this temperature assumption and identify necessary modeling
improvements.
4. UNCERTAINTY QUANTIFICATION
4.1. Nuclear Data Library
To quantify the uncertainty in the keff due to nuclear data uncertainty, the TSUNAMI (Tools
for Sensitivity and Uncertainty Analysis Methodology Implementation) module within SCALE
code was used. Specifically, continuous energy (CE) TSUNAMI-3D was used with the CLUTCH
method[7]. TSUNAMI computes the energy-dependent eigenvalue sensitivity coefficient for each
reaction of each isotope in the system, which are then folded with the nuclear data covariance
matrix to compute the uncertainty in keff . These calculations were performed for each ATC config-
uration using the slug-averaged fuel model. The relative standard deviation of keff (i.e, Δkkeff ) due to
nuclear data uncertainties was found to be in the range of ± 602 to 625 pcm. Also, the computed
sensitivity coefficients were inspected, as a function of the ATC configurations, but no obvious
trend was observed from which we can deduce sources of bias.
4.2. Model Geometry
Preliminary sensitivity analysis on model geometry is presented in this section. A fresh critical
J-core configuration with undivided fuel slug geometry and slug-averaged fuel material definitions
6EPJ Web of Conferences 247, 10032 (2021) https://doi.org/10.1051/epjconf/202124710032
PHYSOR2020
was used as a reference for calculation of uncertainty in keff . A number of dimensions from pin-
level to core-level geometries were identified as parameters for perturbation. The uncertainty of
each dimension was deduced from currently available drawings based on the number of decimal
places provided for the value. Using Python scripts manually modified for direct perturbation,
MCNP6 input files were generated with each dimension perturbed by the corresponding uncer-
tainty. For statistics, MCNP6 used 5 × 10⁶ histories per cycle, 20 inactive cycles and 80 active
cycles. The eigenvalue result from each MCNP6 run was then subtracted from the eigenvalue
of the reference case to represent uncertainty in eigenvalue due to perturbation of corresponding
dimension, denoted as Δkeff .
Table 1 shows a summary of the perturbed dimensions that resulted in statistically noticeable un-
certainties in the eigenvalue. It was found that the eigenvalue is sensitive to small changes in the
fuel meat thickness even when the total fuel mass was conserved. Note that significant bias can be
introduced even with small modeling error in the cladding thickness. Moreover, it was shown that
accurate modeling of the axial positions of the control elements, especially the transient rod and
the safety blades, is important. However, the impact of perturbing the axial position of the regulat-
ing blade was negligible, as it has relatively small reactivity worth compared to the transient rod
and the safety blades.
Table 1: Effect of Uncertainty in Model Geometry
Parameter Identification Parameter Variation Relative Parameter Δkeff ± σkeff
(cm) Change (%) (pcm)
Fuel meat thickness ∗ 0.03 2 +175 ± 6
Clading thickness 0.008 14 -377 ± 6
0.08 2 +215 ± 6
Fuel pin pitch
0.03 0.8 +100 ± 6
0.8 2 -302 ± 6
Active fuel region height †
0.3 0.8 -113 ± 6
Transient rod axial position † 0.8 - +94.5 ± 6
Safety blade axial position † 0.8 - +175 ± 6
∗
By design, the fuel density changes accordingly in order to conserve the total fuel mass.
Perturbation applied to outer radius that induces more changes in fuel volume than perturbation
applied to inner radius.
†
Perturbation applied to target dimension in both positive and negative directions (x − Δx,
x + Δx). Half of the difference between Δkeff values from positive and negative perturbation was
presented as the uncertainty in eigenvalue due to perturbation of the dimension.
7EPJ Web of Conferences 247, 10032 (2021) https://doi.org/10.1051/epjconf/202124710032
PHYSOR2020
4.3. Material Composition
In this section, preliminary sensitivity analysis on material composition is presented. The reference
configuration and statistics settings (number of histories and active/inactive cycles) are identical to
Section 4.2. An uncertainty quantification study on the material properties of the UWNR compu-
tational model was conducted in two approaches, fuel material composition and non-fuel material
density.
Limited information is available for uncertainties on per-slug measurements in the as-built fuel ma-
terial compositions. Hence, the uncertainty for each quantity was defined as the standard deviation
over all values for that property across all the as-built data. As in Section 4.2, MCNP6 input files
were generated with each property universally perturbed by the corresponding uncertainty, with
the help of manually modified Python scripts for direct perturbation. Table 2 shows a summary of
the uncertainties in the eigenvalue due to perturbing the fuel material compositions. It was shown
that the eigenvalue is sensitive to small changes in most of the properties, indicating the impor-
tance of accurate fuel material modeling. Especially, small variations in U-235 mass, Er weight
percent and H/Zr atomic ratio per slug can lead to significant bias in the model. Further sensitivity
analysis on material composition will be conducted with depleted critical configurations to better
understand the effect of uncertainty in material composition over the lifetime of the reactor.
Table 2: Effect of Uncertainty in Fuel Material Composition
Parameter Identification, Parameter Variation Relative Parameter Δkeff ± σkeff
Per-slug Value Change (%) (pcm)
U-235 mass 0.55 g 1.11 +208.5 ± 6
U mass 2.69 g 1.07 -140 ± 6
Total mass 2.09 g 0.25 +45 ± 6
C wt. % 0.049 % 14.95 -96 ± 6
Er wt. % 0.064 % 7.32 -876 ± 6
H/Zr atomic ratio 0.02 1.26 +202.5 ± 6
For uncertainty in non-fuel material modeling, mass densities were perturbed, as the UWNR
model uses predefined compositions from the compendium of material compositions[8] provided
by PyNE. Table 3 shows the uncertainties in eigenvalue due to perturbing the non-fuel material
density. Most of the density perturbations resulted in statistically negligible uncertainties in eigen-
value, except graphite. Further investigation is underway in order to better understand the impact
of the uncertainty in graphite modeling on the eigenvalue.
8EPJ Web of Conferences 247, 10032 (2021) https://doi.org/10.1051/epjconf/202124710032
PHYSOR2020
Table 3: Effect of Uncertainty in Non-fuel Material Density
Parameter Identification Parameter Variation Relative Parameter Δkeff ± σkeff
Change (%) (pcm)
Stainless steel 0.01 g/cc 0.125 12 ± 6
Zirconium 0.01 g/cc 0.153 8±6
0.000001 g/cc 0.0001 17 ± 6
Water
3 ◦C 0.06 13 ± 6
Carbon (graphite) 0.01 g/cc 0.59 31.5 ± 6
Boron carbide 0.01 g/cc 0.4 14 ± 6
Boral 0.01 g/cc 0.4 18 ± 6
Aluminum 0.01 g/cc 0.37 18 ± 6
5. CONCLUSIONS
Recent addition of SCALE/KENO representation to the model was validated with a set of fresh
critical configurations from approach-to-critical measurements. It was observed that the modeling
results by KENO provide increased confidence in the UWNR computational model, as they lead
to smaller variance on averaged eigenvalues when added to MCNP6 and Serpent results. Also,
KENO results were observed to be closer to MCNP6 results than Serpent results, suggesting further
investigation of the Serpent model.
Initial efforts to validate the UWNR model with depleted critical configurations in the MCNP6 rep-
resentation against measurements from operation logs have demonstrated that the model can cor-
rectly follow the reactivity changes associated with burnup and depletion. It was shown that general
trend of reactivity change with burnup simulated by MCNP6 is parallel to the trend recorded in
the operation logs. After adjustment of bias established in fresh critical configurations to all stages
of simulated burnup, simulated cold excess reactivities were found to be statistically equivalent to
the actual measurements on both J-core and K-core. As a result, it was confirmed that the UWNR
computational model with the recent addition of core shuffling feature successfully modeled con-
tinued depletion of fuel elements after shuffling of core configuration from J-core to K-core. This
will lead to an accurate modeling of depleted fuel material inventories as of today.
Moreover, a preliminary uncertainty quantification study was performed. For the nuclear data
induced uncertainty, the TSUNAMI-3D sequence in SCALE was used. The relative standard de-
viation of keff was found to be about ± 600 pcm. For the uncertainties due to model geometry and
material composition, direct perturbation calculations were performed using the MCNP6 model
in order to investigate the sensitivity of keff to changes on dimensions and material properties
which could be either due to modelling error or real uncertainty in the parameters. As a result,
model parameters having great impact on the simulated eigenvalue were identified. Results show
9EPJ Web of Conferences 247, 10032 (2021) https://doi.org/10.1051/epjconf/202124710032
PHYSOR2020
that significant bias on the keff can be introduced with small modeling error on cladding and fuel
meat thicknesses. Also, keff of the UWNR model was found to be sensitive to axial position of
the transient rod and the safety blades. For fuel material compositions, uncertainties in U-235
mass, Er weight percent and H/Zr atomic ratio were found to have the greatest impact on the keff .
Also, uncertainty in the carbon density seems to have the most significant effect among all other
perturbed non-fuel material densities. Future work will involve more in-depth uncertainty quantifi-
cation study where Monte Carlo sampling technique could be used along with SCALE S/U tools,
to identify the major sources of bias.
ACKNOWLEDGEMENTS
This material is based upon work supported by the DOE Office of Nuclear Energy’s Nuclear En-
ergy University Program under Award Numbers DE-NE0008408 and DE-NE0008750. This re-
search was performed using the compute resources and assistance of the UW-Madison Center For
High Throughput Computing (CHTC) in the Department of Computer Sciences. The CHTC is
supported by UW-Madison, the Advanced Computing Initiative, the Wisconsin Alumni Research
Foundation, the Wisconsin Institutes for Discovery, and the National Science Foundation, and is an
active member of the Open Science Grid, which is supported by the National Science Foundation
and the U.S. Department of Energy’s Office of Science. In addition, some of the computing for
this project was performed on the Beocat Research Cluster at K-State, which is funded in part by
NSF grants CNS-1006860, EPS-1006860, EPS-0919443, ACI-1440548, CHE-1726332, and NIH
P20GM113109.
REFERENCES
[1] Y.-H. Park, A. Swenson, and P. P. Wilson. “University of Wisconsin Nuclear Reactor Modeling
Improvements.” In Transactions of the American Nuclear Society, volume 116, pp. 1082–
1085. Pennsylvania, US (2017).
[2] Y.-H. Park, A. Swenson, P. P. Wilson, Y. Cheng, R. L. Reed, and J. A. Roberts. “IMPROVED
MODELING OF THE UNIVERSITY OF WISCONSIN NUCLEAR REACTOR BY AUTO-
MATIC GENERATION OF COMPUTATIONAL MODELS.” In Proceedings of the PHYSOR
2018, volume 1, pp. 2734–2747. Cancun, Mexico (2018).
[3] J. Leppänen, M. Pusa, T. Viitanen, V. Valtavirta, and T. Kaltiaisenaho. “The Serpent Monte
Carlo code: Status, development and applications in 2013.” Annals of Nuclear Energy, vol-
ume 82, pp. 142–150 (2015).
[4] C. J. Werner(editor). MCNP Users Manual - Code Version 6.2. Los Alamos National Labora-
tory, New Mexico, US (2017).
[5] Y. Cheng and J. A. Roberts. “A study of reactivity biases and their dependence on spatial
discretization in depleted TRIGA fuel.” Annals of Nuclear Energy, volume 108, pp. 126–131
(2017).
[6] B. T. Rearden and M. A. Jessee (Eds.). SCALE Code System. Oak Ridge National Laboratory,
Tennessee, US (2016).
[7] C. M. Perfetti and B. T. Rearden. “SCALE 6.2 Continuous-Energy TSUNAMI-3D Capabili-
ties.” (2015).
[8] R. Mcconn, C. Gesh, R. Pagh, R. Rucker, and R. Williams. “Compendium of Material Com-
position Data for Radiation Transport Modeling.” (2011).
10You can also read