Trend Analysis Modelling and Prediction of Epidemic COVID-19 for US, Italy, Spain and Pakistan
←
→
Page content transcription
If your browser does not render page correctly, please read the page content below
Preprint: Please note that this article has not completed peer review.

Trend Analysis Modelling and Prediction of Epidemic
COVID-19 for US, Italy, Spain and Pakistan
CURRENT STATUS:                    POSTED

Muzaffar Bashir
University of the Punjab, Lahore, Pakistan

 muzaffarbashir@gmail.comCorresponding Author

Habeeba Abdul Sattar
University of the Punjab, Lahore, Pakistan

Aliya Zaheer
University of the Punjab, Lahore, Pakistan

  10.21203/rs.3.rs-27320/v1
SUBJECT AREAS
 Infectious Diseases      Biophysics
KEYWORDS
 numerical simulation, curve fitting, modelling and prediction, trend analysis,
 Coronavirus breakout

                                                   1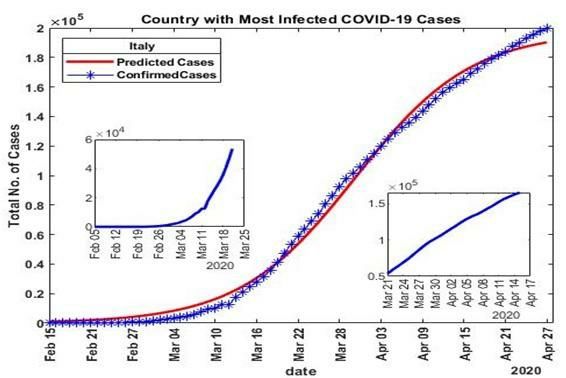
Abstract
The evidence of Covid19 outbreak was first received in December 2019 in China and it spread out

rapidly on the map of the world. The cases of Coronavirus are increasing day by day around the world

due to which mortality rate raises hastily. In the matter of days, WHO declared Covid19 as pandemic

of the decade. So far, it is controlled by taking strict precautions in terms of lockdown and supervised

treatments at the hospital. As its epidemic is severely breaking the scale, there is a necessity to

recognize and evaluate its extension in people on each new day. We collected time series data from

January 22, to April 28, 2020 which includes the number of confirmed patients (CP) and reported

deaths (RD) of 186 countries all around the world. We choose to evaluate the data for US, Italy, Spain

and Pakistan. We are selecting here the data up to April 28, 2020, however the data is automatically

updated from Humanitarian Data Exchange on daily basis for all the countries suffering from this

pandemic. In this study, three parameters logistic (autocatalytic) model is applied to characterize the

disease which determine the size of epidemic with the most populated hit cases around the world

respectively and predict the life cycle of COVID 19 cases by using Gaussian based prediction model. It

is determined that there are worst numbers of cases of Coronavirus that are found in US and the

number of CPs and RDs grow exponentially around the world underneath Spain, Italy, UK and France

etc. The epicentre of this pandemic was the city of Wuhan, China. The firm defence that has been

taken is to quarantine the people and the patients were cured in organized hospitals.

1. Introduction
1.1 Background

Coronaviruses are group of viruses that infect mammals and birds. In humans these viruses produce

disease through the respiratory tract and ranges from mild to lethal. In mild cases, there is common

cold while in lethal cases there is SARS (Severe Acute Respiratory Syndrome), MERS (Middle East

Respiratory Syndrome) and Covid-19 (Coronavirus Disease 2019). During the 2002–2003 outbreaks,

SARS infection was reported in 29 countries in North America, South America, Europe and Asia.

Overall 8098 infected individuals were identified, with 774 SARS-related fatalities [1]. MERS is a

respiratory disease caused by a newly familiar coronavirus, MERS-CoV. It was first reported in 2012 in

                                                    2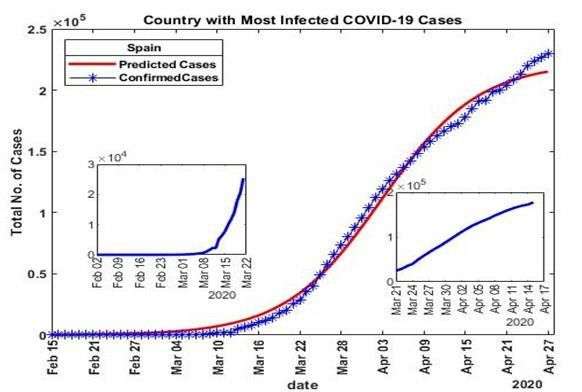
Saudi Arabia and is thus far linked to countries in or near the Arabian Peninsula. Laboratory-confirmed

MERS has now been recognized in Bahrain, Iran, Jordan, Kuwait, Lebanon, Oman, Qatar, Saudi Arabia,

United Arab Emirates (UAE), and Yemen. A large MERS outbreak occurred in the Republic of South

Korea associated to a traveller from the Arabian Peninsula in 2015. Travel-accompanying cases have

been identified in Algeria, Austria, China, Egypt, France, Germany, Greece, Italy, Malaysia,

Netherlands, Philippines, Republic of Korea, Thailand, Tunisia, Turkey, United Kingdom (UK), and

United States (US). MERS-CoV infected 2494 individuals and caused 858 deaths worldwide to date [2].

Coronavirus disease 2019 (COVID-19) is well-defined as infection triggered by a novel coronavirus

now called severe acute respiratory syndrome coronavirus 2 (SARS-CoV-2; formerly called 2019-

nCoV), which was first recognized amongst an outbreak of respiratory illness cases in Wuhan City, the

capital of Hubei Province, China. The numbers of the accumulative confirmed infected patients were

predicted very accurately in different regions of China [3]. The emergence of COVID-19 coincided with

the largest annual human migration in the world, i.e., the Spring Festival travel season, which

resulted in a rapid national and global spread of the virus [4]. It was primarily informed to the WHO on

December 31, 2019. On January 30, 2020, the WHO acknowledged the COVID-19 outbreak a global

health emergency. On March 11, 2020, the WHO declared COVID-19 a global pandemic. Illness caused

by SARS-CoV-2 was recently termed COVID-19 by the WHO, the new acronym derived from

“coronavirus disease 2019”.

1.1 Interpretation

Covid-19 outbreak is a global disaster. There is a prodigious loss of lives, furthermore it destroy the

economy of the countries worldwide as many of them have gone to the lockdown. If this pandemic

has to be handled, then there is requirement of unification of the whole world to fight this disease by

taking safety measures. Otherwise there is probability of great loss of human lives in this decade due

to this infection as the death rate is increasing rapidly. Preparedness plans and mitigation

interventions should be readied for quick deployment globally [2].

Aims

Globally, the government, doctors, paramedics, nurses, medical technicians and the community is

                                                    3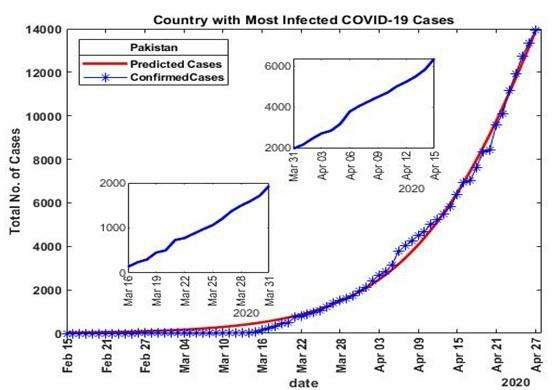
affianced to fight with Covid-19. If we will be strong-minded and keep on struggling with this infection
then there is the opportunity to triumph this conflict. In this study, we figure out the prediction of total
cases of Covid-19 with each new day in those countries which have large number of cases as
compared to others including US, Spain, Germany, France, Italy and China along with their death
record. Ultimately, we attempt to give awareness how hazardous this pandemic could be with each
new growing day and what will be the life cycle of the pandemic in terms of number of confirmed
patients as well as number of reported death cases.
Methodology
In this scenario, the data is available from Humanitarian Data Exchange (HDE) of Covid-19 in each
country (About 186 countries) of the world. There is the record of number of CP cases and RD cases
around the world starting from January 22, 2020. Data is available for all the countries which are
under the impact of this epidemic. In this study analysis for modelling is applied on US, Italy, Spain
and Pakistan to evaluate and simulate for the CP and RD cases. We choose here the data up to April
28, 2020, but data is routinely updated from the HDE or other sources available online. A three
parametric nonlinear logistic model is applied on the data of four most interesting countries to assess
how the disease has its dynamic spread in these countries and how it will influence in near future.
2. Materials And Methods
In this study, we first organized the data of the countries with Covid-19 confirmed patients CP and
reported deaths RD cases. The data evaluated in this study is from January 22, 2020 to April 28, 2020.
We develop model for those countries that have large number of CPs and RDs at first, so that it can
be estimated that how largely this infection has its impact on the world. After that the proposed
model is applied on the dataset which predict its limit of emerging infection and the deaths due to
this infection on the new days in future and to estimate what will be the life cycle of the pandemic.
2.1 Data sources and conventions
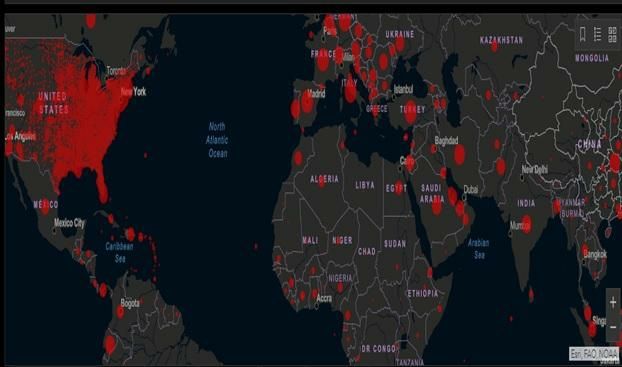
According to WHO report of Jan 21, 2020, there were 314 cases of COVID-19, 304 out of 314 were the
cases of mainland, China. Recently 2,954,222 confirmed cases of Coronavirus and 202,597 deaths
are reported by WHO globally. We show distribution and an estimate size of the pandemic globally in
4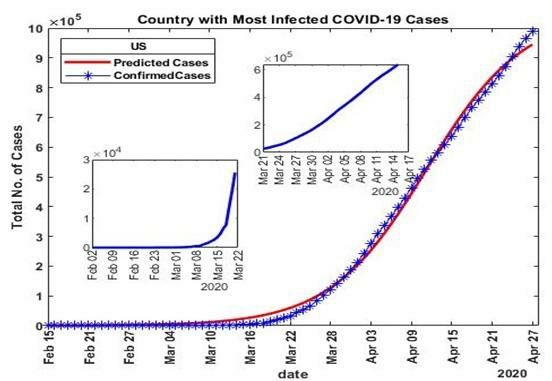
the Figure 1.

2.2 Proposed model used in the study

We used here three parameters nonlinear [5] logistic regression approach on the dataset. The

objective of using nonlinear regression modelling is to propose a model that provides the best curve

fit for the data. Then to discover parameterization (or "model function") whose Least Square

estimators are as close as possible to being jointly normally distributed and unbiased, the property

that prevails in a linear model [6].The nonlinear equation used in the proposed model is (see Equation

1 in the Supplementary Files)

Where y variable stores the size of infected people/growth rate/the number of cases in each country

and x variable stores the corresponding time. The Sigmoidal behavior by modeling the current growth

rate as the product of functions of the current size and remaining growth is given by: (see Equation 2

in the Supplementary Files)

Where g and h are increasing functions with g(0)=h(0)=0

For many types of growth data, the growth data does not decline steadily, but rather increases to a

maximum before steadily declining to zero. This is shown in the growth curve by an S-shaped, or

sigmoidal pattern [6] as shown in the Figure 2. The bell-shaped curve can be used to point out

growth, maximum reach point and then eventually decay rate of the disease as shown in the Figure 2.

The simplest form of equation (2) is with g (f)=h(f)=f, so that (see Equation 3 in the Supplemental

Files)

Where >0 and 0
and RDs cases we implemented bell-shape curve or Gaussian distribution based curve fitting

prediction model.

3. Results And Discussion
As shown in the Figures 3-6, the data analysis of epidemic is given for the period Jan 22, 2020 to April

28, 2020 for US, Italy, Spain and Pakistan respectively. From the results, it is clear that the pandemic

is horribly affecting the human lives with the passage of time. The model based curve which appears

in red shows that how high this outbreak will be dangerous on the next incoming days. On April 28,

2020 there are 9.882e+05 infected cases of US, 1.9941e+05 cases of Italy, 2.2942e+05 cases of

Spain and 13915 CPs of Pakistan. In such scenarios, there isn’t a sudden fall; firstly there will be the

maximum growth rate of the illness where we may see s-shape curve. Then illness will reach up to

maximum growth point. Finally then illness will descent gradually. So it is important to visualize

growth of the disease, its maximum reach and finally the decay.

In the Figures 7-10, the growth rate of number of deaths per day w.r.t days are shown for four

countries. The exploration of reported death (RD) cases or death rate is depicted from Jan 22, 2020 to

April 28, 2020 for US, Italy, Spain and Pakistan respectively. On April 28, 2020 there are 56259 RDs of

US, 26977 death cases of Italy, 23521 RDs of Spain and 292 death cases of Pakistan. The model

based curve is appeared in red whereas blue curve shows the original data and the model fitting

parameters are also given in Table 1. Most importantly, with the model and parameters in hand, we

can perform simulations for an extended period and forecast the potential tendency of growth rate

and maximum growth reached point for the COVID-19 epidemic. To prevent the spread of COVID-19,

measures are based on effective infection control and isolation. The relative measures are mainly

focused on 4 aspects, confirmed cases, close contact handling, community prevention as well as

protection on healthcare workers [8]. Without public health control or self-protective measures, the

epidemic was likely to grow in a relatively large rate. Thus, control measures as well as self-

administered protective actions are crucial to reduce the transmissibility of COVID-19 and thus

mitigate the outbreak size and prevent for further burden [3][9].

 Table 1: This table displays the details of the estimation of the model parameters which is fitted on all the figures (3-10). The

                                                          6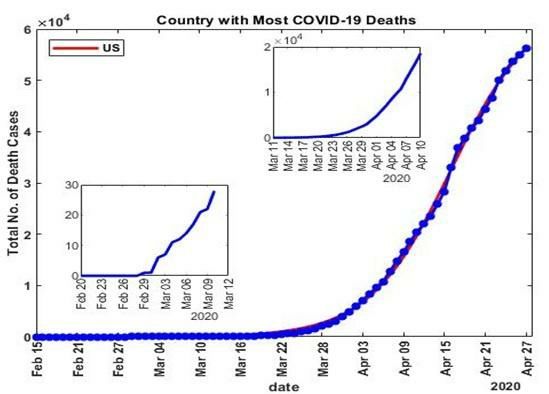
statistic (Tstat) is the coefficient divided by its standard error. The standard error (SE) is an estimate of the standard deviatio
coefficient, the amount it varies across cases. The p-value for each term tests the null hypothesis that the coefficient is equa
(no effect). A low p-value (< 0.05) indicates that we can reject the null hypothesis. In other words, a predictor that has a low
is likely to be a meaningful addition to our model because changes in the predictor's value are related to changes in the resp
variable.
US CP model Parameters

Parameters                  Estimate                     SE                           Tstat                       Pvalue

A                           995363                       5.24E-12                     1.90E+17                    0

B                           0.145881                     0.000158                     925.0173                    6.78E-188

C                           106108.9                     1.87E-11                     5.67E+15                    0

Italy CP model Parameters

Parameters                  Estimate                     SE                           Tstat                       Pvalue

A                           193378.9                     2006.656                     96.36875                    3.44E-94

B                           0.121916                     0.002837                     42.97161                    1.09E-62

C                           3910.534                     672.2646                     5.816957                    8.62E-08

China CP model Parameters

Parameters                  Estimate                     SE                           Tstat                       Pvalue

A                           82049.47                     246.0332                     333.4894                    1.30E-143

B                           0.215296                     0.005248                     41.02073                    6.38E-61

C                           47.62948                     4.561421                     10.44181                    2.70E-17

Pakistan CP model Parameters

Parameters                  Estimate                     SE                           Tstat                       Pvalue

A                           28664.09                     3270.315                     8.764933                    9.05E-14

B                           0.093881                     0.003212                     29.23171                    2.36E-48

C                           9103.544                     1277.51                      7.126007                    2.26E-10

US RD model Parameters

Parameters                  Estimate                     SE                           Tstat                       Pvalue

A                           65007.91                     558.837                      116.3271                    1.61E-102

B                           0.165656                     0.000253                     656.0303                    2.97E-172

C                           1295652                      1.775805                     729614.1                    0

Italy RD model Parameters

Parameters                  Estimate                     SE                           Tstat                       Pvalue

A                           26316.67                     283.9599                     92.67742                    1.20E-92

B                           0.129425                     0.002953                     43.83544                    1.91E-63

C                           9470.066                     1770.516                     5.348761                    6.43E-07

China RD model Parameters

Parameters                  Estimate                     SE                           Tstat                       Pvalue

A                           3617.383                     63.33025                     57.11935                    1.20E-73

                                                          7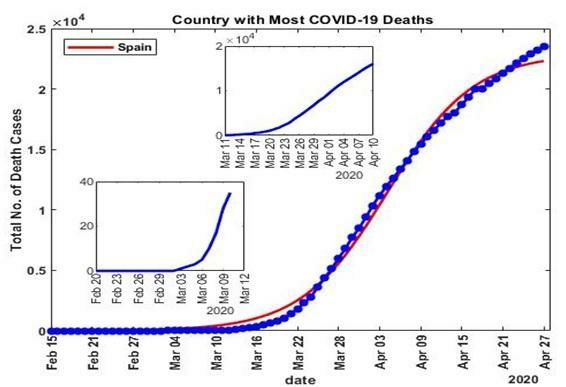
B                        0.113059                  0.009951                 11.36114                  3.30E-19

 C                        21.16631                  5.58058                  3.792852                  2.66E-04

 Pakistan RD model Parameters

 Parameters               Estimate                  SE                       Tstat                     Pvalue

 A                        737.1038                  57.21119                 12.88391                  2.12E-22

 B                        0.114127                  0.001187                 96.15899                  6.81E-95

 C                        78977.18                  0.297084                 265841.2                  0

The bell-shaped curve or Gaussian curve fitting model is applied to simulate the life cycle of the

disease. It can be used to point out growth, maximum reach point and then eventually decay rate of

the disease. As shown in the Figures 11-14/(Figures 15-18,) the confirmed patients/(reported deaths)

data analysis of epidemic life cycle is given for the period Jan 22, 2020 to April 28, 2020 for US, Italy,

Spain and Pakistan respectively. The Gaussian model based curve is appeared in red whereas blue

shows the original CP (confirmed patients) and RD (reported death) cases data.

From the results, it is clear that the pandemic is horribly affecting the human lives with the passage

of time. The model based curve which appears in red shows life cycle epidemic in terms of CP and RD

cases. The figures 11-18 show that how high this outbreak will be dangerous on the next incoming

days. Most importantly, with the proposed model, we performed simulations for an extended period

and forecast the potential life cycle: tendency of growth rate and maximum growth reached point and

decay for the COVID-19 epidemic.

Towards the epidemic of COVID-19, our basic predictions are summarised as follows:

1.    Based on simulate based estimation, the epidemic of COVID-19 in US, Italy and Spain would be

      more severe in the upcoming days. As shown in figure 11, the worst state of illness in US will be

      at peak up to April 30 to May 5, 2020 with the 88e+05 patients approximately. In figure 12 the

      nastiest situation of Covid-19 in Italy will be at top from April 28 to May 3, 2020 with the

      1.97e+05 patients roughly. In figure 13 the worst condition of epidemic is pictured for Spain

      from April 25 to May 4, 2020 with 2.36e+05 patients approximately while in figure 14 the worst

      situation of Pakistan is clearly shown from June 4,2020 to June 10, 2020 with 4.8e+04 patients

      approximately. Moreover the number of deaths due to suffering this illness will be more severe

                                                     8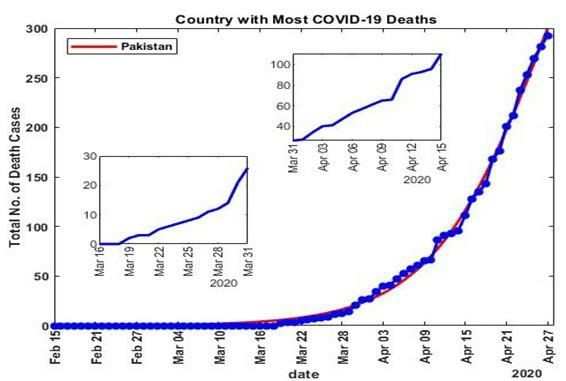
in US, Italy, Spain and Pakistan in that specific period which is mentioned above and can be

      clearly observed in Figures 15-18.

2.    The state of infection in US will be in under control from May 16, 2020 while the situation of

      Covid-19 in Italy will be in hand from May 20, 2020. In figure 13 the controlled situation of

      epidemic is pictured for Spain from May 18, 2020 while in Pakistan the well-ordered condition of

      epidemic is clearly shown from July 14, 2020 as marked by the middle black dotted line in the

      figure 14.

3.    Keeping in mind the current stage (level), our simulation based predictions suggest there will be

      90% recovery probabilities in US, Italy, Spain and Pakistan in May 31, June 6, June 2 and August

      10 respectively.

4. Conclusion
In this study, we proposed a generalized model to analyze the epidemic of COVID-19, which was

firstly reported in Wuhan last December and then quickly spread out worldwide. Our model properly

evaluates and predicts the trends for confirmed patients CP and reported death RD cases on the

outbreak of this epidemic. The model is applied on the time series data from 22 Jan, 2020 to 28 Apr,

2020. The data for the four interesting countries US, Italy, Spain and Pakistan are evaluated. Based on

detailed analysis of the data the epidemic of COVID-19 in US would be more severe in the coming

days. We expect it would be terminated at the end of May. While in Italy and Spain, the triumph of

anti-epidemic would be achieved in the middle of June and in Pakistan positively, it would be

terminated at the beginning of August. Using the initial sizes of the epidemic outbreak, we can use

the model with known parameters and architecture to estimate the sizes of outbreak in the future and

simulate the impact of the interventions on the sizes and severity of the epidemics. Complimentary to

the model approach to broadcast dynamics of virus outbreaks, it provides the real time forecasting

tools for tracking, estimating the trajectory of epidemics, judging their severity, prophesying the

lengths of epidemics and supporting government and health personnel to design and execute the

plan and decent verdicts.

Declarations

                                                    9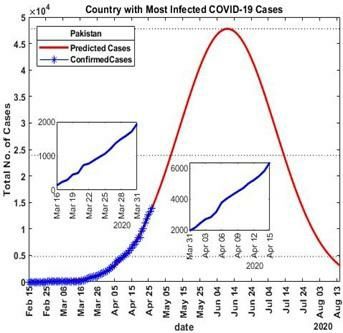
Acknowledgment

We are thankful to the University of the Punjab, Lahore, Pakistan.

The authors declare non for conflict of interests.

References
1.    Lam, C. W., Chan, M. H., & Wong, C. K. (2004). Severe acute respiratory syndrome:

      clinical and laboratory manifestations. The Clinical Biochemist Reviews, 25(2), 121.

2.    Wu, J. T., Leung, K., & Leung, G. M. (2020). Nowcasting and forecasting the potential

      domestic and international spread of the 2019-nCoV outbreak originating in Wuhan,

      China: a modelling study. The Lancet, 395(10225), 689-697.

3.    Pei, L. Prediction of numbers of the accumulative confirmed patients (NACP) and the

      plateau phase of 2019-nCoV in China. Cogn Neurodyn(2020).

      https://doi.org/10.1007/s11571-020-09588-4

4.    Lin, Q., Zhao, S., Gao, D., Lou, Y., Yang, S., Musa, S. S., ... & He, D. (2020). A

      conceptual model for the coronavirus disease 2019 (COVID-19) outbreak in Wuhan,

      China with individual reaction and governmental action. International journal of

      infectious diseases, 93, 211-216.

5.    Zhao, S., Lin, Q., Ran, J., Musa, S. S., Yang, G., Wang, W., ... & Wang, M. H. (2020).

      Preliminary estimation of the basic reproduction number of novel coronavirus (2019-

      nCoV) in China, from 2019 to 2020: A data-driven analysis in the early phase of the

      outbreak. International journal of infectious diseases, 92, 214-217.

6.    Ratkowsky, D. A., & Reedy, T. J. (1986). Choosing Near-Linear Parameters in the Four-

      Parameter Logistic Model for Radioligand and Related Assays. Biometrics, 42(3), 575–

      582. doi: 10.2307/2531207

7.    Seber, G. A. F., & Wild, C. J. (1989). Nonlinear regression. 1989. Search PubMed, 325-

      365.

                                                     10
8. Law, S., Leung, A. W., & Xu, C. (2020). Severe Acute Respiratory Syndrome (SARS)
and Coronavirus disease-2019 (COVID-19): From Causes to Preventions in Hong
Kong. International Journal of Infectious Diseases.
9. Zhuang, Z., Zhao, S., Lin, Q., Cao, P., Lou, Y., Yang, L., & Xiao, L. (2020). Preliminary
estimating the reproduction number of the coronavirus disease (COVID-19) outbreak
in Republic of Korea and Italy by 5 March 2020. International Journal of Infectious
Diseases.
Figures
11Figure 1
Cumulative Confirmed Cases of COVID-19 Johns Hopkins University CSSE is tracking the
spread of SARS-CoV-2 in near real time with a map-centric dashboard (using ArcGIS Online)
that pulls relevant data from the WHO, US CDC (Centers for Disease Control and
Prevention), ECDC (European Centre for Disease Prevention and Control), Chinese Center for
Disease Control and Prevention (CCDC), NHC (China’s National Health Commission), and
Dingxiangyuan (DXY, China). Screenshot date: 28 April, 2020. Note: The designations
employed and the presentation of the material on this map do not imply the expression of
any opinion whatsoever on the part of Research Square concerning the legal status of any
country, territory, city or area or of its authorities, or concerning the delimitation of its
frontiers or boundaries. This map has been provided by the authors.
12Figure 2
Sigmoidal Growth model (a) S-shape or Growth curve with A= final size and C= point of
inflection (b) Bell-shape curve also show Growth-rate curve with wM = maximum growth
rate
13Figure 3
Epidemic size of illness in United states of America up to April 28, 2020. Confirmed Cases
forecast as on 28 Apr. 20. Red curve demonstrates the predicted cases via relating the
model and blue curve demonstrates the authentic figure of infected people with COVID-19.
There are two insets in the figure. One shows the clear Configuration of CP in US from Feb
02, 2020 to March 22, 2020 and the other shows more revealing results from March 21,
2020 to April 17, 2020.
14Figure 4
Epidemic size of illness in Italy up to April 28, 2020. CP forecast as on 28 Apr. 20. Red curve
demonstrates the predicted cases via relating the model and blue curve demonstrates the
authentic figure of infected people with COVID-19. There are two insets in the figure. One
shows the clear Configuration of CC in Italy from Feb 05, 2020 to March 25, 2020 and the
other shows more revealing results from March 21, 2020 to April 17, 2020.
15Figure 5
Epidemic size of illness in Spain up to April 28, 2020. CP forecast as on 28 Apr. 20. Red
curve demonstrate the predicted cases via relating the model and blue curve demonstrate
the authentic figure of infected people with Covid-19. There are two inset figures. One show
the clear Configuration of CC in Spain from Feb 02, 2020 to March 22, 2020 and other shows
more revealing results from March 21, 2020 to April 17, 2020
16Figure 6
Epidemic size of illness in Pakistan up to April 28, 2020. CP forecast as on 28 Apr. 20. Red
curve demonstrate the predicted cases via relating the model and blue curve demonstrate
the authentic figure of infected people with Covid-19. There are two inset figures. One show
the clear Configuration of CP in Pakistan from March 16, 2020 to March 31, 2020 and other
shows more revealing results from March 31, 2020 to April 15, 2020
17Figure 7
Death Analysis Due to Pandemic in United States of America up to April 28, 2020. RD
forecast as on 28 Apr. 20. Red curve demonstrate the predicted death cases via relating the
model and blue curve demonstrate the authentic figure of died people with Covid-19.There
are two inset figures. One show the clear Configuration of deaths in US from Feb 20, 2020 to
March 12, 2020 and other shows more revealing results from March 11, 2020 to April 10,
2020.
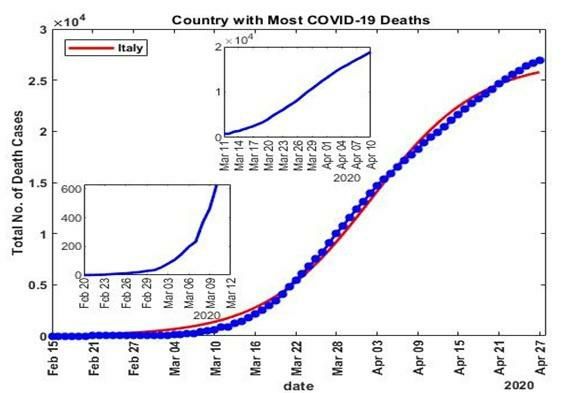
18Figure 8
Death Analysis Due to Pandemic in Italy up to April 28, 2020. RD forecast as on 28 Apr. 20.
Red curve demonstrate the predicted death cases via relating the model and blue curve
demonstrate the authentic figure of died people with Covid-19.There are two inset figures.
One show the clear Configuration of deaths in Italy from Feb 20, 2020 to March 12, 2020
and other shows more revealing results from March 11, 2020 to April 10, 2020.
19Figure 9
Death Analysis Due to Pandemic in Mainland Spain up to April 28, 2020. RD forecast as on
28 Apr. 20. Red curve demonstrate the predicted death cases via relating the model and
blue curve demonstrate the authentic figure of died people with Covid-19.There are two
inset figures. One show the clear Configuration of deaths in Spain from Feb 20, 2020 to
March 12, 2020 and other shows more revealing results from March 11, 2020 to April 10,
2020
20Figure 10
Death Analysis Due to Pandemic in Pakistan up to April 28, 2020. RD forecast as on 28 Apr.
20. Red curve demonstrate the predicted death cases via relating the model and blue curve
demonstrate the authentic figure of died people with Covid-19.There are two inset figures.
One show the clear Configuration of deaths in Pakistan from March 16, 2020 to March 31,
2020 and other shows more revealing results from March 31, 2020 to April 15, 2020
21Figure 11
COVID-19 Epidemic Simulation for US
22Figure 12
COVID-19 Epidemic Simulation for Italy
Figure 13
COVID-19 Epidemic Simulation for Spain
23Figure 14
COVID-19 Epidemic Simulation for Pakistan
24Figure 15
Death Analysis due to COVID-19 in US
25Figure 16
Death Analysis due to COVID-19 in Italy
26Figure 17
Death Analysis due to COVID-19 in Spain
27Figure 18
Death Analysis due to COVID-19 in Pakistan
Supplementary Files
This is a list of supplementary files associated with this preprint. Click to download.
Equations.pdf
28You can also read