Ether Price Prediction Using Gated Recurrent Unit Gopinath Balu
←
→
Page content transcription
If your browser does not render page correctly, please read the page content below
Journal of Shanghai Jiaotong University                                                                             ISSN: 1007-1172

                      Ether Price Prediction Using Gated Recurrent Unit

                                                     Gopinath Balu
                                 Crescent Institute of Science and Technology, Vandalur, Chennai.

        ABSTRACT

                          The main objective of this project is to develop a prediction model which predicts Ether crypto
                 currency price. Ether is the second widely used crypto currency with $60 billion market capitalization as
                 on date. Price prediction of stocks from stock market has been well studied both in industry and academia
                 but crypto currency price prediction is just gaining momentum. Specifically Ether price prediction is
                 inadequately studied using Gated Recurrent Unit (GRU). GRU is a type of neural network which is mostly
                 used for time series model and sequence models. Long Short-Term Memory (LSTM) is a predecessor of
                 GRU which has the same accuracy but not so efficient to train. For this reason GRU architecture was used
                 in this work and the results show the capability to handle volatile price index and remembering information
                 and dependency from the past. Prediction from GRU model has good prediction accuracy in the test set. In
                 this project data was scraped from a crypto currency website called CoinMarketCap and split into training
                 set and test set. Training data was used to train the model and test data was used to check the accuracy of
                 the model’s prediction.

                          This project has four modules which are Extracting data from exchange, Data preprocessing,
                 Model prediction and Data visualization. Data for training and testing was scraped from CoinMarketCap
                 in Extracting data from exchange module. In the Data preprocessing module, feature columns are selected
                 and data is scaled. Model prediction module is where model is trained and validated with respect to
                 accuracy. Prediction along with the history price of ether and various currency prices are shown in a
                 dashboard in Data visualization module.

                          Advantage of the proposed system is that it can remember long-term information and dependency.
                 When the training data is more in volume prediction accuracy tends to be better. Downside of the project is
                 that there is no fixed structure to construct a GRU network. One has to build network based on trial and
                 error methodology with respect to accuracy. In future this system can be enhanced by scaling training and
                 testing data separately so that the test set information is not broadcasted. This project was developed
                 mainly using Python with Tensorflow and PowerBI.

Volume 17, Issue 1, January - 2021                                                                  https://shjtdxxb-e.cn/ Page No: 47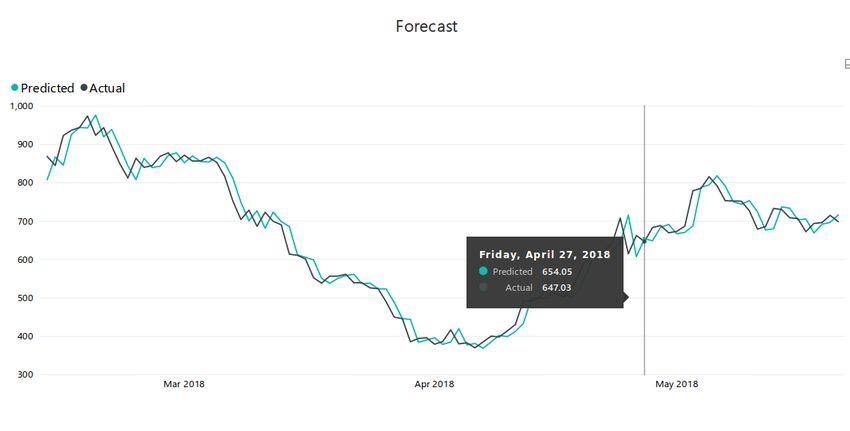
Journal of Shanghai Jiaotong University                                                                       ISSN: 1007-1172

                 INTRODUCTION

                 1.1      GENERAL

                          Blockchain is a distributed and decentralized technology with potential to replace legacy
                 financial/banking systems. With its interdisciplinary nature it has attracted interest from
                 cryptography, distributed networking and computer science. Blockchain technologies is
                 something which can do things beyond money transactions and could open gates like "exchange
                 of value without intermediaries like government or any such organizations acting as middleman
                 of money and information." Industries like global supply chains, financial transactions, asset
                 ledgers and decentralized social networking are expected to be transformed with the increasing
                 adoption of Blockchain.

                          Crypto currency is one such application built on top of Blockchain and has already
                 disrupted the banking sector. Countries like USA, Canada, Australia and the Europe Union have
                 accepted trading or possession of crypto as a legal tender and also Venezuela went on to establish
                 their own crypto. There are also some countries which banned crypto. However India is neutral in
                 its stand and also it has still not regulated. Crypto trading being more speculative there are high
                 chances of short term trader losing all his money overnight. So, prediction of next day or the next
                 week would really help ant trader.

                          There are some widely used traditional time series model which are the de-facto models
                 when it comes to training time series models although they are capable and good enough in price
                 prediction. However the recent advancement of Recurrent Neural Networks (specifically Long
                 Short Term Memory networks and its variants) seems to capture trends long term and are
                 performing better than statiscal methods.

                 1.2 EXISTING SYSTEM OF THE PROJECT

                          Statistical models are the de-facto models in time series prediction for over last three
                 decades. These models work pretty well for stock market price prediction, but not for crypto
                 currency as the price volatility is quite high. Also these models require a lot of manual
                 preprocessing and requires the data to be stationary (stationary time series is one whose statistical

Volume 17, Issue 1, January - 2021                                                            https://shjtdxxb-e.cn/ Page No: 48
Journal of Shanghai Jiaotong University ISSN: 1007-1172
properties such as mean, variance, autocorrelation, etc. are all constant over time). To add to the
list there is no one specific statistical model to train time series data, one has to select model
based on many statistical tests like autocorrelation function, partial autocorrelation function and
Augmented Dickey Fuller Test etc. Domain knowledge is required for feature engineering to
improve the prediction accuracy, which is not always possible.
1.2.1 LITERATURE SURVEY
Kai Chen, Yi Zhou, Fangyan Dai [1] proposed A LSTM-based method for stock returns
prediction. They conclude,“Prediction of stock market has attracted attention from industry to
academia. Various machine learning algorithms such as neural networks, genetic algorithms,
support vector machine, and others are used to predict stock prices. Some designs of RNNs were
used to predict stock market. Long Short-Term Memory (LSTM) is one of the most successful
RNNs architectures. LSTM introduces the memory cell, a unit of computation that replaces
traditional artificial neurons in the hidden layer of a network. With these memory cells, networks
are able to effectively associate memories and input remote in time, hence suit to grasp the
structure of data dynamically over time with high prediction capacity.”
Luca Di Persio, OleksandrHonchar [2] proposed Artificial neural networks approach to
the forecast of stock market price movements. Their work states “Artificial Neural Network
(ANN) approach to predict stock market indices. In particular, we focus our attention on their
trend movement up or down. We provide results of experiments exploiting different Neural
Networks architectures, namely the Multi-layer Perceptron (MLP), the Convolution Neural
Networks (CNN), and the Long Short-Term Memory (LSTM) recurrent neural networks
technique. We show importance of choosing correct input features and their preprocessing for
learning algorithm. Finally we test our algorithm on the S&P500 and FOREX EUR/USD
historical time series, predicting trend on the basis of data from the past n days, in the case of
S&P500, or minutes, in the FOREX framework. We provide a novel approach based on
combination of wavelets and CNN which outperforms basic neural networks approaches.”
Matthew Chen, NehaNarwal and Mila Schultz [3] proposed Predicting Price
Changes in Ethereum. In their work they conclude “The market capitalization of publicly traded
crypto currencies is currently above $230 billion. Bitcoin, the most valuable crypto currency,
serves primarily as a digital store of value, and its price predictability has been well-studied.
Volume 17, Issue 1, January - 2021 https://shjtdxxb-e.cn/ Page No: 49Journal of Shanghai Jiaotong University ISSN: 1007-1172
However, Ethereum has the second-highest market capitalization and supports much more
functionality than Bitcoin. While its price predictability is sparsely covered in published
literature, the technology’s additional functionality may cause Ether’s price predictability to differ
significantly from that of Bitcoin. These characteristics are outlined in the following subsection;
the underlying details of Bitcoin (Nakamoto, 2008) and Ethereum (Buterin, 2013) are elided, as
they are described in depth in the cited papers.”
1.2.2 DISADVANTAGES OF EXISTING SYSTEM
Often, existing system is statistical models and following are its disadvantages
● For some cases prediction accuracy tends to be low compared to neural networks model
particularly on this type of data.
● Model selection becomes nightmare and preprocessing has to be done iteratively to select
a model.
● A small percentage of error is directly going to hit short term trader badly and might
make audience to lose hope in forecasting.
1.3 PROPOSED SYSTEM
In the proposed system, GRU a variant of LSTM network architecture was used. GRU
architecture is relatively new and gaining a lot of momentum these days. GRU and LSTM both
are recent addition from the Recurrent Neural Network (RNN) family, the reason why RNN was
not used is because of the vanishing gradient and exploding gradient problem. Both the models
mentioned above overcome this problem by having gating mechanism. LSTM has three gates
which are Input, Forget and Output. GRU is slightly different from LSTM by having only two
gates which are reset and update gate. The gating system is the thing that enables LSTMs to
expressly show long haul conditions. By taking in the parameters for its memory state, the system
figures out how its memory ought to carry on. In theory LSTMs ought to recall longer groupings
than GRUs and beat them in assignments requiring demonstrating long-distance relations.
Although GRU is relatively new compared to LSTM it is equally on par with LSTM in
terms of accuracy and is much more efficient in terms of computation. Also GRU works better
when you have less data points to train specifically on language modelling. GRU uncovers the
Volume 17, Issue 1, January - 2021 https://shjtdxxb-e.cn/ Page No: 50Journal of Shanghai Jiaotong University ISSN: 1007-1172
entire memory unlike LSTM, so applications which that goes about as preferred standpoint may
be useful.
1.3.1 ADVANTAGES OF PROPOSED SYSTEM
Proposed system here is Gated Recurrent Unit and following are the advantages of the
proposed system
● No tidy model selection is needed while using LSTM or GRU but basic data preprocessing is
required.
● In this solution, the predictions tend to be accurate and model adapts quickly to the unseen
trends and recent happening.
● A better prediction with confidence level would enable traders to have an idea of how market
would behave at any given point, but the very recent predictions would be accurate.
● Early recommendation for short term traders and as an early financial distress warning for
long term investors.
CHAPTER 2
2.1 PROBLEM DEFINITION
Crypto market has not always been good to everyone. A lot of people had lost their
money in a very short period of time and only a very few had made big money. This is because
there is no governing body or regulating body, so a trader might lose money within a very short
span of time.
Think if a trader could get a sense of what the market could be like in the coming days.
This insight could really help any trader while trading without much of a loss. Right now anyone
who wants to trade rely on technical analysis i.e. price trends or fundamental analysis to buy or to
hold a stock while trading and statistical prediction models. Predictions using statistical model are
good but not great enough to handle the volatile price index particularly in remembering
information from long past. Although there are plenty of statistical models to approach this sort of
issues, deep learning (CNN, RNN, LSTM and GRU are different types of deep learning
architectures) technique seems promising because of the exponential number of parameters it has.
To handle remembering informations from the past we use Gated Recurrent Unit neural
networks which is a successor to another popular architecture called LSTM. GRU was chosen
over LSTM in this project since it is easier to train and has the same accuracy as the latter.
Volume 17, Issue 1, January - 2021 https://shjtdxxb-e.cn/ Page No: 51Journal of Shanghai Jiaotong University ISSN: 1007-1172
2.2 METHODOLOGY
There are four modules in this project, namely Extract training data from Exchange,
Preprocess data, Model Prediction, Visualize prediction to User. In Data Extraction module, data
is extracted
ed from the Crypto trading exchange (CoinMarketCap), data from response is saved in a
csv file and is used for further processing. In Preprocessing of data outliers are treated, missing
values are treated, scaling of data is done, features for training the model is selected and finally
trained model is saved. In Model Prediction with the trained model prediction is done for the
subsequent time steps. Visualize the Prediction to User, in this process predictions from the
model is pushed into a dashboard so tthat a non-technical
technical person can get insight from the
predictions. Hierarchical diagram of the system is shown in Figure 2.1.
Figure 2.1 Hierarchical diagram of the system.
Volume 17, Issue 1, January - 2021 https://shjtdxxb-e.cn/ Page No: 52Journal of Shanghai Jiaotong University ISSN: 1007-1172
CHAPTER 3
DEVELOPMENT PROCESS
3.1 REQUIREMENT ANALYSIS
The input requirements, output requirements and Resource requirements. They are as
follows.
3.1.1 INPUT REQUIREMENTS
Data for the model is extracted from the crypto currency website called CoinMarketCap
so that the model is trained, tested, validated and plotted in dashboard for user.
3.1.2 OUTPUT REQUIREMENTS
Output is displayed in a dashboard. The output requirements of this project is data has to
scaled, once the model is trained to predict the future prices with highest accuracy then prediction
is made and displayed in a dashboard with history prices along with the predicted prices.
3.1.3 RESOURCE REQUIREMENTS
The hardware and software requirements for this system were analyzed and the required
configuration is as given below. The following are the software and hardware requirements for
the project.
HARDWARE REQUIREMENTS
● CPU : i5 with 2.4 Ghz and above
● RAM : 8 GB and above
● GPU : 2 GB DDR5
● HDD : 500GB and above
Volume 17, Issue 1, January - 2021 https://shjtdxxb-e.cn/ Page No: 53Journal of Shanghai Jiaotong University ISSN: 1007-1172
SOFTWARE REQUIREMENTS
● Operating system : GNU Linux
● DL Framework : Tensorflow
● Front End : Power BI
● IDE : Jupyter-Notebook
Notebook
● Programming Language : Python
3.2 DESIGN
3.2.1 ARCHITECTURAL DESIGN
This architecture will give explanations about the entire concept about the project. This
defines the structure of the developed system, which comprises different modules and their
externally visible properties and the relationship among them. Overall architecture diagram for
the entire system is shown in Figure 3.1.
Figure 3.1 Overall Architecture Diagram
Volume 17, Issue 1, January - 2021 https://shjtdxxb-e.cn/ Page No: 54Journal of Shanghai Jiaotong University ISSN: 1007-1172
3.2.2 ARCHITECTURE OF GATED RECURRENT UNIT
Gated Recurrent Unit has two gates namely Update gate and Reset gate. Update gate is
responsible for the information which are to be maintained in the cell memory state. Cell memory
state is the neuron (matrix representation) which keeps track of all the informa
information
tion which has
happened over the past. Reset gate which takes care of what information which needs to be
deleted from the cell memory state. Architecture diagram of Gated Recurrent Unit is shown in
Figure 3.2.
Figure 3.2 Architecture Diagram for Gated Recurrent Unit
3.2.3 DETAILED DESIGN
The detailed design explains each and every module in detail.
● Extract data from Exchange
● Data Preprocessing
● Model Prediction
● Prediction Visualization
3.3.10 Extract data from Exchange:
For the model to be trained for prediction we would need historical data of Ether, with
which a model can train a model and predict future prices. Once the data is extracted from the
Volume 17, Issue 1, January - 2021 https://shjtdxxb-e.cn/ Page No: 55Journal of Shanghai Jiaotong University ISSN: 1007-1172
exchange data collection is done. After the data has been extracted it is saved in a comma
separated file so that the data request is not sent again.
In this Data extraction module
module,, the data for the model is scrapped using python and the
return response is saved in a file so that it can be preprocessed and further processed for
f model
training. Data flow diagram for Data extraction process is shown in Figure 3.3.
Figure 3.3 Data flow Diagram for Data Extraction
3.3.11 Data Preprocessing:
Once the data is extracted, it has to be cleaned in order to feed that in to a machine
learning algorithm. Because data might contain missing values, data discrepancy and may also
contain outliers. Most of the machine learning models are sensitive to outli
outliers
ers so it has to be
treated properly.
For example, when there is missing values it has to be treated using smoothing
techniques likes Kalman filtering or moving average techniques. Outliers could also be treated
using the same technique mentioned above. MinMax Scalar is used for data scaling.In this Data
preprocessing module,, the user has to clean the data.
3.3.12 Model Prediction:
Model trained with historical data is used to predict the prices of the future. This
proposed GRU models achieves better accuracy. The Model building phase is followed by data
preprocessing. Selected feature after being scaled is fed into consecutive GRU cells to learn
Volume 17, Issue 1, January - 2021 https://shjtdxxb-e.cn/ Page No: 56Journal of Shanghai Jiaotong University ISSN: 1007-1172
dependency and patterns. These GRU models remembers pattern long term without any
discrepancy
iscrepancy and also uses the intelligence in predicting the future prices with good accuracy.
Once the model is trained it is evaluated with respect the data we have as test set. The best model
with highest accuracy is finalized and the model weights are ssaved
aved so that it can be loaded again
to predict future prices. The user can predict values using the saved model.
In this Model Prediction module
module,, the user is able to predict the values from the finalized
model. With the model being saved, user can use it for prediction at any point of time. Data flow
diagram for Model Prediction is shown in Figure 3.4.
Figure 3.4 Data Flow Diagram for Model Prediction
3.3.13 Prediction Visualization:
Once the prediction is made by the model, the values are temporarily saved in a comma
separated file (csv) also the historical ether prices are also saved in csv. Dashboard is created so
that the predictions can be shown in an easy manner that anyone can understand. A line plot with
two variable is used to plot the historic
historical prices of ether with two axis, x- axis being the date time
Volume 17, Issue 1, January - 2021 https://shjtdxxb-e.cn/ Page No: 57Journal of Shanghai Jiaotong University ISSN: 1007-1172
dimension and y- axis being the price dimension. The same is used for the price prediction plot as
well.
In this Prediction Visualization module
module,, one way to show the predicted prices from the
model is to sketch a dashboard with the predicted prices. Data flow diagram for Prediction
Visualization is shown below in Figure 3.5.
Figure 3.5 Data Flow Diagram for Prediction Visualization
3.3 IMPLEMENTATION
In this project there are four modules, namely Data Extraction, Data Preprocessing,
Model Prediction, and Prediction Visualization
Visualization. This project is implemented using Power BI as
the front end for Visualization and Python, Tensorflow for model building.
Volume 17, Issue 1, January - 2021 https://shjtdxxb-e.cn/ Page No: 58Journal of Shanghai Jiaotong University ISSN: 1007-1172
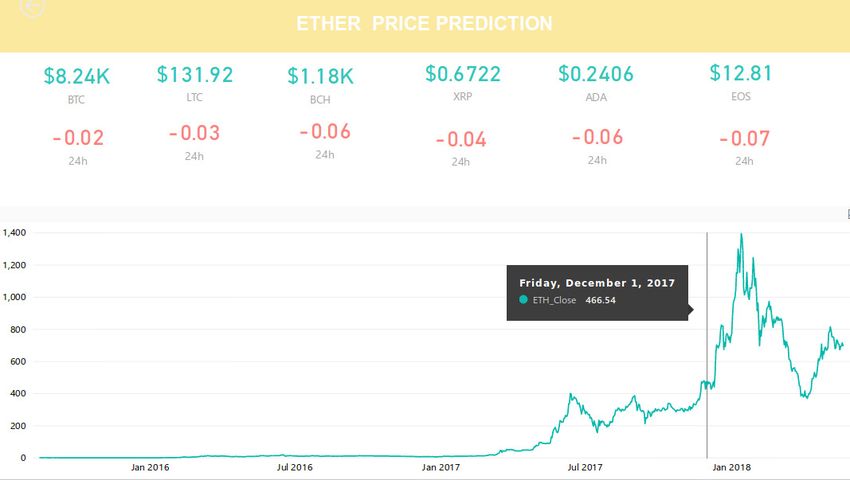
Figure.3.6 shows the price indicator for various crypto currency on a particular date. Figure 3.7
shows the historical price data of Ether.
Figure 3.6 Screenshot for various currency price indicator
Figure 3.7 Screenshot for history of Ether price in the Dashboard
Figure 3.8 shows the complete first page report of the Dashboard. Figure 3.9 shows the actual
prices of Ether in the test set
Volume 17, Issue 1, January - 2021 https://shjtdxxb-e.cn/ Page No: 59Journal of Shanghai Jiaotong University ISSN: 1007-1172
Figure 3.8 Screenshot for Complete first page of the Dashboard
Volume 17, Issue 1, January - 2021 https://shjtdxxb-e.cn/ Page No: 60Journal of Shanghai Jiaotong University ISSN: 1007-1172
Figure 3.9 Screenshot for Actual price of Ether from the test set.
Volume 17, Issue 1, January - 2021 https://shjtdxxb-e.cn/ Page No: 61Journal of Shanghai Jiaotong University ISSN: 1007-1172
Figure 3.10 shows the Predicted values of Ether price from the model. Figure 3.11 shows the
Actual vs. Predicted price of Ether.
Figure 3.10 Screenshot for Predicted values of Ether price.
Volume 17, Issue 1, January - 2021 https://shjtdxxb-e.cn/ Page No: 62Journal of Shanghai Jiaotong University ISSN: 1007-1172
Figure 3.11 Screenshot for Actual vs. Predicted price of Ether
Volume 17, Issue 1, January - 2021 https://shjtdxxb-e.cn/ Page No: 63Journal of Shanghai Jiaotong University ISSN: 1007-1172
CHAPTER 4
4.1 TESTING
Testing is usually performed for the following purposes:
● To improve quality
● For verification and validation
● For reliability estimation
Model Testing involves testing of the prediction accuracy of the model which was trained
using the training data. Only the hold out data is used for testing purposes. There are several
model evaluation techniques some of the commonly used ones are Root Mean Squared Error
(RMSE), Mean Absolute Percentage Error (MAPE). In this project RMSE was used.
CHAPTER 5
RESULT AND CONCLUSION
5.1 RESULTS
The result of the project titled “Ether price prediction using Gated Recurrent Unit” is
obtained as expected. This application is working successfully and the results are obtained by
implementing GRU Neural Networks. These method are mainly used to learn pattern from the
time series data and maintain information long term and use it for prediction. Figure 5.1 shows
Actual price vs. predicted price in the test set is shown below.
Volume 17, Issue 1, January - 2021 https://shjtdxxb-e.cn/ Page No: 64Journal of Shanghai Jiaotong University ISSN: 1007-1172
Figure 5.1 Screenshot for Price Prediction of Ether from the model.
5.2 CONCLUSION
The main objective of this project was to implement a Crypto currency price predictor
using Gated Recurrent Unit and to predict the future prices of Ether crypto currency. GRU (a
popular variant of RNN) here was demonstrated to handle the price volatility and gave some good
results in single time point prediction. Predictions were made for the entire test set.
5.3 FUTURE ENHANCEMENT
GRU (variant of RNN) was used to predict the prices in the future for Ether crypto
currency. In future this work can be extended by scaling training and test set separately. With this
approach there would not be any information leakage while training the model. Different
permutations of network could be built and could select one which gives better accuracy.
Volume 17, Issue 1, January - 2021 https://shjtdxxb-e.cn/ Page No: 65Journal of Shanghai Jiaotong University ISSN: 1007-1172
REFERENCES
[1] Kai Chen, Yi Zhou, Fangyan Dai
“A LSTM-based method for stock returns prediction” 2015 IEEE International Conference on Big
Data 2015
[2] Luca Di Persio, OleksandrHonchar
“Artificial Neural Networks Approach to the Forecast of Stock Market Price Movements”
International Journal of Economics and Management Systems 2016.
[3] Matthew Chen, NehaNarwal and Mila Schultz
“Predicting Price Changes in Ethereum” International Journal on Computer Science and
Engineering (IJCSE) ISSN : 0975-3397 Vol. 7 No.4 Apr 2015
[4] Dutta. A, Bandopadhyay. G and Sengupta. S
“Prediction of Stock Performance in the Indian Stock Market Using Logistic Regression”,
International Journal of Business and Information, 2012
[5] Kondratenko V.V and Yu. A Kuperin
“Using Recurrent Neural Networks to Forecasting of Forex”, Disordered Systems and Neural
Networks, 2003
Volume 17, Issue 1, January - 2021 https://shjtdxxb-e.cn/ Page No: 66You can also read


