Impact of Covid-19 on the South Australian economy and employment - 2020 to 2023
←
→
Page content transcription
If your browser does not render page correctly, please read the page content below
Impact of Covid-19 on the South Australian
                                                              economy and employment –
                                                                             2020 to 2023

Australian Industrial Transformation Institute in
collaboration with the National Institute for Economic
and Industry Research

April 2020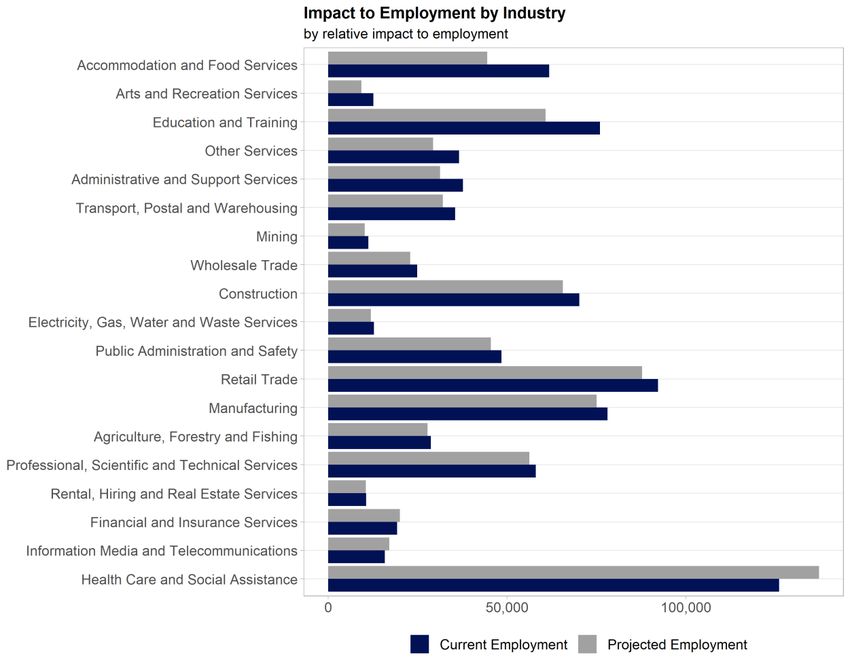
Impact of COVID-19 on the South
        Australian economy and
     employment – 2020 to 2023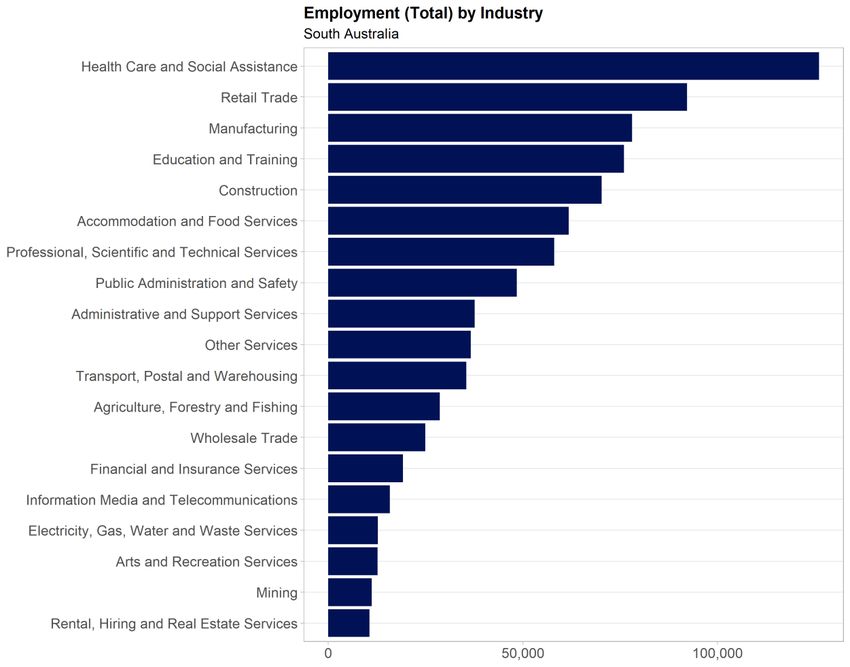
Australian Industrial Transformation Institute
College of Business, Government and Law
Flinders University of South Australia
1284 South Road
Clovelly Park
South Australia 5042

www.flinders.edu.au/aiti

URL:http://www.flinders.edu.au/aiti/

Suggested citation:

Spoehr, J. and Gamble, H. 2020. Impact of Covid-19 on the South Australian Economy and
Employment. Adelaide: Australian Industrial Transformation Institute, Flinders University of South
Australia.

The Australian Industrial Transformation Institute (AITI) has taken care to ensure the material
presented in this report is accurate and correct. However, AITI does not guarantee and accepts
no legal liability or responsibility connected to the use or interpretation of data or material
contained in this report.
Key Findings and Broad Policy Implications
The impact of preventative measures to stop the spread of the novel Coronavirus are having
significant negative impacts on economic activity and employment in South Australia. Mass
closures and very high unemployment have occurred in a very short perod of time. Past
experience tells us that the scale of the economic stimulus and recovery packages will have a
significant impact on the duration of the economic and jobs crisis.
    •   Gross State Product in South Australia will be 14.8 percent lower in the 2 nd quarter of
        2020 than it would be without the Coronavirus restrictions. This represents a 12.5 percent
        quarter over quarter reduction in South Australian Gross State Product.
    •   There will be a recovery in economic growth, but it will be slow; GSP will be 6.4 percent
        lower in the 2nd quarter of 2021 than otherwise expected.
    •   Significant negative GSP impacts will occur in the first and second quarter of 2020, with a
        reduction in Gross State Product of 1.9 percent in Q1 2020, and a further reduction of
        14.6 percent in Q2 2020. A recovery will occur between Q3 2020 and Q1 2021, with
        GSP growth of 3 percent, 4.6 percent, and 2.7 percent respectively, after which GSP
        growth will return to the relatively normal levels of around 0.5 percent.
    •   Compared to the baseline forecast, the total number of jobs impacted by the restrictions
        will reach 144,700 during the 2 nd quarter of 2020. This includes those retained on the
        JobKeeper scheme as unemployed. The trajectory of employment impact will be similar
        to that of the economic impact. Total employment is projected to decline by 72,000
        people in the second quarter of 2020, and will quickly rebound, growing by 14,700 in Q3,
        and 22,700 in Q4. Over the medium term, the employment impact of COVID-19 will be
        around 47,000 fewer jobs than otherwise.
    •   Unemployment will increase from the baseline of 52,000 in Q2 2020 to 117,600,
        remaining relatively high over the medium term. By the end of 2023, unemployment will
        still be 38,100 people more than if there was no Coronavirus. This implies a peak
        unemployment rate of about 13.3% in Q2 2020, with a slow decline; remaining above
        10% at the end of 2023.
    •   Interstate exports will fall by $1.4 billion (18% of the value of South Australia’s total
        domestic exports).
    •   Overseas exports will fall by $0.97 billion (23.5% of the value of South Australia’s total
        overseas exports).

COVID-19 and the measures necessary to tackle the crisis are having a profoundly negative
impact on the South Australian economy and employment. This will continue to be felt over the
next 4 years. Although a sharp decline and recovery is forecast between Q2 2020 and Q3 2020,
employment levels do not return to where they were. Indeed, the overall level of employment will
remain below the baseline measure, and below the level in Q1 2020 until at least 2024.
The additional income supplement provided to those on JobSeeker and the JobKeeper scheme
in its entirety are expected to last for 6 months. It is clear from this analysis that there will be a
need to support impacted workers and their families for longer than this. Equally, businesses,
public sector organisations and NGO’s will continue to be impacted over the medium term by the
economic fall-out from COVID-19.
Accelerating the recovery from the economic and employment impacts of COVID-19 will require
a commitment to sustained and smart investment in recovery. This could include a national
economic recovery and stimulus plan that breathes life back into the Australian economy through

                                                                                                     iii
                                                                                             AITI (2020)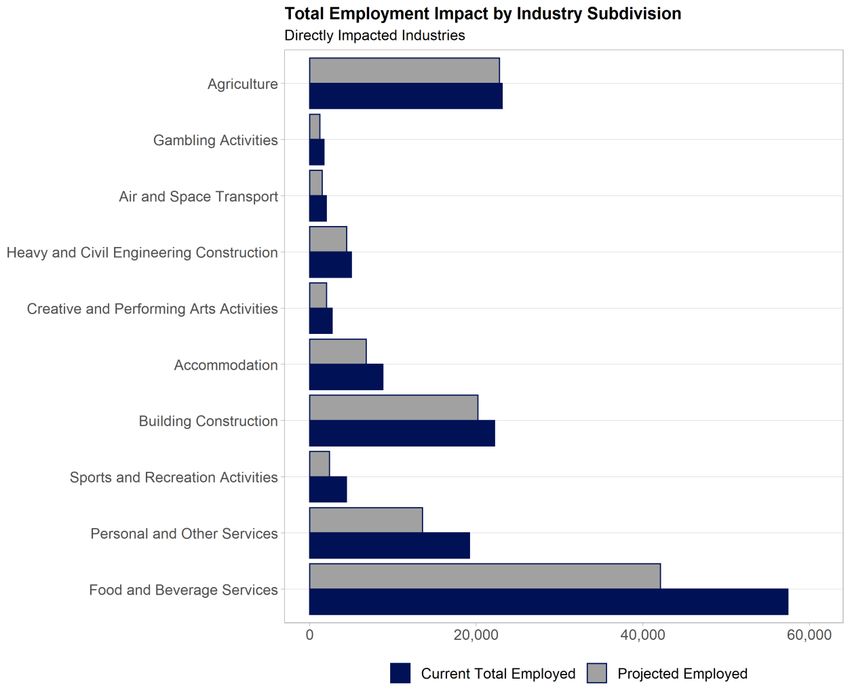
large scale investment in the modernisation of our physical and social infrastructure including
schools, hospitals, universities and TAFE, and digital infrastructure including fibre to the
premises. This is not only productivity enhancing but also one of the keys to the rapid growth of
rewarding jobs. Accompanying this should be a national industry modernisation program that
seeks to place South Australia and Australia at the forefront of the digital revolution and as one of
the leaders in tackling great challenges like COVID-19.
A South Australian Economic Recovery and Jobs Plan should seek to leverage Federal
Government investment in social and physical infrastructure projects. A central feature of the
plan might be an Industry Transformation and Modernisation program and network of ‘Industry
Catapults’ to accelerate industry and jobs growth and the uptake of advanced technologies,
platforms and skills. One centrepiece of the plan might be a ‘Manufacturing Recovery’ program to
diversify our manufacturing sector and strengthen supply chains capable of producing enough
equipment during crises like COVID-19.
Bold action and unprecedented investment by government has been necessary to tackle the
virus and support millions of Australians and businesses at this time of crisis. We now have an
unemployment crisis. Business as usual will not be sufficient to avoid this being a long and
protracted calamity for the State. High levels of public sector investment/stimulus will be
necessary to work our way through this over the next few years. With historically low interest
rates government has the ability to borrow very cheaply to help a finance the recovery program.

iv
AITI (2020)
Contents

KEY FINDINGS AND BROAD POLICY IMPLICATIONS ................................................................... III
1      INTRODUCTION ........................................................................................................................... 1
    1.1    CONTEXT ................................................................................................................................. 1
    1.2    NOVEL CORONAVIRUS .............................................................................................................. 1
    1.3    HISTORICAL DATA .................................................................................................................... 2
      1.3.1 Gross State Product ........................................................................................................... 2
      1.3.2 Employment ....................................................................................................................... 2
2      ECONOMIC IMPACT .................................................................................................................... 6
    2.1    GROSS STATE PRODUCT .......................................................................................................... 6
    2.2    EMPLOYMENT .......................................................................................................................... 8
      2.2.1 Employment by industry ..................................................................................................... 9
APPENDIX A: MODELLING ASSUMPTIONS ................................................................................... 16
APPENDIX B: INDUSTRY SUBDIVISION IMPACTS ........................................................................ 17

                                                           List of Figures

FIGURE 1: COVID-19 PREVENTION MEASURES ......................................................................... 1
FIGURE 2: GROSS STATE PRODUCT GROWTH (SOUTH AUSTRALIA) ........................................... 2
FIGURE 3: TOTAL EMPLOYMENT GROWTH (SOUTH AUSTRALIA).................................................. 3
FIGURE 4: UNDERUTILISATION, UNEMPLOYMENT AND UNDEREMPLOYMENT................................ 4
FIGURE 5: TOTAL EMPLOYMENT BY INDUSTRY (SOUTH AUSTRALIA) ............................................ 5
FIGURE 6: COVID-19 GSP ($M) IMPACT SOUTH AUSTRALIA...................................................... 7
FIGURE 7: COVID-19 GSP (%) IMPACT SOUTH AUSTRALIA ....................................................... 8
FIGURE 8: TOTAL EMPLOYMENT IMPACT (SOUTH AUSTRALIA) .................................................... 9
FIGURE 9: SHIFTS IN EMPLOYMENT BY INDUSTRY..................................................................... 10
FIGURE 10: EMPLOYMENT IMPACT IN DIRECTLY IMPACTED INDUSTRY SUBDIVISIONS ................ 11
FIGURE 11: NEGATIVE EMPLOYMENT IMPACT IN INDIRECTLY IMPACTED INDUSTRY SUBDIVISIONS
     (TOP 10) ........................................................................................................................ 12
FIGURE 12: POSITIVE EMPLOYMENT IMPACT IN INDIRECTLY IMPACTED INDUSTRY SUBDIVISIONS
     (TOP 10) ........................................................................................................................ 13
FIGURE 13: RELATIVE EMPLOYMENT IMPACT (INDUSTRY)......................................................... 14

                                                                                                                                                    v
                                                                                                                                        AITI (2020)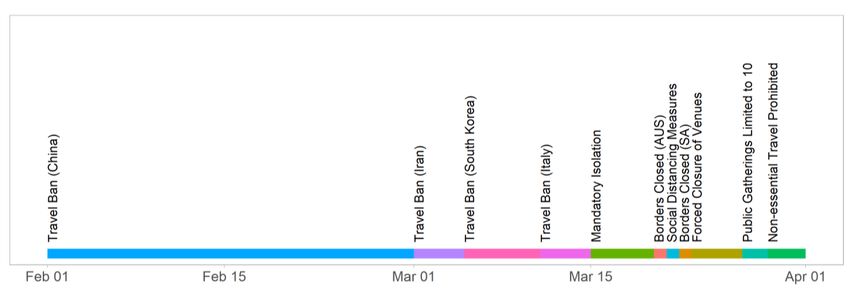
1 Introduction
1.1   Context
Actions necessary to contain the novel Coronavirus have resulted in a sharp decline in economic
activity and escalating unemployment in many nations. Early evidence gathered by the ABS has
provided a snapshot of sectoral job losses at the State and national level in Australia. This report
summarises modelling on the impact of the virus on the South Australian economy and
employment over the next few years. The modelling was undertaken by the National Institute of
Economic and Industry Research for the Australian Industrial Transformation Institute.
The economic shock to the South Australian economy from the pandemic is vastly different to
shocks experienced during the 1980s, 1990s and 2007-8. Given its origin and the different
approaches to tackling Coronavirus adopted by impacted nations, the trajectory of the current
crisis is difficult to predict. While easing of restrictions is likely over the short-term in some
jurisdictions where the virus has been contained and suppressed, international movement will be
severely limited until this is the norm. This will result in sustained negative impacts on
international trade in services like higher education and inbound tourism from overseas.
Past experience of economic crises tells us that the scale of the economic stimulus and recovery
packages will have a significant impact on the duration of the current recession and our ability to
bring down very high rates of unemployment through various measures.

1.2   Novel Coronavirus
As the novel Coronavirus spread across the globe, countries implemented various measures
aimed at reducing the local rate of infection. Australia and the South Australian government
moved early to implement these measures. A timeline of the measures introduced for South
Australia since the travel ban from China was announced on February 1st is shown below in
Figure 1.

Figure 1: COVID-19 Prevention Measures
These measures have impacted the economy primarily through a reduction in consumption. This
has propagated through the economy via a reduction in household and business spending –
either households are not spending because they are unable to, due to the closure of
businesses, or they are choosing to shop less. The impact on Government expenditure in South
Australia is predicted to be neutral, with increased health expenditure of $24m balanced by a

                                                                                                    1
                                                                                           AITI (2020)
reduction in expenditure on teachers’ wages, and tertiary education. There is also a reduction in
demand for South Australia’s interstate and overseas exports.

1.3     Historical Data
Before the crisis hit, the South Australian economy was underperforming relative to other States
and Territories, and the Australian economy as whole.

1.3.1    Gross State Product
Figure 2 below shows the annual growth in Gross State Product in South Australia since 1990.
The average growth over this period is about 2.0%. While this was exceeded in 2018, all other
years since 2008 have been below the long-term average. GSP growth in 2019 totalled about
1.6%. This compares to the national average of around 3.0%.

Figure 2: Gross State Product Growth (South Australia)

1.3.2    Employment
Total employment growth in South Australia has also lagged other regions. Figure 3 show total
employment growth across all industries in South Australia since 2010. Over the last 10 years,

2
AITI (2020)
employment has decreased over the year a total of three times and was trending negative again
for 2020.

Figure 3: Total Employment Growth (South Australia)

This has translated into a higher level of unemployment, underemployment, and underutilisation
in South Australia. As at February 2020, there are over 140,000 people in South Australia who
are underutilised – that is unable to find employment or unable to find enough hours. This is
made up of 88,000 people who are underemployed, and 52,500 people who are unemployed.
Figure 4 shows the 10-year trend of the level of underemployment, underemployment, and
underutilisation in South Australia. The gap between the underemployed and the unemployed
has been increasing during that period, and hence the number of people who find themselves
underutilised has also increased.

                                                                                                 3
                                                                                       AITI (2020)
Figure 4: Underutilisation, Unemployment and Underemployment The largest employing industries in South Australia are also those likely to be negatively impacted by the measures, including 2nd largest industry Retail Trade (88,700 people; 10.4%), 3rd largest Education and Training (77,260 people; 9.1%) and 6th largest Accommodation and Food Services (61,460 people; 7.2%), 4 AITI (2020)
Figure 5: Total employment by industry (South Australia)

                                                                    5
                                                           AITI (2020)
2 Economic Impact The economic impact of COVID-19 will propagate through the economy via a demand shock. That is consumption by households and businesses have been reduced. Interventionist policies by the state and federal governments are aiming to reduce the impact of this negative shock, through direct stimulus, wage subsidies, and increased social security payments. In this section we summarise the results of modelling undertaken for the Australian Industrial Transformation Institute by the National Institute of Economic and Industry Research. A detailed description of the modelling methodology is presented in Appendix A. 2.1 Gross State Product Some industry sectors face a direct reduction in consumption, through either a reduction in the number of customers willing to make purchases, or as government policy dictates. Those industries directly impacted include Accommodation, Food and Beverage Services, Air and Space Transport, Creative and Performing Arts, and Sports and Recreation Services. A direct impact on one industry is an indirect impact on another industry through a reduction in demand for intermediate inputs. The value of the direct shock to the South Australian economy total almost $5.1 billion. This flows through the economy to reduce Gross State Product by $2.9 billion, a reduction of 13.0%. The industries with the largest reduction in their contribution to Gross State Product are Professional, Scientific and Technical Services (-$475m; 47%), Food and Beverage Services (-$390m; 66%), and Preschool and School Education (-$345; 38.4%). Of these three industries, only Food and Beverage Services has been directly affected by the measures implemented, indicating the breadth and depth of the economic shock, and the size of the indirect impacts. The nadir for the level of Gross State Product and GSP growth will occur in Q2 2020. Sixteen of the 86 industries analysed are forecast to increase their contribution to South Australia’s Gross State Product, including Hospitals ($156m; 18%), Telecommunication Services ($1176, 39%), and Social Assistance Services ($101m; 19%). Food Retailing is also forecast to increase its contribution by $85m or 22%. Figure 6 and Figure 7 below show the impact to South Australia’s level of GSP and GSP growth over the next three years resulting from the COVID-19 economic shock. Despite a strong recovery in GSP growth between Q3 2020 and Q1 2021, the gap between the baseline Gross State Product and the projected is still prominent out to Q4 2023. 6 AITI (2020)
Figure 6: COVID-19 GSP ($m) Impact South Australia
7
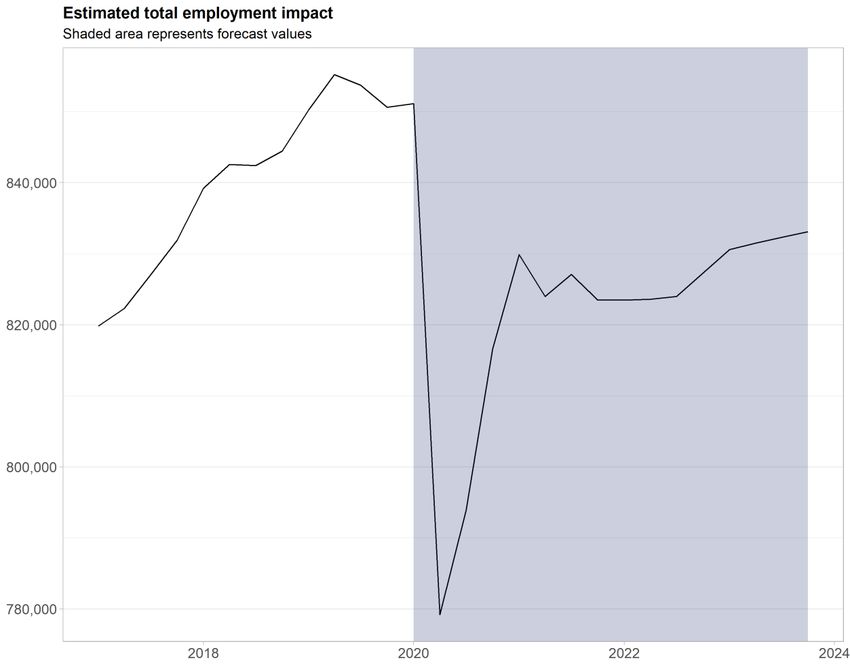
AITI (2020)Figure 7: COVID-19 GSP (%) Impact South Australia 2.2 Employment Overall, it is estimated that 61,000 people will lose their job in South Australia due to the Coronavirus, and the necessary measures put in place to reduce its spread. This modelling considers those covered by JobKeeper, but not working, as employed. The total number of jobs impacted may be as high as 110,000. There is a similar story with total employment as with the Gross State Product. Employment strongly rebounds in 2021, however the previous level of employment will not be returned till as far out as Q3 2024. This decline in employment will result in the unemployment rate increasing from a baseline of 5.8 percent in Q2 2020 to 13.3 percent. The high unemployment rate will continue out to Q4 2023, where it will reach 10.3%. 8 AITI (2020)
Figure 8: Total Employment Impact (South Australia)
2.2.1 Employment by industry
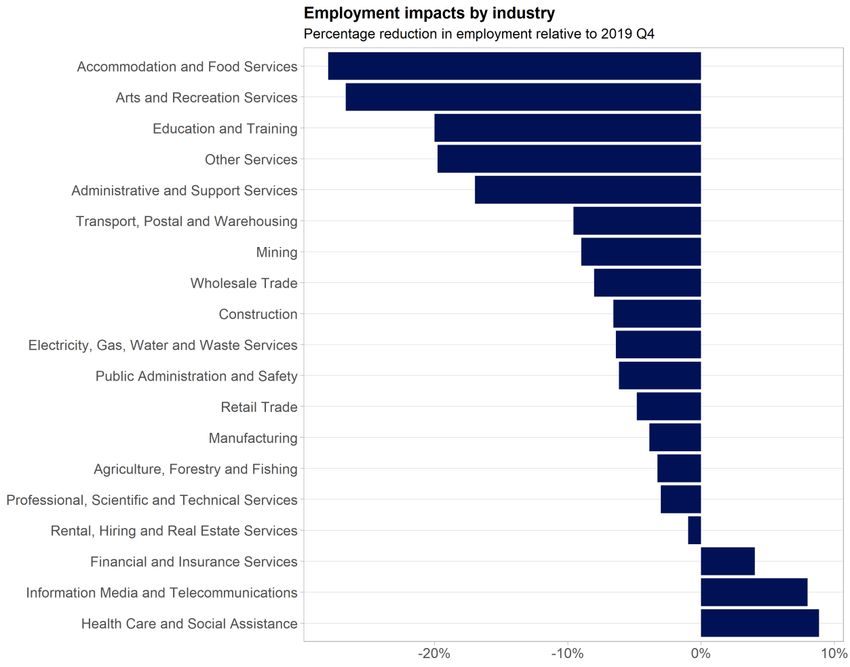
Most industries impacted will realise a contraction in the level of employment. Those with the
biggest negative impact are Accommodation and Food Services, and Education and Training.
On a per industry basis, the changes to the level of employment are shown below ranked by
relative percentage change and show the change in measured employment, that is the total
employment change, minus those whose jobs have been lost but positions have been retained
under the JobKeeper scheme. Figure 9 highlights the difference between current employment,
and projected employment. These changes are summarised below in Table 1. At the sub-division
industry level, there are some industries which are impacted directly such as Food and Beverage
Services, and other industries which are only impacted indirectly. The projected employment
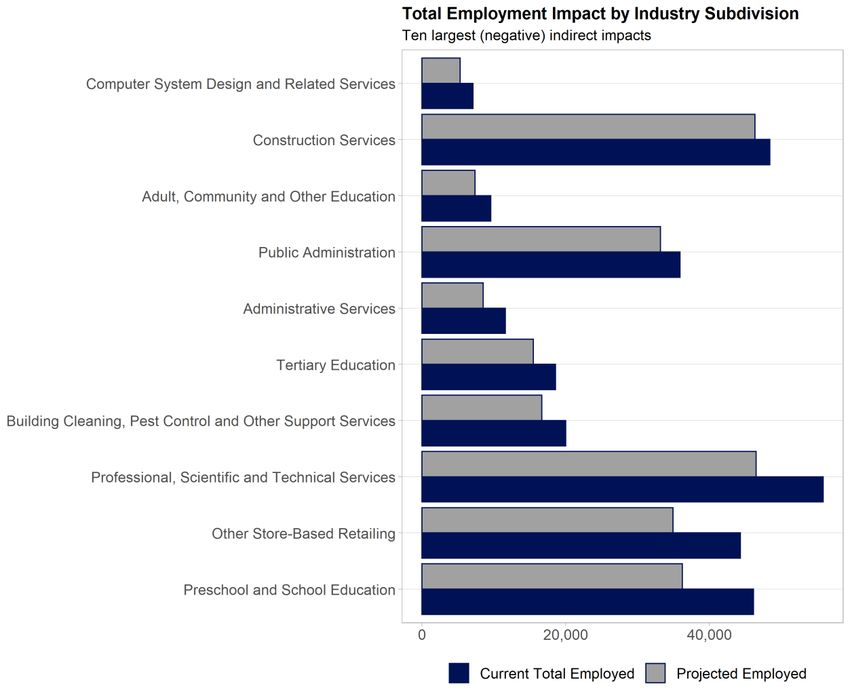
impact by industry subdivision for directly impacted industry subdivisions is shown in Figure 10.
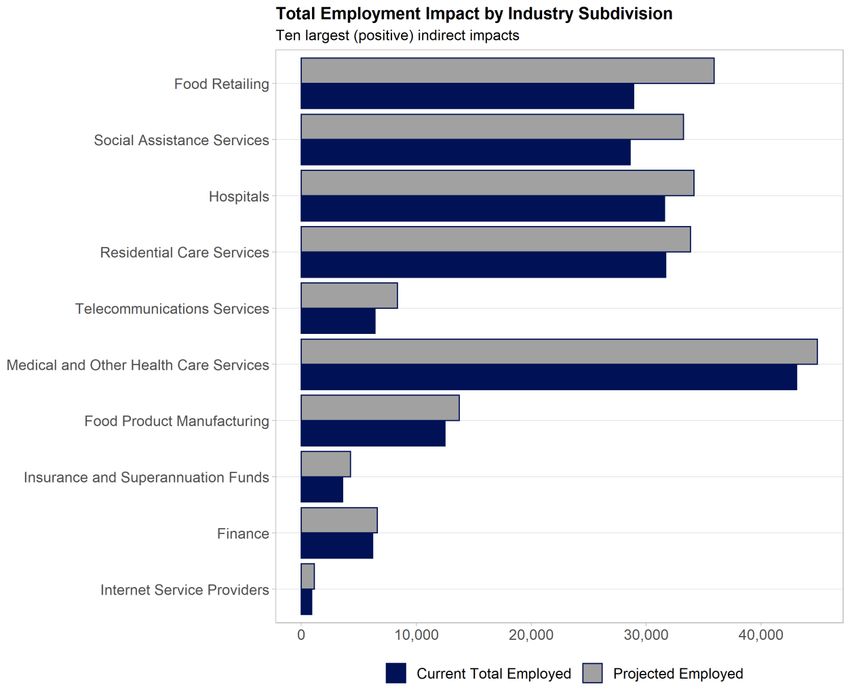
The largest negative impacts by industry subdivision are shown in Figure 11 and the largest
9
AITI (2020)positive impacts by industry subdivision are shown in Figure 12. A summary of all industry subdivision impacts is provided in Appendix B. Figure 9: Shifts in Employment by Industry 10 AITI (2020)
Figure 10: Employment Impact in Directly Impacted Industry Subdivisions

                                                                                 11
                                                                          AITI (2020)
Figure 11: Negative Employment Impact in Indirectly Impacted Industry Subdivisions (Top 10) 12 AITI (2020)
Figure 12: Positive Employment Impact in Indirectly Impacted Industry Subdivisions (Top 10)

                                                                                                     13
                                                                                              AITI (2020)
Figure 13: Relative Employment Impact (Industry) 14 AITI (2020)
Table 1: Employment Impacts
 Industry                                          Current Employment      Total Impact
 Accommodation and Food Services                                  61,754          -17,279
 Education and Training                                           75,951          -15,189
 Other Services                                                   36,612            -7,239
 Administrative and Support Services                              37,658            -6,392
 Construction                                                     70,206            -4,628
 Retail Trade                                                     92,191            -4,453
 Transport, Postal and Warehousing                                35,473            -3,399
 Arts and Recreation Services                                     12,682            -3,381
 Manufacturing                                                    78,063            -3,023
 Public Administration and Safety                                 48,426            -2,983
 Wholesale Trade                                                  24,925            -2,002
 Professional, Scientific and Technical Services                  58,028            -1,760
 Mining                                                           11,222            -1,009
 Agriculture, Forestry and Fishing                                28,701              -939
 Electricity, Gas, Water and Waste Services                       12,766              -816
 Rental, Hiring and Real Estate Services                          10,638              -103
 Financial and Insurance Services                                 19,241               776
 Information Media and Telecommunications                         15,842             1,267
 Health Care and Social Assistance                               126,027           11,141

                                                                                          15
                                                                                  AITI (2020)
Appendix A: Modelling Assumptions
Given the gross domestic product and gross state product outcomes, the parameters that will
determine the change in employment relative to change in gross product are:
• the elasticity of hours worked with respect to the real hourly wage, or the small business
employment generation potential parameter;
• the elasticity of hours worked with respect to change in industry gross product, or the
productivity suppression parameter; and
• the elasticity of employment with respect to changes in hours worked, or the job sharing
parameter.
SME employment generation potential
The hours worked-real wage elasticity measures the sensitivity of hours worked to real wages. A
value of 1.0 means a 1 per cent reduction in the real wage rate would result in a 1 per cent gain
in hours worked. If the parameter equals zero, there is no impact on hours worked. The
modelled parameter has been adjusted to consider the $20 billion investment by the
Commonwealth Government’s business income scheme, representing 8 percent of national
wage and salary costs. The program accordingly has the potential to offset at least some of the
direct impact of hours lost from the social distancing measures. Based on the historical data, an
elasticity of -0.6 is reasonable. However, with the introduction of the JobKeeper scheme,
businesses can continue paying employees who would otherwise be stood down. Since all
businesses are not eligible for this scheme, the value of the wage elasticity is assumed to be -0.1
The productivity suppression parameter
The value of the elasticity of hours worked with respect to the change in industry gross product
(or sales) determines the extent that a loss in sales is translated into a loss in measured hours of
work. A value of 0.0 for this parameter means that a loss of sales, no matter how large, does not
impact on the hours of work. Employees are simply transferred to other activities unconnected to
the support of current sales. A value of 1.0 means that the percentage fall in hours of work will
be the same as the fall in sales. With a value of 0.0, the impact of the decline in sales is
absorbed by a fall in productivity, whereas a value of 1.0 means that productivity is unaffected by
a fall in sales, and the full impact of a fall in sales is a fall in hours of work.
Most businesses are subject to short-run economies of scale, which means that productivity
increases when output expands and declines when output contracts. In part this is due to part of
the labour employed being assigned to overhead functions not related to short-run variations in
output. The JobKeeper payment scheme however allows for businesses to retain staff using
internal cash flow. Hence the value of this parameter is set at 0.9.
The job sharing parameter
The job sharing parameter is the elasticity of the change in employment with respect to change in
hours of work available. A value of 0.0 means that given the fall in hours of work available, the
hours of work are shared between existing employees, albeit at the same dollar per hour of work.
An elasticity value of 1.0 means that there is no job sharing.
The historical record suggests a value for this parameter in the vicinity of 0.75. However the
scale of the negative shock and the JobKeeper payment scheme significantly reduces the
incentive to job share. Hence, this parameter is set at 0.9 for the impact modelling.
16
AITI (2020)Appendix B: Industry Subdivision Impacts
Subdivision Impact on Current Projected
Employment Employment Employment
Food and Beverage Services -15,278 57,400 42,122
Preschool and School Education -9,880 46,100 36,220
Other Store-Based Retailing -9,376 44,300 34,925
Professional, Scientific and Technical -9,309 55,800 46,491
Services (Except Computer System
Design and Related Services)
Personal and Other Services -5,667 19,200 13,534
Building Cleaning, Pest Control and -3,325 20,000 16,675
Other Support Services
Tertiary Education -3,096 18,600 15,504
Administrative Services -3,067 11,600 8,533
Public Administration -2,718 35,900 33,183
Adult, Community and Other Education -2,213 9,600 7,387
Construction Services -2,079 48,400 46,321
Sports and Recreation Activities -2,028 4,400 2,372
Building Construction -2,006 22,200 20,194
Accommodation -2,001 8,800 6,799
Computer System Design and Related -1,760 7,100 5,340
Services
Road Transport -1,668 22,700 21,032
Motor Vehicle and Motor Vehicle Parts -1,612 9,900 8,288
Retailing
Repair and Maintenance -1,572 14,900 13,328
Transport Equipment Manufacturing -1,234 5,300 4,066
Basic Material Wholesaling -729 5,300 4,571
Beverage and Tobacco Product -683 6,400 5,717
Manufacturing
Creative and Performing Arts Activities -672 2,700 2,028
Primary Metal and Metal Product -625 5,400 4,775
Manufacturing
Metal Ore Mining -561 8,000 7,439
Heavy and Civil Engineering -544 5,000 4,457
Construction
Machinery and Equipment Wholesaling -541 7,700 7,159
Other Goods Wholesaling -515 1,400 885
Air and Space Transport -481 2,000 1,520
Fuel Retailing -468 4,100 3,632
Motion Picture and Sound Recording -463 3,600 3,137
Activities
Gambling Activities -460 1,700 1,240
Fabricated Metal Product -383 3,600 3,217
Manufacturing
Transport Support Services -355 4,000 3,645
17
AITI (2020)Subdivision Impact on Current Projected
Employment Employment Employment
Electricity Supply -334 5,400 5,066
Rail Transport -312 2,300 1,988
Auxiliary Finance and Insurance -305 6,900 6,595
Services
Agriculture -305 23,100 22,796
Wood Product Manufacturing -302 4,000 3,698
Warehousing and Storage Services -299 3,100 2,801
Defence -297 2,100 1,803
Motor Vehicle and Motor Vehicle Parts -291 1,300 1,009
Wholesaling
Furniture and Other Manufacturing -265 4,200 3,935
Waste Collection, Treatment and -247 2,900 2,653
Disposal Services
Printing (including the Reproduction of -238 3,600 3,362
Recorded Media)
Aquaculture -230 900 670
Rental and Hiring Services (except Real -226 1,700 1,475
Estate)
Heritage Activities -222 1,900 1,678
Non-Metallic Mineral Product -207 3,300 3,093
Manufacturing
Publishing (except Internet and Music -177 2,900 2,723
Publishing)
Water Supply, Sewerage and Drainage -170 2,900 2,730
Services
Textile, Leather, Clothing and Footwear -166 2,800 2,634
Manufacturing
Library and Other Information Services -157 1,800 1,643
Fishing, Hunting and Trapping -147 2,700 2,553
Exploration and Other Mining Support -145 1,000 855
Services
Agriculture, Forestry and Fishing -141 1,200 1,059
Support Services
Non-Store Retailing and Retail -126 1,000 875
Commission Based Buying
Forestry and Logging -117 1,000 883
Postal and Courier Pick-up and Delivery -107 4,600 4,493
Services
Pulp, Paper and Converted Paper -91 1,000 909
Product Manufacturing
Machinery and Equipment -79 6,700 6,621
Manufacturing
Polymer Product and Rubber Product -78 1,400 1,322
Manufacturing
Internet Publishing and Broadcasting 11 0 11
Public Order, Safety and Regulatory 31 12,000 12,031
Services
18
AITI (2020)Subdivision Impact on Current Projected
Employment Employment Employment
Property Operators and Real Estate 123 8,600 8,723
Services
Basic Chemical and Chemical Product 131 1,400 1,531
Manufacturing
Grocery, Liquor and Tobacco Product 153 5,700 5,853
Wholesaling
Internet Service Providers, Web Search 227 900 1,127
Portals and Data Processing Services
Finance 415 6,200 6,615
Insurance and Superannuation Funds 666 3,600 4,266
Food Product Manufacturing 1,233 12,500 13,733
Medical and Other Health Care Services 1,794 43,100 44,894
Telecommunications Services 1,963 6,400 8,363
Residential Care Services 2,147 31,700 33,847
Hospitals 2,550 31,600 34,150
Social Assistance Services 4,650 28,600 33,250
Food Retailing 7,003 28,900 35,903
19
AITI (2020)Australian Industrial Transformation Institute College of Business, Government and Law Flinders University GPO Box 2100 Adelaide SA 5001 P: 08 8201 5083 E: aiti@flinders.edu.au
You can also read