TRAFFIC IMPACT ASSESSMENT - FOR A PROPOSED LIQUID NATURAL GAS POWER STATION IN ZONE 10 (NORTH) OF THE COEGA SPECIAL ECONOMIC ZONE - SRK Consulting
←
→
Page content transcription
If your browser does not render page correctly, please read the page content below
TRAFFIC IMPACT ASSESSMENT

                                 FOR A
     PROPOSED LIQUID NATURAL GAS POWER STATION
IN ZONE 10 (NORTH) OF THE COEGA SPECIAL ECONOMIC ZONE

                               January 2021

            Prepared for: SRK Consulting (South Africa) Pty Ltd
                                   Obo
                      Coega Development Corporation

           Prepared by: Engineering Advice and Services (Pty) Ltd
                               (041) 5812421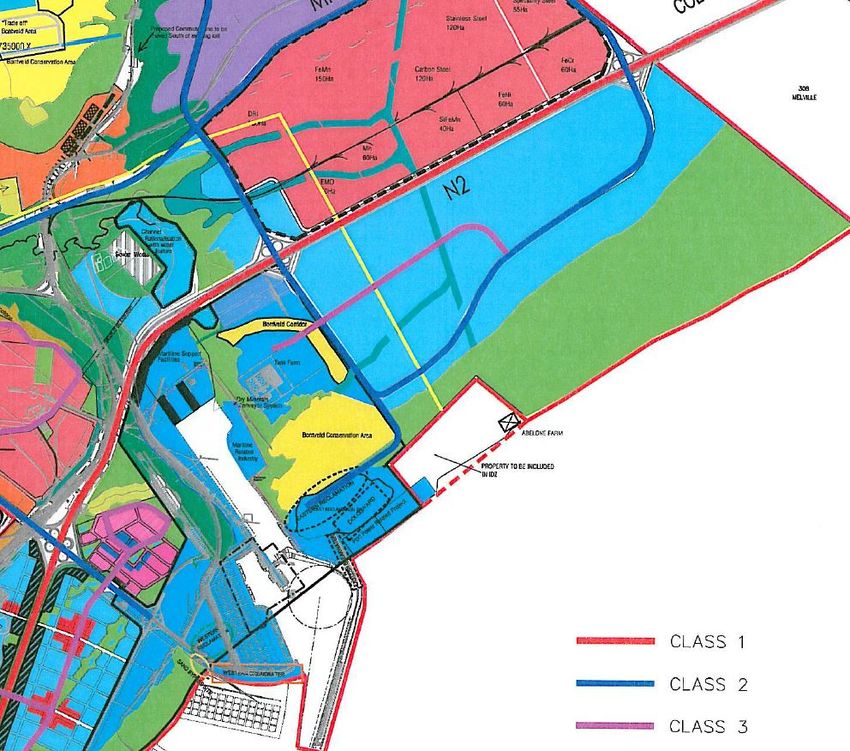
i                                  Traffic Impact Assessment

                                              DOCUMENT CONTROL SHEET

CLIENT REF:                         SRK CONSULTING (SOUTH AFRICA) PTY LTD

PROJECT NAME:                       PROPOSED LIQUID NATURAL GAS POWER               STATION IN ZONE 10 (NORTH) OF
                                    THE COEGA SPECIAL ECONOMIC ZONE

DOCUMENT TITLE:                     TRAFFIC IMPACT ASSESSMENT

DOCUMENT FILE REF:                  F:\1700-1799\1768\Reports\Zone 10 North - Power Plant\REP001 - TIA for CDC Gas to Power
                                    Project - Zone 10 North Plant.docx

   Version                      1
                                JK Charlton
   Compiled by                                                                 June/July 2020
                                Cand Eng Technologist (201580304)
                                CGA Hastie Pr Tech. Eng
   Reviewed by                                                                   August 2020
                                (200070122)

   Amendments made by

   Version                      Final Draft
                                MT Simon
                                Cand Eng Technician (2019701273)
   Compiled by                  JK Charlton                                     January 2021
                                Cand Eng Technologist (201580304)
                                CGA Hastie Pr Tech. Eng
   Reviewed by                                                                  January 2021
                                (200070122)
   Amendments made by

DISTRIBUTION:             1) Original :          Client – SRK Consulting – Ms A van Nierop
                          2) Copy         :
                          3) Copy         :      EAS File 1768

PREPARED BY:               Engineering Advice and Services (Pty) Ltd
                           P O Box 13867
                           HUMEWOOD
                           6013

Telephone:                 041 581 2421
Email:                     caryh@easpe.co.za

This Report has been prepared by Engineering Advice and Services, with all reasonable skill, care and diligence
within the terms of the contract with the client, incorporating our standard terms and conditions of business and
taking into account the resources devoted to it by agreement with the client. EAS disclaims any responsibility to
the client and others in respect of any matters outside of the scope of the above.
This report is exclusive to the client and the described project. EAS accepts no responsibility of whatsoever nature
to third parties to whom this Report, or any part thereof, is made known. Any such persons or parties rely on the
report at their own risk.

REP001 – Proposed LNG Power Plant – Coega SEZ Zone 10 (North)                                                 January 2021
ii   Traffic Impact Assessment

                                                      CONTENTS

                                                                                        Page
Document Control Sheet                                                                       i
Contents                                                                                    ii
List of Tables                                                                             iii
List of Figures                                                                            iii
List of Annexures                                                                          iii
Abbreviations                                                                              iv
1     Introduction                                                                          1
1.1   Background                                                                            1
1.2   Objectives of the Study                                                               1
1.3   Methodology                                                                           1
1.4   Study Area                                                                            1
1.5   Assumptions and Limitations                                                           2
2     Land Use Rights, Development and Environs                                             4
2.1   Site Location                                                                         4
2.2   Land Use Rights                                                                       4
2.3   Development Environs                                                                  4
2.4   Proposed Development                                                                  4
3     Data Collection                                                                       5
3.1   Peak Hour Traffic Volumes                                                             5
3.2   Historical Daily Traffic Volumes                                                      5
3.3   Projected Peak Hour Volumes                                                           7
3.4   Road Network                                                                          8
3.5   Public Transport                                                                     10
4     Trip Generation and Distribution                                                     11
4.1   Trip Generation                                                                      11
4.2   Trip Distribution                                                                    14
5     Proposed Access Arrangements                                                         20
6     Capacity Analysis                                                                    22
6.1   Intersection Capacity                                                                22
6.2   Link Capacity                                                                        24
7     Pedestrian, Parking and Loading Requirements                                         25
7.1   Parking Requirements                                                                 25
7.2   Pedestrian Arrangements                                                              25
7.3   Loading Requirements                                                                 25
8     Potential Impacts                                                                    26
8.1   Impacts                                                                              26
8.2   Impact Assessment                                                                    26
9     Proposed Mitigatory Measures                                                         29
9.1   Road Capacity Measures                                                               29
9.2   Pavement Loading Measures                                                            29
9.3   Traffic Safety Measures                                                              29
10    Management Actions                                                                   29
11    Conclusions                                                                          30
12    Recommendations                                                                      30
13    References                                                                           31

REP001 – Proposed LNG Power Plant – Coega SEZ Zone 10 (North)                   January 2021
iii                            Traffic Impact Assessment

                                                   LIST OF TABLES

Table 1: Peak Hour Vehicle Trips – Construction Workforce                                                        11
Table 2: Vehicle Trips – Operational Workforce                                                                   12
Table 3: Summary of Generated Trips                                                                              13
Table 4: Level of Service definitions for Vehicles (Highway Capacity Manual (8) method)                          22
Table 5: Results of Intersection Capacity Analysis – 2020 Existing                                               22
Table 6: Results of Intersection Capacity Analysis – 2020 - Construction                                         23
Table 7: Results of Intersection Capacity Analysis - 2030                                                        23
Table 8: V/C and Estimated Corresponding LOS with Qualitative Description of LOS                                 24
Table 9: V/C and Estimated Corresponding LOS for Full SEZ Development - 2030                                     24
Table 10: Significance rating for specific impact (Example: Additional Lane capacity at access)                  26
Table 11: Significance rating: Additional traffic volumes                                                        27
Table 12: Significance rating: Additional Axle Loading                                                           27
Table 13: Significance rating: Traffic Safety Impact due to high-speed traffic                                   27
Table 14: Significance rating: Road and Intersection capacity (additional traffic loading)                       28
Table 15: Significance rating: Traffic Safety Impact due to additional traffic                                   28
Table 16: Significance rating: Road and Intersection capacity (additional traffic loading)                       28
Table 17: Significance rating: Traffic Safety Impact due to additional traffic                                   28

                                                  LIST OF FIGURES

Figure 1: Locality Plan                                                                                           3
Figure 2: Process from Ship to Power Plant                                                                        5
Figure 3: Existing 2020 Peak Hour Volumes                                                                         6
Figure 4: Projected AM Peak Hour Volumes 2030                                                                     7
Figure 5: Existing Road and Access Configuration                                                                  9
Figure 6: Proposed Road Layout – Zones 7 and 10                                                                  10
Figure 7: Generated Peak Hour Traffic Volumes - Construction                                                     15
Figure 8: Generated Peak Hour Traffic Volumes - Operation                                                        16
Figure 9: Latent Peak Hour Traffic Volumes – Tank Farm & OTGC                                                    17
Figure 10: Peak Hour Traffic Volumes after Development - 2020 (Construction)                                     18
Figure 11: Peak Hour Traffic Volumes after Development - 2030 (Operation of All Plants)                          19
Figure 12: Proposed Access Arrangements and Site Layout                                                          21

                                                LIST OF ANNEXURES

ANNEXURE A Land Use Approvals
ANNEXURE B Peak Hour Traffic Volumes
ANNEXURE C Historical Daily Traffic Volumes
ANNEXURE D Employment and Person Trips Expected per Development Scenario
ANNEXURE E 2030 Link Peak Hour Traffic Volumes
ANNEXURE F SIDRA Output Sheets – 2020 Existing
ANNEXURE G SIDRA Output Sheets – 2020 Construction
ANNEXURE H SIDRA Output Sheets – 2030 Operations Combined
ANNEXURE I Impact Rating Methodology
ANNEXURE J Impact Significance Ratings

REP001 – Proposed LNG Power Plant – Coega SEZ Zone 10 (North)                                         January 2021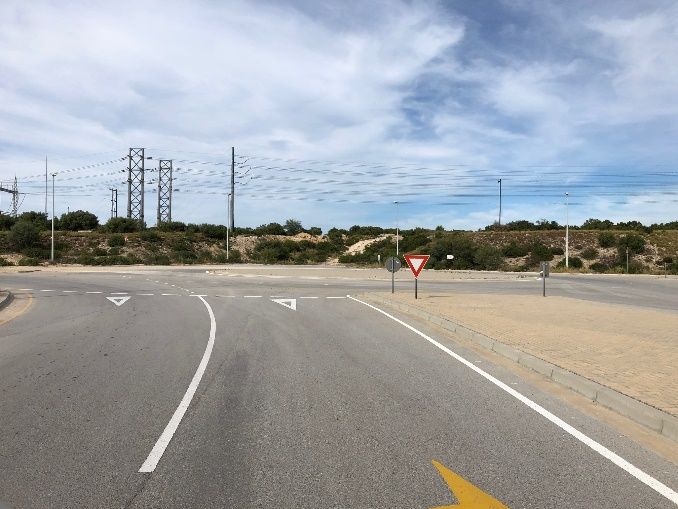
iv                    Traffic Impact Assessment

                                                   ABBREVIATIONS

CBD                        Central Business District
CDA                        Core Development Area
CDC                        Coega Development Corporation
DEA                        Department of Environmental Affairs
EAS                        Engineering Advice & Services (Pty) Ltd
ECDoT                      Eastern Cape Province Department of Transport
FSRU                       Floating Storage Gasification Unit
I/C                        Interchange
IDZ                        Industrial Development Zone
Km/h                       kilometres per hour
LNG                        Liquified Natural Gas
LOS                        Level of Service
NMBM                       Nelson Mandela Bay Municipality
SANRAL SOC                 South African National Roads Agency Limited
SARTSM                     South African Development Community Road Traffic Signs Manual
SEZ                        Special Economic Zone
SRK                        SRK Consulting (South Africa) (Pty) Ltd
TIA                        Traffic Impact Assessment
TMH                        Technical Methods for Highways
TRH                        Technical Recommendations for Highways
V/C                        Vehicle to Capacity ratio

REP001 – Proposed LNG Power Plant – Coega SEZ Zone 10 (North)                                    January 2021
1                             Traffic Impact Assessment

1     INTRODUCTION
1.1   BACKGROUND
      Engineering Advice & Services (Pty) Ltd was appointed by SRK Consulting (South Africa) Pty Ltd during
      February 2020 to conduct a traffic impact assessment for the proposed development of a LNG Power Facility
      in Zone 10 (North) of the Coega Special Economic Zone, situated just northwest of the Port of Ngqura in
      the Nelson Mandela Bay Municipality as indicated on Figure 1 overleaf.

1.2   OBJECTIVES OF THE STUDY
      In broad terms, the purpose of the traffic assessment is to determine the extent and nature of the traffic
      generated by the proposed development, assess the initial and cumulative impact of this traffic on operation
      of the associated road network in terms of capacity, and recommend measures to mitigate any problems
      identified. The following key elements, inter alia, are addressed in this traffic impact assessment:
      ▪     The suitability and safety of proposals for access to and egress from the site;
      ▪     The impact of construction and operational traffic on the capacity of the existing and future road
            network within the influence radius; and
      ▪     The road upgrading measures required to accommodate traffic generated by the proposed facility.
      In general, this report serves to satisfy the Department of Environmental Affairs and the South African
      National Roads Agency SOC Limited that the traffic impact of the envisaged facility is within acceptable
      limits and that any proposed road and the suggested access requirements and improvements conform to the
      standards and parameters set by these authorities.

1.3   METHODOLOGY
      The approach followed in conducting the traffic impact assessment was in accordance with the guidelines
      contained in TMH 16 Volume 1- South African Traffic Impact and Site Assessment Manual (1).

      Given the extent of the proposed development and in terms of the aforementioned guidelines, the expansion
      is considered to be a medium-sized development and this assessment thus considered impact for the
      development (assumed to be 2020) and development plus ten-year (2030) horizons.

      The methodology used was as follows:
      ▪     Present traffic flow patterns were obtained during typical weekday morning and afternoon peak periods
      ▪     The expected trips that will be generated by the proposed expansion were determined by using trip
            generation rates determined based on the projected staff complement on the facility and supplemented
            with the rates specified in TMH 17 Volume 1 - South African Trip Data Manual (2).
      ▪     The distribution of the generated trips was estimated where after the generated traffic was assigned to
            the surrounding road network.
      ▪     A suitable access location was determined in terms of TRH 26 South African Road Classification
            and Access Management Manual (3) and assessed from an operational and traffic safety perspective;
      ▪     The operation of affected junctions was analysed to ensure that they operate at acceptable levels of
            service and recommendations made on the need for road upgrading, taking cognisance of the proposed
            development for the 2020 and 2030 planning horizons; and
      ▪     Potential cumulative impacts were assessed in terms of operation, traffic safety and road condition for
            the construction and operational phases of all known power station facilities using the impact rating
            system described in Chapter 8.

1.4   STUDY AREA
      Based on the type and extent of the proposed facility and its location adjacent to a National Road (N2 Section
      11), the study area focussed on the Hougham Park interchange along the N2 and the roads from the
      interchange approaching the proposed site.
REP001 – Proposed LNG Power Plant – Coega SEZ Zone 10 (North)                                            January 2021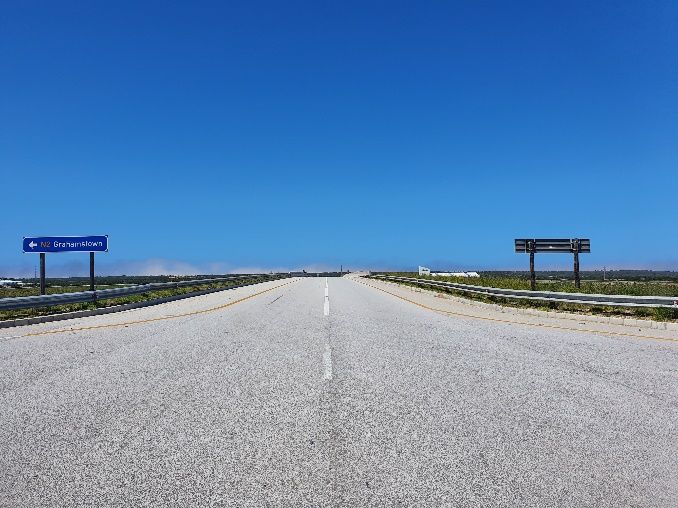
2                                      Traffic Impact Assessment

1.5   ASSUMPTIONS AND LIMITATIONS
      The scope of this TIA is limited to the project as described in Chapter 2.4 and as detailed in the Draft Scoping
      Report (4). The scope only deals with vehicular traffic related impacts and excludes consideration of the following:
      ▪     Source of gas;
      ▪     The transmission of gas via pipelines other than construction traffic related to implementation of such
            pipelines; and
      ▪     The provision of power to consumers from facilities to which gas is supplied.
      The report is based on a number of assumptions and is subject to certain limitations. These are as follows:
      ▪     That operational trip generation rates are based on information supplied by the prospective plant/facility
            operator;
      ▪     That vehicle occupancy rates for the purposes of determining operational trip generation rates for
            transport modes are based on average vehicle occupancies used for the NMBM Transport demand
            model;
      ▪     That construction trip generation rates are based on high level assessments of the proposed construction
            requirements for similar developments;
      ▪     That access and road upgrading proposals are conceptual at this stage and subject to detail designs being
            developed in the event of environmental authorization being granted;
      ▪     That the capacity analysis process is based on the highest peak hour traffic volumes of adjacent street
            traffic based on baseline traffic surveys undertaken for this project;
      ▪     That trip distribution is based on the location of the development relative to the surrounding residential
            areas; and
      ▪     That the roads constructed in the SEZ and on which traffic generated by the development travel have
            been constructed to accommodate traffic volumes over their projected design life and that such roads
            are operating well below their design traffic class.

      Notwithstanding these assumptions it is our view that this TIA provides a good description of the potential traffic issues
      associated with the proposed development.

REP001 – Proposed LNG Power Plant – Coega SEZ Zone 10 (North)                                                      January 2021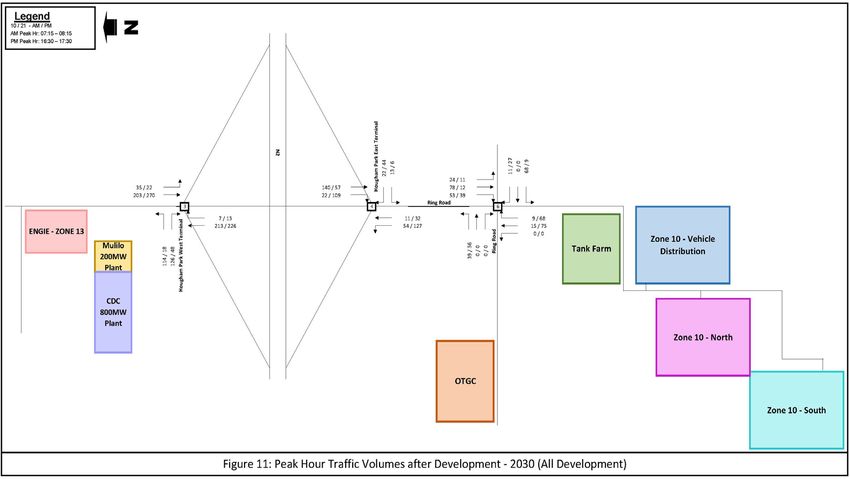
oad
                             w   nR
                         kno
                      Un

                                                             Rin
                                                                 g
                      R102

                                                                Ro
                                                                   a d
                                                                                                                N2

                       Coega

                                                                       Project Title:                                           Drawing No:                                            Meters

                                         ±
                                             Legend                                                                                                           0   180   360             720
                                                         Source: Esri,Traffic
                                                                       Maxar,     GeoEye,
                                                                              Impact          Earthstar
                                                                                     Assessment            Geographics,
                                                                                                for a Proposed                CNES/Airbus
                                                                                                               Liquid Natural Gas North   DS, USDA,    USGS, AeroGRID, IGN, and
                                                                                                                                              1768-P-001
Engineering Advice                               Site Boundary
   and Services
                                                         the GIS User Community
                                                                           Power Station in Zone 10 of Coega Special Economic Zone                                Scale 1 : 35 000

                                                                       Drawing Title:                                           Drawing Date:
                                                                                                                                                                    Prepared by : MS
Tel: (041) 581 2421
                                                                                          Figure 1: Locality Plan                               July 2020
                                                                                                                                                                    Checked by : CH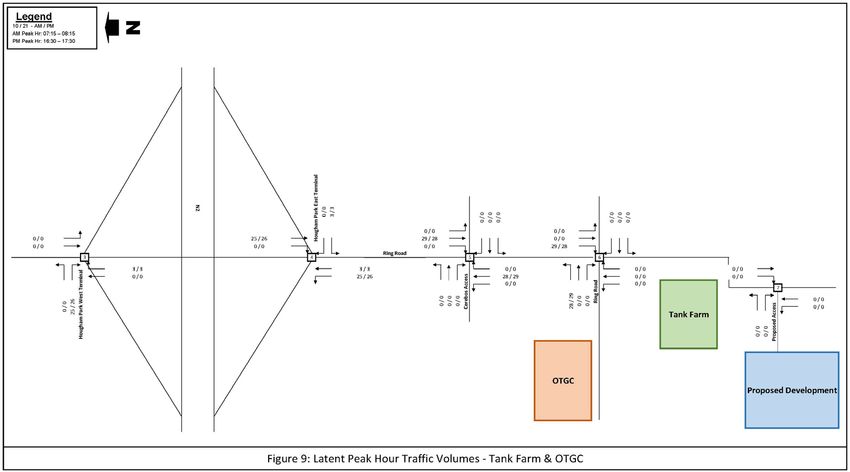
4                            Traffic Impact Assessment

2     LAND USE RIGHTS, DEVELOPMENT AND ENVIRONS
2.1   SITE LOCATION
      As indicated on Figure 2 overleaf, the proposed gas power plant is situated on erf 351, Coega to the
      northwest of the Port of Nqgurha and approximately 25km north of the Port Elizabeth CBD.

      The site is located in Zone 10 of the Coega Special Economic Zone and is surrounded by predominantly
      vacant land use in all directions.

2.2   LAND USE RIGHTS
      Erf 351, Coega is zoned for Special Zone (IDZ) purposes. Copies of the rezoning approvals are attached as
      Annexure A.

2.3   DEVELOPMENT ENVIRONS
      Much of Zones 7 and 10 are still undeveloped and are earmarked for light industrial uses, with the land to
      the northeast of the site along the coast earmarked for aquaculture purposes. Land immediately southwest of
      the power station facility forms part of the Port of Ngqurha.

      The proposed Transnet Tank Farm is situated in Zone 8 just northwest of the power plant with the site
      platforms currently nearing completion. The Cerebos Salt facility is situated in Zone 7 just west of the Ring
      Road.

2.4   PROPOSED DEVELOPMENT
      As specified in the Draft Scoping Report (4), the proposed power plant in Zone 10 will be one of three
      proposed power plants – two in Zone 10 and one in Zone 13. The plants will each have a generation capacity
      of 1000MW on a footprint of 7 – 10 ha. In addition, a Liquified Natural Gas terminal and distribution facility
      with a footprint of up to 23ha will also be constructed in Zone 10 allowing distribution to the market via
      LNG and gas pipeline and for third party customers via LNG trucks.

      Natural Gas will be pumped from the Port of Ngqurha to a storage and regassification facility, initially a
      Floating Storage Regassification Unit (FSRU) until an onshore regassification facility is constructed before
      being pumped to the power plant via pipeline.

      The Gas to Power plant will be constructed to the east of the existing power servitude which runs from the
      coast through to the zones north of the N2.

      Access to the plant will be gained from the Ring Road via the Hougham Park Interchange at Exit 770 on the
      N2.

      Figure 2 overleaf indicates the process conceptually from arrival by ship to the power plant.

REP001 – Proposed LNG Power Plant – Coega SEZ Zone 10 (North)                                           January 2021
5 Traffic Impact Assessment
▪
Figure 2: Process from Ship to Power Plant
3 DATA COLLECTION
3.1 PEAK HOUR TRAFFIC VOLUMES
Traffic turning movement counts were conducted at the following intersections during a typical weekday on
Tuesday 3 March 2020 from 06:00 to 18:00.
N2 Hougham Park Interchange West terminal
N2 Hougham Park Interchange East terminal
R102 / Ring Road
The detailed survey data is attached as Annexure B and summarised on Figure 3 below.
As is evident from the current traffic data, traffic volumes are very low, relative to the limited development
that has occurred in Zones 6, 7, 9 and 10.
3.2 HISTORICAL DAILY TRAFFIC VOLUMES
Historical daily traffic volume data at count station 1448 on the N2 just north of the St George’s Interchange
was sourced from SANRAL. The count information is attached as Annexure C.
The data indicates that between 2014 and 2019 ADT on the N2 increased at an average rate of 1.26% per
annum.
For the purposes of this study and to be conservative the peak hour volumes have been escalated by 2% per
annum.
REP001 – Proposed LNG Power Plant – Coega SEZ Zone 10 (North) January 20216 Traffic Impact Assessment
Figure 3: Existing 2020 Peak Hour Volumes
REP001 – Proposed LNG Power Plant – Coega SEZ Zone 10 (North) January 20207 Traffic Impact Assessment
3.3 PROJECTED PEAK HOUR VOLUMES
The Coega IDZ Transport Study (5) projected that Zones 7 and 10 would be fully developed by 2030
together with the rest of the IDZ (a theoretical exercise). In addition, Zone 8 - the port and back of port area
(east of the Coega River) would also be fully developed by 2030.
A total of 56 439 employment opportunities were projected in Zones 7 and 10, and a further 3896 in Zone
8, by 2030. This equates to approximately 45 152 and 2482 AM peak hour person trips in Zones 7 & 10 and
Zone 8 respectively as indicated in the schedule attached as Annexure D. These person trips were converted
to vehicle trips using vehicle occupancy rates for various transport modes.
Furthermore, a number of modal split scenarios were modelled for each development scenario in order to
assess a possible future shift from private to public transport modes in line with stated national government
policy. The main scenarios considered, in line with the NMMM Public Transport Plan, were the so-called
C3 and B2 scenarios. The B2 Scenario provides for a trunk bus network without rail while the C3 scenario
included a commuter rail service between the CBD and Motherwell as well as a loop through the Coega area.
Two sub-scenarios were assessed, namely a 60:40 and a 70:30 public/private modal split.
The scenarios that considered higher private transport trips were used to determine future road requirements
(60% public: 40% private transport).
The output of the transport demand modelling process resulted in projected link volumes for the 2020 and
2030 development scenarios as indicated on Figure 4 below. The detailed transport model outputs for each
B2 development scenario are attached as Annexure E.
It is important to note that the Coega IDZ Transport Study (5) makes provision for a second interchange
with the N2 situated on the eastern boundary of the SEZ. This interchange would however be constructed
dependent upon demand and should development in Zones 7 and 10 proceed as initially envisaged.
Figure 4: Projected AM Peak Hour Volumes 2030
REP001 – Proposed LNG Power Plant – Coega SEZ Zone 10 (North) January 20208 Traffic Impact Assessment
3.4 ROAD NETWORK
3.4.1 Existing Roads
The existing road and intersection configuration in the vicinity of the proposed development were obtained
from the various zone consultants with the permission of the Coega Development Corporation. As-built
information was provided in electronic CAD format. The primary road network can briefly be described as
follows:
▪ Ring Road 1 is classified as a class 2 arterial road
that will serve as one of the main access roads
between the N2 and IDZ Development Zones
south of the N2 and east of the Coega River
(Zones 7, 8 and 10). The road is currently
constructed as a single carriageway with one 3.7m
traffic lane and a 0.5m shoulder per direction. On
the approach to the traffic circle in Zone 10, the
road widens to a dual carriageway with two lanes
per direction separated by a 7.5m wide median.
The circle is configured with two 6.6m wide
circulating lanes to accommodate long trucks. Ring Road 1 SB into Zone 10
▪ On the bridge over the N2, the shoulders are 1.8m
wide.
▪ National Route 2 is a class 1 national trunk road.
In the vicinity of the proposed development the
N2 is a freeway with two 3.5m wide traffic lanes,
a 3m left shoulder and 1.5m right shoulder on each
carriageway.
The existing road and intersection configuration within
the vicinity of the proposed power plant is indicated on
Figure 5 overleaf.
Ring Road 1 across the N2
Note that the road classification described above is as per TRH 26 South African Road Classification and
Access Management Manual (3).
REP001 – Proposed LNG Power Plant – Coega SEZ Zone 10 (North) January 202010 Traffic Impact Assessment
3.4.2 Future Roads
The future road network serving Zones 7, 8 and 10 was determined in the Coega IDZ Transport Study
Demand Modelling Report (5) and is indicated conceptually on an extract of the layout in Figure 6 below.
Ring Road 1 which extends from the Hougham Park Interchange through Zones 7 and 10 to the future
interchange on the SEZ boundary is a class 2 road which can accommodate 1000 vehicles per hour per lane.
Currently the existing portion of the road is constructed as a single lane per direction but can be upgraded to
two lanes per direction should demand require so. Initial projections indicate that two lanes per direction
would be required by full development of the SEZ.
Figure 6: Proposed Road Layout – Zones 7 and 10
3.5 PUBLIC TRANSPORT
Provision was made for two public/private transport modal split scenarios in the Coega IDZ Transport Study
(5)
. The Public Transport Plan (6) component of the study assessed the future public transport requirements
but due to the long-term nature of the development in these zones did not address the detailed location of
public transport interchanges serving Zones 7 and 10.
In the short term however, until critical mass is reached in terms of employees that would make use of public
transport services, it is likely that public transport services would be on a contract basis between the plant
operator and the relevant service provider as is the case at present.
REP001 – Proposed LNG Power Plant – Coega SEZ Zone 10 (North) January 202011 Traffic Impact Assessment
4 TRIP GENERATION AND DISTRIBUTION
4.1 TRIP GENERATION
Vehicle trips generated by the proposed Power Plant are likely to be at a peak during the construction stage
and will comprise of labour transport and construction vehicles.
The construction traffic will likely comprise of construction plant (vehicles such as graders, front-end
loaders, bull dozers, tipper trucks and cranes) some of which will arrive on site at the start of construction
and remain on site, while others will deliver materials. Construction trips are likely to vary based on the
extent of construction material that will be required on the site for the earthworks, road surfaces and paving
(aggregate, concrete, etc.) as well as the building materials for the power plant itself (mainly steel elements).
Vehicle trips during operation will be related to staff and deliveries and will most likely be relatively low.
The following vehicle occupancies have been assumed:
Passenger car / LDV - 1.5 (Average to allow for ride-sharing)
Minibus-Taxi - 12
Bus - 55
4.1.1 Construction Traffic
Construction Staff
Approximately 2030 employees are expected to work on the site during construction of the power station,
75% of which are expected to unskilled and the remaining 25% skilled employees.
Assuming a construction duration of approximately 24 months, it is assumed that a peak of 60% of the
workforce is expected to be on site at one time during construction of the power plant.
It is further assumed that 90% of the unskilled labour force will be transported to site via public transport
modes, namely contracted minibus-taxis and buses, with the remaining 10% via private or company
passenger vehicles.
Approximately 80% of the skilled labour force is expected to make use of private car or company-LDV
vehicles. The remaining 20% will likely travel via minibus-taxi.
Based on the assumed peak of 60% of the labour force, this relates to the number of peak hour vehicle trips
indicated in Table 1 below:
Table 1: Peak Hour Vehicle Trips – Construction Workforce
Vehicle
Employees Skill % Workforce / Employees / No of
Transport Mode Occupancy
(60% of 2030) Level Mode Mode Vehicles
(average)
Passenger Car /
Skilled 1.5 80% 243 162
LDV
(25%)
Minibus-taxi 12 20% 61 5
1218 Passenger Car /
1.5 10% 91 61
Un-skilled LDV
(75%) Minibus-taxi 12 50% 457 38
Bus 55 40% 366 7
Total 273
REP001 – Proposed LNG Power Plant – Coega SEZ Zone 10 (North) January 202012 Traffic Impact Assessment
Construction Vehicles
The total number of construction vehicles generated by the project is not yet know, given the complexity of
the project and that it is still in the planning phase. As such, it is assumed that the construction vehicles
generated by the project will operate outside of the peak hour and will not be used in the capacity analysis
described in Chapter 6 below.
The vehicles are comprised of those that will remain on site while the tasks for which they are required are
performed and those that are required to deliver various materials to and from the site.
It is assumed that the composition of construction vehicles generated by the development is as follows:
▪ Construction plant vehicles that will arrive on site once and remain for the duration of the time necessary
to perform their tasks (dozers, graders, loaders);
▪ Steel components (pipes, tanks and sections) will be transported to site;
▪ Material for foundations will be imported from commercial sources;
▪ Waste Material will be transported from site to authorized waste disposal sites (tipper trucks); and
▪ Material supply to a concrete batch plant to be erected on site to mix concrete, to be delivered as and
when they required.
Pipe sections will also be transported to the pipeline route by truck, and most likely be deposited along the
route to facilitate more efficient construction of the pipeline. Apart from the initial supply of the pipe sections
it is not expected that there will be any significant construction traffic on the road network during
construction of the pipelines.
4.1.2 Operational Traffic
Approximately 85 employees are expected to work at the power station once construction has completed,
70% of which are expected to be unskilled and the remaining 30% skilled employees.
It is assumed that 90% of the unskilled labour force will be transported to site via public transport modes,
namely contracted minibus-taxis and buses, with the remaining 10% via private or company passenger
vehicles.
100% of the skilled labour force is expected to make use of private car or company-LDV vehicles with an
element of ride-sharing. It is further assumed that the power plant workforce will operate on a two-shift
basis over 24 hours. This relates to the number of peak hour vehicle trips as indicated in Table 2 below:
In addition, delivery and collection of the following products will also occur at the frequencies indicated
below. These volumes are per truck. Thus, each truck represents two trips, one in and one out:
General supplies - 1 per month
Waste (Refuse) - 1 per week
Table 2: Vehicle Trips – Operational Workforce
Vehicle
Employees Skill % Workforce / Employees / No of
Transport Mode Occupancy
(60% of 2030) Level Mode Mode Vehicles
(average)
Skilled Passenger Car /
1.5 100% 25 17
(30%) LDV
Passenger Car /
85 1.5 10% 6 4
Un-skilled LDV
(70%) Minibus-taxi 12 50% 30 3
Bus 55 40% 24 1
Total 25
Figure 8 overleaf indicates the operational AM and PM peak hour trips.
REP001 – Proposed LNG Power Plant – Coega SEZ Zone 10 (North) January 202013 Traffic Impact Assessment
4.1.3 Latent Traffic Volumes
Other known developments that will impact on the access road to the Power Plant are the proposed Tank
Farm and OTGC Bulk Liquid and Handling Facility within the Port. The proposed tank farm site will make
use of the same access road while the OTGC site will make use of the Port access road.
The Traffic Impact Assessment in the EIA prepared for the proposed Coega Tank Farm (7) indicates that the
proposed tank farm will generate 26 vehicle trips during the AM and PM peak hours, while the proposed
OTGC site will generate 31 peak hour trips.
The trips generated by these two developments are indicated on Figure 9.
4.1.4 Other Power Plant Developments
Other known power plant developments that will impact on the access roads to Zones 10 and 13 are the
ENGIE Zone 13 plant next to the CDC Zone 13 plant and the Karpowership plant which does not generate
any traffic impact as the gas is transported to the DEDEISA power station via pipelines. The ENGIE site
will make use of the same access road as the CDC Zone 13 site.
These trips are indicated on Figure 11.
4.1.5 Trip Generation Summary Traffic
A summary of the generated AM and PM peak hour trips is indicated in Table 3 below.
Table 3: Summary of Generated Trips
TRIPS IN TRIPS OUT
Component
AM PM AM PM
Construction – Zone 10 South 273 50* 50* 273
Operation – Zone 10 South 25 4* 4* 25
Tank Farm and OTGC 29 28 28 29
# 28 4 7 25
Zone 10 - Vehicle Distribution
# 25 4* 4* 25
Zone 10 South
# 64 5* 5* 64
Zone 13
# 25 4* 4* 25
ENGIE – Zone 13
* These trips are public transport return trips in AM and arriving in PM
# Operational trips only
REP001 – Proposed LNG Power Plant – Coega SEZ Zone 10 (North) January 202014 Traffic Impact Assessment
4.2 TRIP DISTRIBUTION
Based on the observed traffic volumes and taking into account the location of the power plant relative to the
surrounding residential areas, the following distribution has been assumed for trips generated by the power
plant.
Construction Stage
▪ 80% to and from the west along N2
▪ 20% to and from the east along N2
Operational Stage
▪ 90% to and from the west along N2
▪ 10% to and from the east along N2
The generated construction peak hour traffic volumes added to the background and latent traffic volumes for
the 2020 horizon are indicated on Figure 10 overleaf.
Cumulative Impacts for all Power Stations
It is assumed that all proposed plants will be operational by 2030.
As such, Figure 11 indicates the cumulative operational traffic for the Zone 10 South and North Power
Stations, the Zone 13 Power Station and the Liquified Natural Gas terminal and distribution facility added
to the latent volumes and the ENGIE Zone 13 plant and the escalated background traffic volumes for the
2030 development horizon.
It is further noted that the proposed Karpowership will not generate any traffic impact as the gas is transported
to the DEDISA power station via pipelines
REP001 – Proposed LNG Power Plant – Coega SEZ Zone 10 (North) January 202015 Traffic Impact Assessment
Figure 7: Generated Peak Hour Traffic Volumes - Construction
REP001 – Proposed LNG Power Plant – Coega SEZ Zone 10 (North) January 202116 Traffic Impact Assessment
Figure 8: Generated Peak Hour Traffic Volumes - Operation
REP001 – Proposed LNG Power Plant – Coega SEZ Zone 10 (North) January 202117 Traffic Impact Assessment
Figure 9: Latent Peak Hour Traffic Volumes – Tank Farm & OTGC
REP001 – Proposed LNG Power Plant – Coega SEZ Zone 10 (North) January 202118 Traffic Impact Assessment
Figure 10: Peak Hour Traffic Volumes after Development - 2020 (Construction)
REP001 – Proposed LNG Power Plant – Coega SEZ Zone 10 (North) January 202119 Traffic Impact Assessment
Figure 11: Peak Hour Traffic Volumes after Development - 2030 (Operation of All Plants)
REP001 – Proposed LNG Power Plant – Coega SEZ Zone 10 (North) January 202120 Traffic Impact Assessment
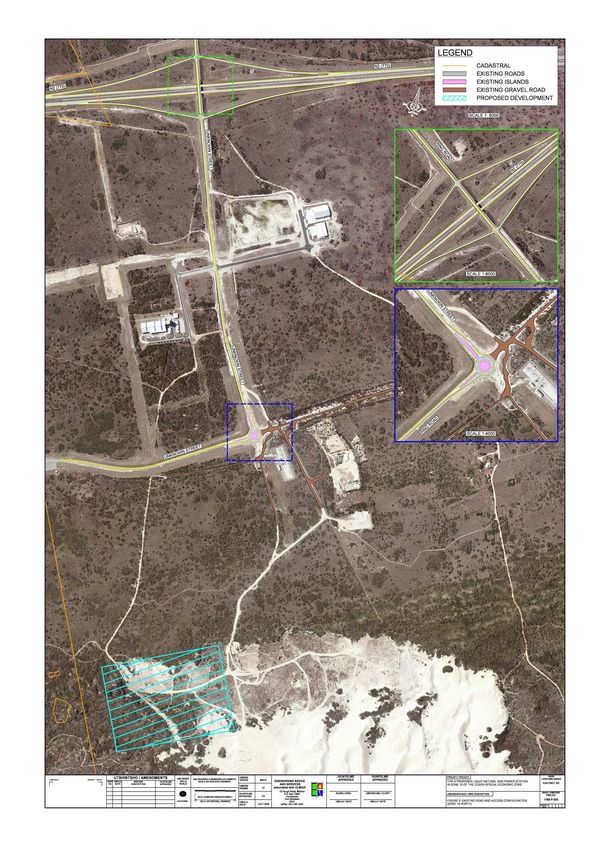
5 PROPOSED ACCESS ARRANGEMENTS
The primary access to the site is proposed from an extension of the Ring Road from the existing roundabout
as indicated on Figure 12.
Based on the projected peak hour volumes a single lane per direction is sufficient to accommodate these
volumes.
In terms of TRH 26 (3) the minimum access spacing on Class U2 roads is 150m to 175m. In addition, the
sight distance requirement for a semi-trailer vehicle entering a road with a design speed of 60 kph turning
left or right is 200m. The requirement for a passenger car is 120m.
The access to the site must be configured with security gates set back at least one truck length (20m) from
the kerb-line.
REP002 – Proposed Gas Distribution Facility – Coega SEZ Zone 10 January 2021You can also read