Emission profile of pollutants due to traffic in Lucknow
←
→
Page content transcription
If your browser does not render page correctly, please read the page content below
International Research Journal of Public and Environmental Health Vol.1 (7),pp. 150-157, September 2014
Available online at http://www.journalissues.org/IRJPEH/
http://dx.doi.org/10.15739/irjpeh.001
© 2014 Journal Issues                                                                                   ISSN 2360-8803

Original Research Article

   Emission profile of pollutants due to traffic in Lucknow
                          City, India
                                                                                                          Accepted 28 August, 2014

  M Tiwari1*, SP Shukla1, NK
Shukla2, RB Singh1, N Mumtaz3,
   VK Gupta1 and V Singh4                   The human behaviors over the last few decades have changed the global
                                            atmospheric condition. Industrial emissions, transportation, intensification
    1Department of Civil Engineering,       of agricultural practices and urban development have directly elevated the
Institute of Engineering and Technology,    levels of pollutant gases such as CO2, NO2, CO and Particulate Matter (PM),
      Lucknow-226021, U.P., India.          which are probably to have inconsiderate climatic implications. Study is
  2Environmental Monitoring Division,

   CSIR-Indian Institute of Toxicology
                                            based on emissions from 2-Wheelers, 3-Wheelers, 4-Wheelers, Light
 Research, M.G. Marg, Lucknow-226001,       Commercial Vehicles (LCVs) and Heavy Vehicles (HVs) at Lucknow City, India
                U.P., India.                for three consecutive months; February 1, 2014 to April 30, 2014. The
 3Department of Civil Engineering, Babu
                                            concentration of SO2, PM, CO and NO2 of selected location was 0.21 µg/m3,
    Banarsi Das Engineering College,
      Lucknow-226028, U.P., India.
                                            6.27 µg/m3, 74.28 µg/m3 and 40.64 µg/m3 at Hazaratganj Road where as for
4Department of Civil Engineering, Motilal   Kalidas road it was 0.11 µg/m3, 2.87 µg/m3, 35.78 µg/m3 and 18.77 µg/m3,
 Nehru National Institute of Technology,    respectively. The concentrations of above pollutants were more at
      Allahabad-211004, U.P., India.        Hazaratganj Road as compare to Kalidas road. The emissions profile of SO2,
                                            PM, CO and NO2 were within national ambient air quality standard.
       *Corresponding Author
    E-mail : mktiwariiet@gmail.com
        Tel.: +919450577490;                Key words: Vehicle emission, particulate matter, traffic analysis and air modeling
         Fax: +915222628227

INTRODUCTION

Lucknow city is the capital of Uttar Pradesh; which has a         routes of Lucknow City. Since motor vehicle (traffic)
population of 2.82 million (Municipal corporation and             emission are major sources of air pollution (Fujita et al.,
Cantonment) as per 2011 census, area of 310 km2 and its           1992, Kodama et al., 2002) in the Urban City. Major road
geographic position is 26°52' N latitude to 80°56' E              present near the Hazaratganj was Nishatganj to Charbag,
longitude; 128 meter above the sea level. As a consequence        road which have massive vehicular motion as compare to
of urban development, along with energy, the transport            other roads during entire years. (Figure 1)
sector has been the centre of attention during last decade.          Considering the worsening traffic growth and emissions
The transport sector in India consumes about 16.9% that is        and their impact on human health and urban air quality
36.5 million tons of oil equivalents of total energy. Among       there is a need for a regulatory framework for the
different types of motor vehicles, percentage of two              management of traffic, air quality and emissions at local
wheelers has revealed rapid growth and it constitutes 70%         level, regional and national scales (Costabile et al., 2008).
of total motor vehicles of India (Ramchandra et al., 2009).       The continuous vehicular exhaust inhalation can lead to
   The main source of particulate air pollution in Lucknow        symptoms of lower respiratory tract such as cough,
city is vehicular traffic emission. The number of vehicle         shortness of breath and pain with inspiration (Dockery et
categories registered in Regional Transport Office (RTO)          al., 1994, Pope III, 1997). The unpleasant effects of
Lucknow was 14, 24,478 as of March 31, 2013 which is              prominent air pollutants on environment and human health
8.35% higher over the last year. Uttar Pradesh State Road         are well known. A large number of urban people are at the
Transport Corporation (UPSRTC) introduced bus services            edge of health risk due to adverse air quality. Among the
under “Lucknow Mahanagar Parivahan Sewa” on different             different sources of air pollutants, tail pipe emission from
Int. Res. J. Public Environ. Health 151
Figure 1: Lucknow city map
the vehicle is one of the main sources of air pollutants. (Dockery et al., 1993). Various scientific studies are going
Pollutants like Particulate Matter (PM), Sulphur dioxide on in the different parts of the world and in India. Studies
(SO2), Oxide of nitrogen (NO2), CO (Carbon monoxide), revealed that almost all major cities including Lucknow are
Poly-aromatic hydrocarbon (PAH) and trace elements etc. polluted. Some criteria pollutants are above the prescribed
are also present in the urban air and their levels are on the permissible limit, especially the PM10. Several recent
raise because of vehicular pollution. Due to change of studies suggest an association between automobile exhaust
technology and use of different fuels; the composition of the and increased respiratory illnesses (Nitta et al., 1993,
air quality is one of areas of concern. Oosterlee et al., 1996).
Association between mortality rate and particulate air The fine particulate matters are complex mixture of
pollution has long been studied, but many studies may be chemical agents of different shapes and sizes. Studies reveal
limited by a lack of control for confounding factors that the effect of PM on human health will depend on theTiwari et al. 152
Table 1: Emission Factor for selected locations
Sr. No. Particulars of the Traffic Final Emission Factor (gm/km/vehicle)
CO NO2 PM
1. Two Wheeler 1.36 0.315 0.021
2. Three Wheeler and Auto-rickshaw 1.59 0.577 0.151
3. Passenger Cars and Jeeps 1.16 0.666 0.114
4. Light Commercial Vehicle 3.66 2.120 0.475
5. Heavy Duty vehicle 9.02 9.476 1.075
chemical composition of fine particulate matters, besides its LCV, HV. During counting of vehicle only cross mark sign
number and mass concentration. At elevated levels, both was used for a vehicle as each per fraction. The vehicle
the categories may increase mortality and morbidity of moving toward Charbag was counted by a person and at the
human population. The effect of SO2 on ecosystem and same time the vehicle coming from Charbag to Nishatganj
human health is well recognized. At eminent level SO2 can was counted by another person.
contribute to respiratory illness, particularly to children Length of Nishatganj-Charbag Road was approximately 7
and elderly people and aggravate existing heart and lung km with width of 28 meters and Lohiya path (Ambedkar
diseases. park to Kalidas Road) was 2 km with width of 32 meters. It
The most decisive part of assessment studies is to know was compared with current year pollution scenario to the
the present as well as future air quality levels. The projected years due to addition of vehicular movement in
statistical distributional models that are 'non-causal' and subsequent year.
based on the historical data overcome the above limitation
and calculate the 'extreme' concentrations with logical Emission factor
precision (Jakeman et al., 1988). Hybrid modeling is one of
the techniques that estimate the 'entire range' of the The vehicle emission factors prescribed for Indian Vehicle
distribution of air pollutant concentrations by combining from CPCB/MOEF (CPCB, 2007) were considered in this
deterministic based models with suitable statistical study. The composite emission factors indicating fraction of
distributional models. In the past, (Taylor et al., 1985) various vehicle categories on the road have been worked
applied such a technique to envisage the entire range of out. The emission factor for the selected location is
pollutant concentrations for vehicular exhaust emissions. presented in Table 1.
Recently, Gokhale et al., (2003) have afforded to develop a
hybrid model for one of the traffic intersections in Delhi, Emission calculation methodology
India, to find out the entire concentration profile of CO.
The paper first, describes the vehicular pollution studies Emission from the vehicle has been calculated using the
carried out at Hazatarganj and Kalidas road traffic following equation 1:
intersections and then predicts the future emission load in Ep =∑ (Vehi X Di) × EF Equ. 1
that area which is important due to one falls into where: Ep is the Pollutant mass emission per day, i is the
commercial zone and the latter in silence zone (such as vehicle category,
Institutional zone, Hospital zone, VIP residential zone etc.). Veh is the number of vehicle,
This paper discusses the current scenario of the D is the distance traveled in km in one day and
transportation sector in terms of air pollution and reviews EF is the mass emission factor per km travel.
the air quality modeling studies conducted in Lucknow For estimating SO2 emissions from vehicle, the following
(U.P.) India. Future scope for air quality modeling is also assumptions have been made. Average km run per litre of
discussed. diesel is taken as: 10 km (for 3W); 15 km (for 4W); 7 km
(for LCV) and 5 km (HVs). Sulphur content is in diesel is
taken as 50 ppm (wt/wt) (CPCB, 2007). Total road length
MATERIALS AND METHODS was estimated by digitizing all the roads and then GIS
software was used to calculate road length and therefore,
Traffic survey data of various vehicle on Hazaratganj exact road length was obtained. As the next step,
road and Kalidas Road information on traffic flow from traffic counts was
translated into the vehicle on the roads. Based on road
Vehicles were counted manually on Hazaratganj Road and length and number of vehicle on the road, total vehicle
Kalidas Road separately. A pre-planned data sheet was kilometer travel (VKT) was estimated for each road. The
prepared to count vehicle. The format of traffic count data data of wind direction was procured from Indian
sheets was prepared as making fraction of 2W, 3W, 4W, Meteorological Division, Pune and validated with the dataInt. Res. J. Public Environ. Health 153
Figure 2: Number of Different Vehicle Category on Hazaratganj road
Figure 3: Number of Different Vehicle Category on Kalidas road
reported from literature. Wind rose diagram was prepared The average daily patterns of flow of 2W, 3W, 4W, LCVs and
by using Lakes Environmental wind rose plot version HVs throughout the day are shown in Figure 2 and 3 during
V.6.5.1. Feb 1, 2014 to April 30, 2014. The number of 4W is high
during the day. The vehicle count considering both major
and minor lanes was found to be 99,642 and 43,003 per day
RESULTS AND DISCUSSION at Hazaratganj road and Kalidas road respectively.
Traffic survey data of various vehicle on Hazaratganj Vehicular emission profile on Hazaratganj Road
road
The SO2, PM, CO and NO2 emissions from different vehicle
The average daily patterns of flow of 2-Wheelers (2W), 3- category are presented in Table 2. The percent contribution
Wheelers (3W), 4-Wheelers (4W), LCVs and HVs of different vehicle category in above pollutants emission is
throughout the day are shown in Figure 2. The number of shown in Figure 4.
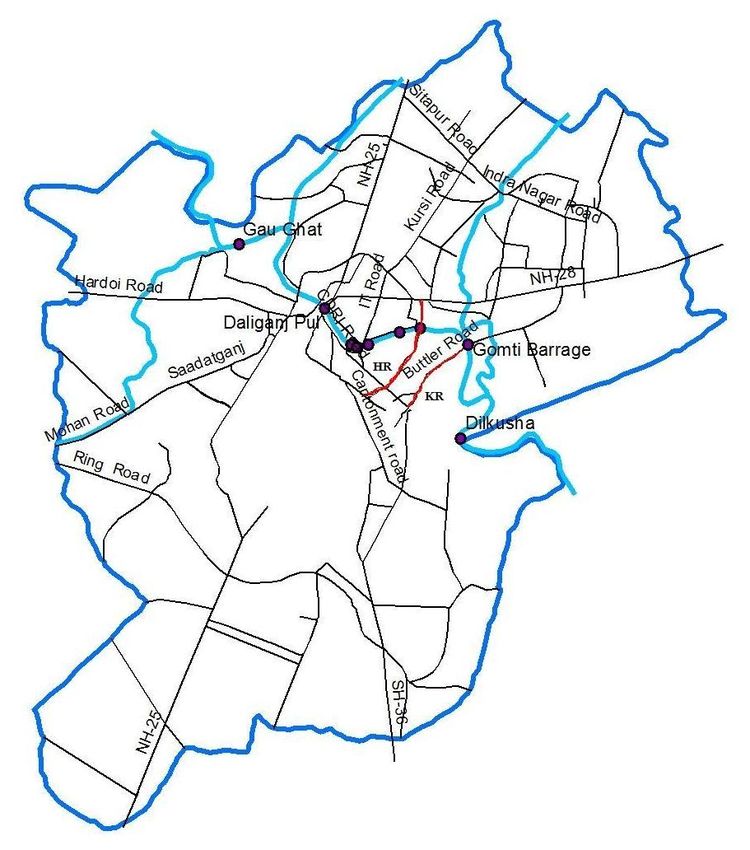
3W is high during the day. As from above Figure 4 (i) in case of 2W, the emission of
SO2 was not incorporated as the fuel was petrol in which
Traffic survey data of various vehicle on Kalidas Road sulphur content was nil. The movement of 3W was more as
the LCV was very less. As it was may be due to the
The average daily patterns of flow of 2W, 3W, 4W, LCVs and restriction of LCV movement on the Hazaratganj Road. As in
HVs throughout the day are shown in Figure 3. The number case of Figure 4 (iv), the contribution of PM emission was
of 2W is high during the day. more for 2W, as the movement was more as compare toTiwari et al. 154
Table 2: Pollutants Emission at Hazaratganj Road and Kalidas Road
Pollutants Emission at Vehicle Types
Different Time Interval 2W 3W 4W LCV HVs (Buses Total & trucks) Total
Profile on Hazaratganj Road SO2 --- 0.14 0.02 0.01 0.04 0.21
PM10 0.26 2.16 1.44 0.28 2.13 6.27
CO 16.61 22.82 14.78 2.18 17.88 74.27
NO2 3.85 8.24 8.48 1.27 18.79 40.63
Profile on Kalidas Road SO2 --- 0.07 0.01 0.01 0.02 0.11
PM10 0.14 0.99 0.75 0.08 0.91 2.87
CO 9.27 10.52 7.69 0.65 7.65 35.78
NO2 2.15 3.80 4.41 0.37 8.04 18.77
All the units are in µg/m3
(i) (ii)
(iii) (iv)
Figure 4: Pollutants Emissions from Vehicle (i) SO 2, (ii) PM, (iii) CO and (iv) NO2
other vehicle. SO2 was not incorporated as the fuel was petrol in which
sulphur content was nil. The number of vehicle was more
Vehicular emission profile on Kalidas Road than twice in case of Hazaratganj Figure 2 and Figure 3 but
the emission scenario was approximately same. The
The SO2, PM, CO and NO2 emissions from different vehicle movement of 3W was more as the LCV was very less. As it
category are presented in Table 2. The percent contribution was may be due to the restriction of LCV movement on the
of different vehicle category in above pollutants emission is Hazaratganj Road. As in case of Figure 5 (viii), the
shown in Figure 5. contribution of PM emission was more for 2W, as the
As from above Figure 5 (v) in case of 2W, the emission of movement was more as compare to other vehicle.Int. Res. J. Public Environ. Health 155
(v) (vi)
(vii) (viii)
Figure 5: Pollutants Emissions from Vehicle (v) SO2, (vi) PM, (vii) CO and (viii) NO2
Figure 6: Wind-rose diagram of the Lucknow city
Air quality modeling modeling package which seamlessly incorporates the
following popular US EPA air dispersion models into one
The air quality modeling was performed using the integrated interface (Tiwari et al., 2014). The emission load
dispersion model developed by the United State was estimated using the AERMOD model of USEPA
Environmental Protection Agency (USEPA) in conjunction considering the line sources. Dispersion of air pollutant
with American Meteorological Society (AMS). This model is would depend on wind direction. The wind rose and
called AMS/USEPA regulatory model, or AERMOD. frequency distribution of the Lucknow city during the study
AERMOD is a complete and powerful air dispersion period is given in Figure 6.Tiwari et al. 156
Table 3: PM10 and NO2 (24 hour) value for the year of 2014, 2017 and 2022
2014 2017 2022
PM10 (µg/m3) NO2 (µg/m3) PM10 (µg/m3) NO2 (µg/m3) PM10 (µg/m3) NO2 (µg/m3)
HR KR HR KR HR KR HR KR HR KR HR KR
1st 41.76 23.54 41.78 22.69 53.59 29.67 141.91 72.54 69.89 37.76 211.57 109.41
2nd 39.68 22.98 39.65 20.78 52.29 27.31 139.48 74.93 68.23 34.32 204.49 106.56
3rd 34.98 18.67 35.91 18.87 45.07 23.39 199.59 103.49 58.79 28.99 179.87 92.43
Annual 18.21 10.89 17.09 09.23 21.14 1 2.45 59.21 31.65 28.13 15.43 88.42 46.35
HR: Hazaratganj Road, KR: Kalidas Road
PM10 and NO2 concentrations at Hazaratganj Road Conclusion
Three scenarios were considered in terms of years (2014, The emission of SO2, PM10, CO and NO2 at Hazaratganj road
2017 & 2022). The model-computed concentrations for was 0.21 µg/m3, 6.27 µg/m3, 74.27 µg/m3 and 40.63 µg/m3
PM10 are shown in Table 3. The predicted 1st highest 24 respectively. While the emission of SO2, PM10, CO and NO2
hour concentration for the year 2014 is 41.76 µg/m3 and was 0.11 µg/m3, 2.87 µg/m3, 35.78 µg/m3 and 18.77 µg/m3
annual maximum is 17.09 µg/m3. Both 24 hour and annual respectively at Kalidas road. Study revealed that emission
hour maximum concentrations are well below the NAAQS profile at Hazaratganj road was more than Kalidas road. As
for PM10 (24-hr Standard: 100 µg/m3 and annual standard: from Air-modeling, the emission of PM10 was 1.3 fold and
60 µg/m3). For NO2, highest 24 hour concentration for the 1.7 fold more (from 2014 to 2017; and 2014 to 2022),
year 2014 is 41.78 µg/m3 and annual maximum is 18.21 respectively and in case of NO2, it was 3.4 fold and 5.1 fold
µg/m3. (from 2014 to 2017; and 2014 to 2022), respectively.
Whereas on Kalidas road, the emission of PM10 was 1.3 fold
PM10 and NO2 concentrations at Kalidas Road and 1.6 fold more (from 2014 to 2017; and 2014 to 2022),
respectively and in case of NO2, it was 3.2 fold and 4.8 fold
The predicted highest 24 hour concentration for the year (from 2014 to 2017; and 2014 to 2022), respectively.
2014 is 23.54 µg/m3 and annual maximum is 10.89 µg/m3 To control vehicle emission, regular checking for fitness
as shown in Table 3. For NO2, highest 24 hour and up gradation of fuel quality and tightening of vehicle
concentration for the year 2014 is 22.69 µg/m3 and annual emission regulations should be adopted. Public transport
maximum is 09.23 µg/m3. system must be improve and phasing out of grossly
It was predicted from Table 3, on Hazaratganj road that polluting commercial vehicle. Encouraging car pool as well
the emission of PM10 was 1.3 fold and 1.7 fold more (from as reduction in value of VKT also reduced the emission
2014 to 2017; and 2014 to 2022), respectively and in case profile of vehicle. It is a preliminary prediction which
of NO2, it was 3.4 fold and 5.1 fold (from 2014 to 2017; and carried out with the ultimate objective of conducting a
2014 to 2022), respectively. Whereas on Kalidas road, the large-scale source apportionment study for the Lucknow
emission of PM10 was 1.3 fold and 1.6 fold more (from 2014 area. Ample long-term measurements of organic and
to 2017; and 2014 to 2022), respectively and in case of NO2, inorganic ambient aerosol components and local source
it was 3.2 fold and 4.8 fold (from 2014 to 2017; and 2014 to signatures are required in order to gain a more complete
2022), respectively. result.
Traffic-related pollutants affect ambient air quality on a
broad variety of spatial scales, ranging from the roadside to
the urban and regional background scales. Long term ACKNOWLEDGEMENTS
exposure to SO2, CO, PM and NO2 cause exacerbation of
asthma, cancers, particularly lymphomas, leukemia, and Authors express their gratitude to Prof. R.K. Khandal,
brain cancer. Director, I.E.T., Lucknow for providing necessary facilities
Characterization of the nature and extent of travel to carry out this work.
activity is essential for estimating emissions from motor
vehicle and for reducing the impact of motor-vehicle
emissions on air quality requires a comprehensive strategy REFERENCES
that typically includes four key components, that is
emissions standards for new vehicle, transportation Air Quality Monitoring Project-Indian Clean Air Programme
planning and demand management, specifications for clean CPCB (2007). Report on “Emission Factor development
fuels and inspection programs to ensure proper vehicle for Indian Vehicles” as a part of Ambient Air Quality
maintenance. Monitoring and Emission Source Apportionment Studies.Int. Res. J. Public Environ. Health 157 Cacciola RR, Sarva M, Polosa R (2002). Adverse respiratory WHO (2004).World Health Organization, Protection of the effects and allergic susceptibility in relation to particulate Human Environment, Assessing the Environmental air pollution: flirting with disaster. Allergy, 57: 281-286. Burden of Disease at National and Local Levels, Geneva. Costabile F, Allegrini I (2008). A new approach to link transport emissions and air quality: An intelligent transport system based on the control of traffic air pollution. Environ. Mod. Sof. 23: 258-267. Dockery DW, Pope CA, Xu X, Spengler JD, Ware JH, Fay ME (1993). An association between air pollution and mortality in six US cities. N. Engl. J. Med. 329: 1753-1759. Dockery DW, Pope III CA (1994). Acute respiratory effects of particulate air pollution. Annu Rev Public Health. 15: 107-32. Fujita EM, Croes BE, Bennett CL, Lawson DR, Lurman FW, Main HH (1992). Comparison of emission inventory & ambient concentration ratios of CO, NMOG & NOx in California’s south coast air basin, J. Air waste Manage. Assoc. (USA), 42: 264-276. Gokhale S, Khare M, Pavageau M (2003). Modelling distribution of air pollutant concentration from vehicular exhaust in urban environment: A hybrid approach, PHYSMOD2003, In: International workshop on physical modeling of flow and distribution phenomena, Prato, Italy, 3-5 September. http://www.weblakes.com/products/aermod/?AspxAutoD etectCookieSupport=1. Jakeman AJ, Simpson RW, Taylor JA (1988). Modelling distribution of air pollutant concentrations-III: Hybrid Modelling deterministic-statistical distribution. Atmos. Environ. 22: 163-174. Kodama Y, Arashidani K, Tokui N, Kawamoto T, Matsuna K, Kunugita N, Minakawa N (2002). Environmental NO2 concentration & exposure in daily life along main roads in Tokyo, Environ. Res. 89: 236-244. Nitta H, Sato T, Nakai S, Maeda K, Aoki S, Ono M (1993). Respiratory health associated with exposure to automobile exhaust I: Result of cross sectional studies in 1979, 1982 and 1983, Arch. Environ. Health 48: 53-58. Oosterlee A, Drijver M, Lebret E, Brunekreef B (1996). Chronic respiratory symptoms in children & adults living along streets with high traffic density. Occup. Environ. Med. 53: 241-247. Pope III CA, Dockery DW, Schwartz J (1997). Review of epidemiological evidence of health effects of particulate air pollution. Inhal. Toxicol. 7: 1-18. Ramachandra TV, Shwetmala (2009). Emissions from India’s transport sector: Statewise synthesis. Atmos. Environ. 43 (34): 5510-5517. Taylor JA, Jakeman AJ (1985). Identification of a distributional model. Commun. Stat. B14: 497-508. Tiwari M, Shukla SP, Singh NB, Bal JS (2014). Air dispersion modeling for air pollution mapping in the city of Pune Maharashtra. Inter. Res. J. Manag. Sci. Tech. 4 (3): 575- 597.
You can also read