An Air Quality and Climate Change Update 2000 - Maryland ...
←
→
Page content transcription
If your browser does not render page correctly, please read the page content below
An Air Quality and Climate Change
                     Update

2000                        2010                           2020

                                                                   * 2020 data is preliminary

           Air Quality Control Advisory Council - March 15, 2021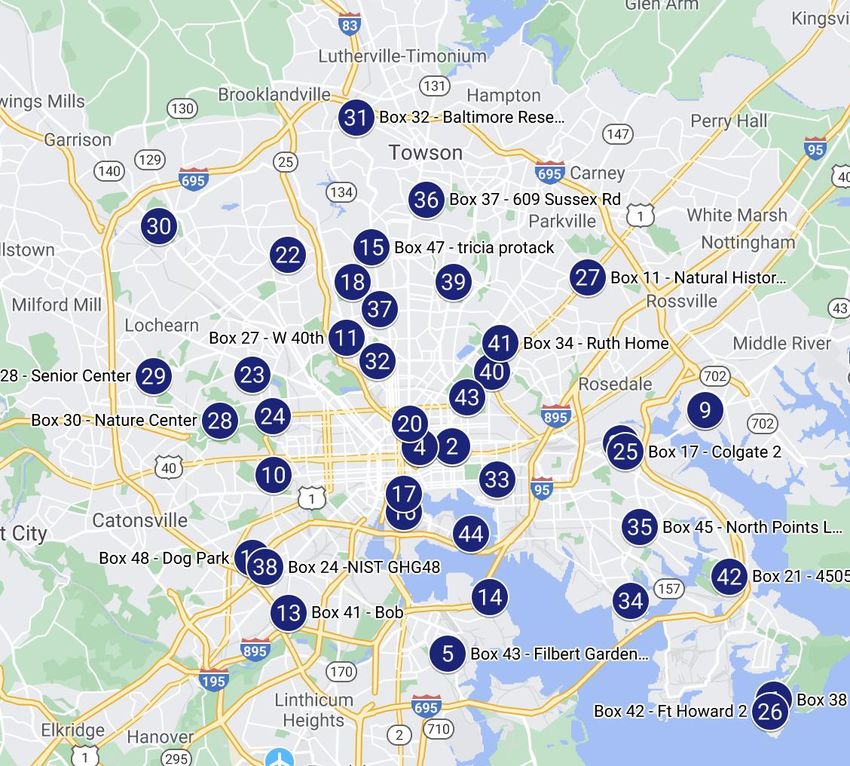
Overview of Presentation
• Air Quality Basics Refresher
• Clean Air and Climate
  Change Progress
• State and Federal Programs
  Addressing Air Pollution
• Moving Forward - AQCAC
  Priorities 2021 and 2022
     https://mde.maryland.gov/programs/Air/Pages/index.aspx   2
AIR QUALITY BASICS

    A REFRESHER
Ground-Level Ozone
• The most pervasive air pollutant in Maryland and many other
  parts of the country…2015 ozone standard. In 2020, Maryland
  recorded the fewest number of bad ozone days ever recorded
  in a year

                                                            4
Particulate Matter
• For the past 10 years, fine particle levels have met the federal
  air quality standards. Typically, particle levels are higher in
  urban areas.zone standard. In 2020, Maryland recorded the
  fewest number of bad ozone days ever recorded in a year

                                                                     5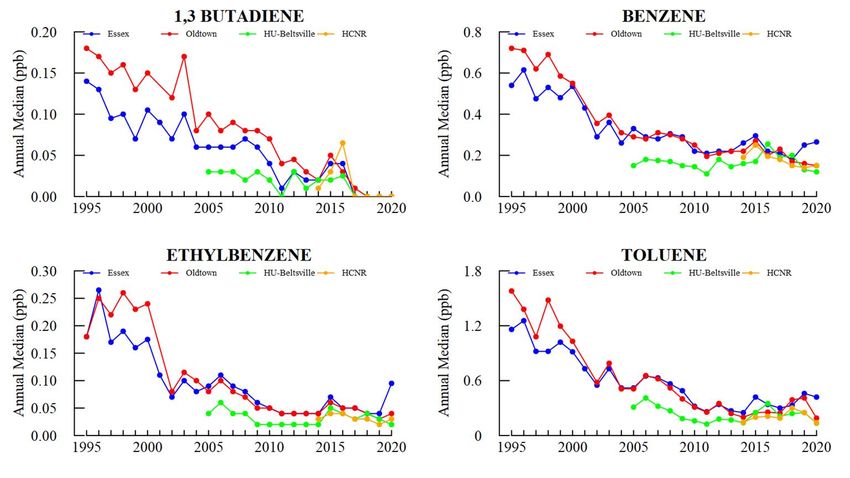
The Ugly…
• Significant air quality events, such as those occurring in Denora, PA
  in 1948, New York City in 1953, 1963 and 1966 as well as many
  others throughout the nation, prompted the federal government to
  enact the Clean Air Act

                                                                          6
The Bad…
• Up until 2010, Maryland continued to experience numerous bad air
  quality events with ground-level ozone and particulate matter levels
  in the unhealthy range
   – 2005 MIT PM Study - Maryland identified as the riskiest place to breathe the
     air west of the Mississippi
   – 2008 - EPA designates the Baltimore area as the worst ozone area outside of
     California and Texas

                                                                                    7
The Good…
• In recent years, Maryland has achieved the federal fine particle standard,
  as well as the 2008 ozone standard, and is moving towards achieving the
  more stringent 2015 ozone standard. In 2020, Maryland recorded the
  fewest number of bad ozone days ever recorded in a year.

        https://pixabay.com/photos/baltimore-harbor-bay-tourism-4027194/

                                                                               8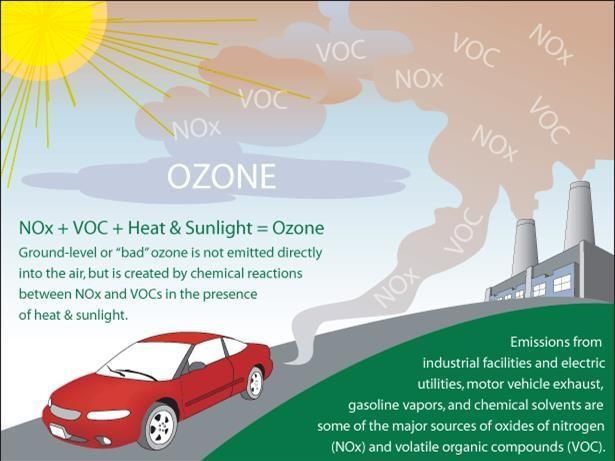
2021 - CLEAN AIR HIGHLIGHTS

     PROGRESS CONTINUES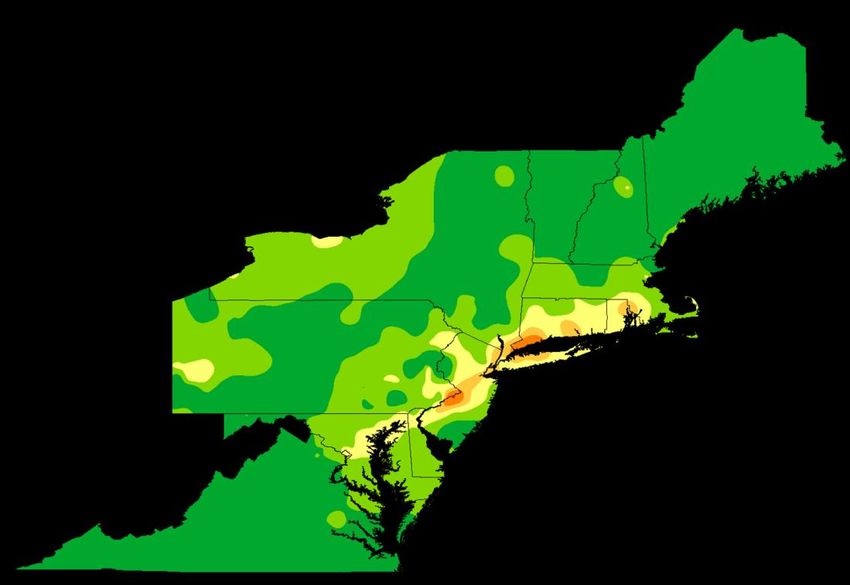
Clean Air Highlights
• For nearly 30 years, Maryland’s air quality has dramatically
  improved

• Air quality policies and regulations have lowered levels of six
  common pollutants — particles, ozone, lead, carbon monoxide,
  nitrogen dioxide, and sulfur dioxide

                                                                    10
Maryland Bad Ozone Days
Exceedance Days
70
61
60
50 46
42
40
30 26
19 20
20 17 16 14
11
10
3
0
2010 2011 2012 2013 2014 2015 2016 2017 2018 2019 2020
* 2020 data is preliminary11The Shrinking Ozone Problem
1998 2020*
Lower Ozone Levels and Significant Spatial
Risk Reduction
8-Hour
Ozone
12Fine Particle Air Pollution
Lower Levels Across the State
20
18 17.1
15.9 15.8 16.2 15.9 15.6
16
14.5
Annual PM2.5 (ug/m3)
14 12.9
11.7 11.1 11.3
12
EPA Annual Standard 12 µg/m3 10.5 10.3
9.8
9.5
10 9.1 9.1
8.3
8
6
Likely to Continue to Get Lower Each
4
2
Year!
0
2002 2003 2004 2005 2006 2007 2008 2009 2010 2011 2012 2013 2014 2015 2016 2017 2018 2019
13SO2 Air Pollution
Levels Well Below Standards
Peak Daily Riviera Beach Monitor SO2 Concentrations &
Maximum Hourly Sum of Brandon, Wagner, & Crane SO2 Emissions
Each Day, 1/1/19 – 9/30/20
80 8000
Max Hourly SO2 Emissions Each Day (lbs/hr)
75 ppb SO2 NAAQS
70 SO2 Nonattainment Area 7000
Peak Hourly SO2 Concentrations (ppb)
60 6000
50 5000
40 4000
30 3000
20 2000
10 1000
0 0
Riviera Beach SO2 Monitor Concentration (ppb)
Max Hourly Sum of Brandon, Wagner, and Crane SO2 Emissions, Each Day, 1/1/19-9/30/20 (lbs/hr)
14Air Toxics Have Been Reduced Significantly • Air toxics are those known to cause cancer and other serious health impacts • Over the last 25 years, Maryland has generally cut concentrations of air 15
What Has Driven the Progress?
• Maryland has adopted hundreds of emission control programs
  to reduce air pollution
   – A few of the higher profile efforts are listed below

• Stationary (smokestack sources):
   – The Maryland Healthy Air Act, The Regional Greenhouse Gas Initiative
     (RGGI), Maryland’s 2015 NOx Regulations … many more

• Mobile sources:
   – The 2007 Clean Cars Program, Federal Tier 2 and 3 tailpipe standards,
     numerous diesel emission reduction efforts … many more

• Potential future emission reduction efforts:
   – The Transportation and Climate Initiative (TCI), Zero Emission Medium
     and Heavy Duty Trucks … many more                                    16
Driving Progress with Research
• MDE works in partnership with the
other states, local universities (UMD at
College Park, UMBC, and Howard
University) and federal agencies
(NASA, NOAA,NIST) to study ozone and
fine particulate air pollution problems
• Major focus … Transport
– Airplanes … Balloons … Lidar
– Profilers … Satellites … Special monitors …
Modeling
– Much, much more
• Major driver of the last 15 years of
progress. Key lessons learned:
– About 70% of Maryland’s ozone problem
originates in upwind states
– Reducing nitrogen oxide from power plants
and vehicles and SO2 from power plants in
MD and upwind states will dramatically
reduce ozone and fine particulate in
Maryland 17NOx Reductions from
Coal-fired Power Plants
Maryland Healthy Air Act
18SO2 Reductions from
Coal-fired Power Plants
Maryland Healthy Air Act
19Deactivation of
Coal-fired Power Plants
• All of Maryland’s coal-fired power plants to close by 2030
– HA Wagner 2 – June 1, 2020
– Dickerson – July 30, 2020
– Chalk Point – June 1, 2021
– Brandon Shores – October 1, 2025
– HA Wagner – October 1, 2025
– Morgantown – 2027
– AES Warrior Run – 2030
• Gas and oil-fired units within facilities may continue operation
• Renewable energy and battery storage projects being planned
as on-site replacement
20Mobile Source Emission Reductions
• State and federal requirements have also driven significant reductions in
emissions from mobile sources
21ADDRESSING CLIMATE CHANGE
MARYLAND’S EFFORTSGreenhouse Gas Reduction Efforts • Through the 2009 and 2016 Greenhouse Gas Emission Reduction Acts (GGRA), MDE has just released a bold, comprehensive plan to reduce our greenhouse gas (GHG) emissions by a minimum of 40% from 2006 levels by 2030 while positively impacting the state’s economy and creating jobs • The final plan incorporates a comprehensive set of more than https://news.maryland.gov/mde/ 100 measures designed to reduce GHG emissions 23
The 2030 GGRA Plan
The Plan reduces GHGs substantially more than the 40-by-30 requirement, and
nearly achieves 50-by-30. Additional Federal action would make up the difference.

    Maryland greenhouse gas emissions, accounting for sequestration. Projections
    from Draft Plan and 2030 GGRA Plan.
GGRA Plan - Economic Impacts
The GGRA Plan achieves the 2030 goal with significant
benefit to the State’s economy.
MD impact relative to Through 2030 Through 2050
Reference Case
Average job impact* + 6,186 + 6,823
GDP Impact** + $ 5.3 billion + $ 14.7 billion
Personal Income Impact** + $ 4.5 billion + $ 16.1 billion
Public Health Benefit + $ 0.9 to $ 2.1 + $ 7.5 to $ 17
(Avoided Mortality)** billion billion
Climate Change Benefit** + $ 3.12 billion + $ 27.9 billion
* Average number of job-years created or sustained each year.
** 2018 Dollars, Cumulative, Net Present Value using 3% discount rate.
Climate benefit evaluated using Federal Social Cost of Carbon (2015 Update)2021 AND 2022 AQCAC
PRIORITIESA Rapid-Fire Snapshot of
2021/2022 Policy Priorities
• Climate Change
– GGRA 2030/2050 Plan
– We still have sensitivity analysis to do: exploring
upcoming Federal action once we have a clearer picture
of incoming administration’s plan.
– Follow-up analysis of individual program contributions
in the coming months.
– Some underlying planning processes continuing this
year, including Buildings Plan (MWG) and
Medium/Heavy Duty ZEV Action Plan (Agencies, ZEEVIC,
& Multistate ZEV Task Force).
– Mid-course GGRA progress report due in 2022.
27A Rapid-Fire Snapshot of
2021/2022 Policy Priorities
– Legislation
• Could require major new effort and new deadlines
– Climate Commission
• Commission and four working groups will continue to meet … Do
not expect a let up on the demanding pace
– Short-lived climate pollutants (SLCP)
• Two down (HFCs and Natural Gas Compressor Stations);
regulations for methane at landfills and natural gas distribution
sector are next
• Wastewater treatment plants and black carbon on the horizon
28Recent SLCP Adoptions
• On December 16, 2019, AQCAC voted to
approve two proposed regulations:
– Prohibitions on use of certain HFCs
– Control of methane from the natural gas
industry
• HFC regulation – Adopted November 2,
2020
– Compliance dates beginning January 1, 2021
– Minor amendments under development
• Natural Gas Compressor Stations
(Methane)
– Adopted November 16, 2020
– Reviewing Blowdown notification plans
29Next Steps on SLCP
• Leaking methane from the natural gas distribution
system
– Regulation may apply LDAR requirements to NG storage
facilities, metering and regulating stations, city-gate and
other aboveground equipment
– Standardize pipeline reporting metrics and include
annually-declining GHG emission requirements to utilities
• Escaping methane from landfills
– Regulation will build upon new federal requirements… but
also, as necessary, go beyond federal limits to ensure that
methane emissions are minimized
– Next stakeholder meeting xxxx xx, 2021Rapid-Fire Priorities (Continued)
• Ozone
– Transport
• Section 184C (PA power plants that don’t always run their controls), Cross
State Air Pollution Rule (CSAPR) Update and Good Neighbor SIPs are all in the
works right now
– Attainment in 2021?
• Have a real shot at meeting the 2015 standard in 2021. Would bring Maryland
into attainment for all criteria pollutants with standards for the first time ever
– Municipal Waste Combustors
• Permit conditions and tougher regulations are in the works
– Aftermarket Catalysts
• Still moving on MDE regulation, but federal action is also a possibility
• Sulfur Dioxide (SO2)
– All areas in MD (3) now meeting the standard
– Working to wrap-up attainment demo process for all 3 areas
31Rapid-Fire Priorities (Continued)
• Mobile
– Medium & Heavy Duty ZEV MOU a very high priority. Action Plan in Fall
– The Transportation and Climate Initiative (TCI) also a high priority
Analyses and expansion of regional program still ongoing
– Electric vehicles (EVs) are also another very high priority
– Will continue to come to AQCAC for reg changes when California makes changes
– California and Clean Air Act Section 177 opportunities will present
themselves in 2021 and 2022
– Potential regs for and advanced clean truck program, a heavy duty diesel NOx
program and an updated california car program are all at a point for consideration
under 177 - more today
– Also a very real possibility that EPA will move to harmonize the federal program with
the California program
– Anti-Tampering …
32Anti-Tampering
• A very hot issue … Started with Volkswagen in 2015
• Problem is much bigger than we (states and EPA) understood
– Tampering taking place with manufacturers like VW, but also at dealers, auction houses
and auto repair shops
• EPA has estimated that excess emissions associated with tampering in the
MARAMA states is 58,000 tons of NOx
• We will be bringing a regulation to AQCAC in June for approval to clarify
exactly what the requirements are
• Already have existing authority in Maryland law to address tampering and
have already begun this work
• Announcement of this major enforcement initiative in April/May timeframe
33Rapid-Fire Priorities (Continued)
• Environmental Justice
– Hyper-local air monitoring projects … Now four efforts that are either up and
running or soon to be up and running. Baltimore, Cheverly, St. Mary’s County
and DC area
– Reinvigorated MDE-wide process for environmental justice is now being
implemented
– Community partnerships - MDE Air Program had initiated partnerships with
nine communities … now being blended with MDE-wide effort
– Permits and compliance
– Maryland’s Port and Peak Day Partnerships
– Port partnership very strong, MDE, MDOT, MEA, the Port and over 15 different
communities. Over $15 Million investment into clean air and very large
reductions in NOx, greenhouse gases, PM, air toxics and diesel particulate.
More reductions on the way.
– MDE’s peak day partnership effort is in its 4th year. Extra effort and reductions
on worst ozone days from about 40 stationary NOx sources.
34An Example of a Hyper-Local
Monitoring Project
The Johns Hopkins/Yale “SEARCH” Project
• Lead by Johns Hopkins and Yale
with MDE collaboration
• A project using a large network of
low cost air quality sensors to look
at air pollution variability across
the Baltimore area
• Data on fine particulate, nitrogen
dioxide, greenhouse gases and
more being collected
• Similar projects in Cheverly, St.
Mary’s County and DC area
SEARCH sensor map courtesy of Kirsten Koehler (JHU) 35The Port Partnership
• A great example of a partnership between government and communities
• Government partners: the Port, the MD Department of the Environment,
the MD Department of Transportation and the MD Energy Administration
• Community partners: Turners Station, St. Helena, Greater Baybrook, North
Point, Fort Howard and maybe 10 other communities
• Diesel reduction has been a major focus but the partnership includes
other media and other issues
• Through 2020, about $10 Million investment into clean air and climate
change … about 1250 tons of NOx emissions eliminated … significant
reductions in GHG and toxic emissions … continued collaboration with
communities
36Diesel Emission Reduction Efforts
The Future
• Community Projects funded with VW funds
– Turners Station
• Marshall’s Trash Truck
– Curtis Bay
• Diesel yard truck
• VW Projects in and around the North Point area
– Port projects
• Repower tugs and purchase trucks and handling equipment
• NOx reduced by 406 tons, $2.97 M investment
– Private Sector projects
• Repower tugs and purchase diesel buses, locomotive switchers, electric cranes
• NOx reduced by 1,876 tons, $22.3 M investment
• Other VW Projects
• Purchase new electric and alternative fuel school buses, trash trucks, transit buses
• NOx reduced by 1,307 tons, $133.7 M investment
37QUESTIONS … DISCUSSION
EXTRA SLIDES

               39
Discussion
• Thoughts … comments on briefing?
• What other environmental or climate change issues are most
important to you?
– A future update on state activities to address climate change related
sea level rise, severe weather and flooding?
• Ideas on a local diesel emission reduction effort?
• The States climate change plan is huge …
– How could we best work with you and other communities to insure
your input on this plan is considered?
• Other Issues?
40What Has Driven the Progress?
• Maryland has adopted hundreds of emission control programs to
reduce air pollution
– A few of the higher profile efforts are listed below
• Stationary (smokestack sources):
– The Maryland Healthy Air Act, The Regional Greenhouse Gas Initiative (RGGI),
Maryland’s 2015 NOx Regulations … many more
• Mobile sources:
– The 2007 Clean Cars Program, Federal Tier 2 and 3 tailpipe standards, numerous
diesel emission reduction efforts … many more
• Potential future emission reduction efforts:
– The Transportation and Climate Initiative (TCI), Zero Emission Medium and Heavy
Duty Trucks … many more
• MDE benefited immeasurably from the MCCC during the finalization of the
2019 GGRA Draft Plan 41NOx Emissions 2019
Top 15 Stationary Sources
Facility-wide
NOx Emissions
No. 2019 Top 15 NOx Emissions Sources in MD (Tons Per Year)
1 Lehigh Cement Company LLC 2,614
2 Raven Power Fort Smallwood LLC 1,130
3 Wheelabrator Baltimore, LP 924
4 Luke Paper Company * 861
5 GenOn Chalk Point Generating Station ** 611
6 Montgomery County Resource Recovery Facility (MCRRF) 470
7 AES Warrior Run Inc 464
8 Morgantown Steam LLC 457
9 Holcim (US), Inc 349
10 Dickerson Generating Station/GenOn Mid-Atlantic, LLC. *** 241
11 Transcontinental Gas Pipe Line Company, LLC Compressor Station 190 155
12 Vicinity Energy Baltimore Heating, LLP-Spring Gardens Plant 154
13 Mettiki Coal, LLC 149
14 Constellation Power - Notch Cliff **** 144
15 Dominion Energy Cove Point LNG, LP 141
Total Stationary Source NOx Emissions in MD - 2019 11,782 tons
* Shutdown May 7, 2020
** Shutdown June 1, 2021
*** Shutdown July 30, 2020
**** Shutdown June 1, 2020Reducing Diesel Exhaust Emissions
• This is an area where we have made considerable progress
over the past few years
• Much of that progress is in and around the North Point Area
• Over the last 10 years over $16 M invested into diesel clean-up
efforts by government and private sources
• An additional $166 M being invested over the next few years
• Funding from Federal grants, State funds and a large pot of
mobile source clean-up money that came to Maryland when
Volkswagen (VW) broke the law
43Diesel Emission Reduction Efforts
The Past
• In and around the North Point Area
– The Port Partnership (since 12/2015)
• Dray truck replacement, cargo handling equipment repower and replacement
• NOx reduced by 1,250 tons, $9.2 M investment in clean air
– Others
• Retrofit locomotives, trucks, gantries, harbor ships and locomotives, tugboat engine
replacement, locomotive idle reduction equipment
• NOx reduced by 1,260 tons, $7.2 M investment
• Other Projects
• Retrofit school buses, long haul trucks, ambulances and fire trucks
• NOx reduced by 670 tons, $3.3 M investment
44Diesel Emission Reduction Efforts
The Future
• Community Projects funded with VW funds
– Turners Station
• Marshall’s Trash Truck
– Curtis Bay
• Diesel yard truck
• VW Projects in and around underserved comunities
– Port projects
• Repower tugs and purchase trucks and handling equipment
• NOx reduced by 406 tons, $2.97 M investment
– Private Sector projects
• Repower tugs and purchase diesel buses, locomotive switchers, electric cranes
• NOx reduced by 1,876 tons, $22.3 M investment
• Other VW Projects
• Purchase new electric and alternative fuel school buses, trash trucks, transit buses
• NOx reduced by 1,307 tons, $133.7 M investment
45You can also read