Senate Inquiry into the Operations of Existing and Proposed Toll Roads in Australia - Submission to the - Public Transport Users Association July 2017
←
→
Page content transcription
If your browser does not render page correctly, please read the page content below
Submission to the
Senate Inquiry into the Operations of
Existing and Proposed Toll Roads in Australia

Public Transport Users Association
July 2017
Introduction
The Public Transport Users Association (PTUA) welcomes the opportunity to contribute to
the Inquiry into the Operations of Existing and Proposed Toll Roads in Australia.

The PTUA advocates for a comprehensive, efficient, environmentally friendly and socially
inclusive public transport network throughout Melbourne and Victoria. As we discuss below,
toll roads can divert from the development of an efficient and inclusive transport system, and
we therefore caution against government support for toll road proposals.

Interaction of commercial considerations with
public policy objectives
Australian toll road operators are typically private sector businesses with obligations to their
investors in accordance with relevant regulation such as the Corporations Act 2001. For
example, toll road operators will wish to maximise tolls and traffic on their assets to
maximise profitability.

        "Inflation-linked toll escalation and traffic growth underpin Transurban’s ability to build
        secure year on year returns from our existing toll road assets."
        (Transurban 2008, p.2)

While desirable for toll road operators, increasing tolls and traffic have a range of negative
impacts for broader society. These include increased traffic - and associated congestion - on
feeder roads, increased vehicle emissions and higher household transport costs. It is
important to note that negative effects may not be obvious on the toll roads themselves, but
may manifest elsewhere on the road network. For example, there may be an increase in
congestion or traffic crashes on local roads used as part of additional journeys that are
induced by the toll road1, despite apparently low rates on the toll road itself.

The cost of most of these broader impacts will not be borne by the toll road operator, but will
fall on the rest of society, such as in the form of higher government taxes or council rates to
address additional health costs or local infrastructure capacity.

1 “Induced traffic” is discussed further below.

                                                                                                   1
Table 1: Some external costs of road use
Land use Land under roads could instead be used for housing, public open
space, horticulture, agriculture, etc.
Barrier effect Vehicle traffic and wide roads impede, delay and inconvenience
people on foot or bike and degrade the amenity of the area.
Noise pollution Motor vehicles are the primary source of noise pollution in urban
areas (particularly near major roads), which has a range of negative
health effects.
Air pollution Air pollution, particularly from motor vehicles, is linked to respiratory
illnesses and over 2,000 deaths each year.
Water pollution Fluids from cars and tyre debris, including a range of heavy metals,
can be significant sources of pollution into surface and
groundwater.
Greenhouse gas emissions Emissions of carbon dioxide and other greenhouse gases from road
transport are a significant component of Australia’s overall
emissions.
Road trauma Around 1,500 people are killed and more than 30,000 people are
hospitalised due to crashes each year.
Health Over-reliance on motor vehicle transport contributes to sedentary
lifestyles that are a risk factor in lifestyle-related illnesses costing in
region of $60 billion annually.
Since these broader costs are external2 to the toll road operator, they are subordinate to their
primary objectives of profitability and return on investment. Thus enhancing revenue growth
will take priority in their planning over broader social objectives. It is these objectives of
private return on investment that would be the primary driver of any "market-led proposals"
made by toll road operators to government. This raises an inherent conflict between the
interests of toll road operators and public policy objectives such as social inclusion, public
health, liveability and environmental sustainability.
While wishing to maximise per-vehicle tolls, toll road operators will not wish to do so in such
a way that significantly diminishes traffic volumes. To put it another way, tolls are largely
aimed at funding the project by providing a return to investors after construction and
operating costs, and are not intended to act as a demand management tool to minimise the
externalities outlined above (with the possible exception of optimising traffic flows). So while
tolls may be considered a form of road pricing, they only act to finance the project while
failing to adequately account for many externalities of vehicle use. Therefore, they are
unlikely to encourage the socially optimal level of road use, all externalities considered.
2 “External costs” are those costs imposed on unrelated parties rather than borne fully by the person
making the decision.
2Were the socially optimal level of road use to be achieved through pricing all externalities, it
is likely that traffic volumes may not justify such extensive investment in additional road
capacity. However, this is clearly not in the interests of the profit-maximising toll road
operators, and such effective demand management will be discouraged in market-led
proposals or other policy interventions.
In many cases, public policy objectives will be better served by enhancement of public
transport services to provide more efficient and inclusive transport options. However, such
improvements are likely to be crowded-out by “market-led” transport planning, leaving
households vulnerable to an overall costlier transport system.
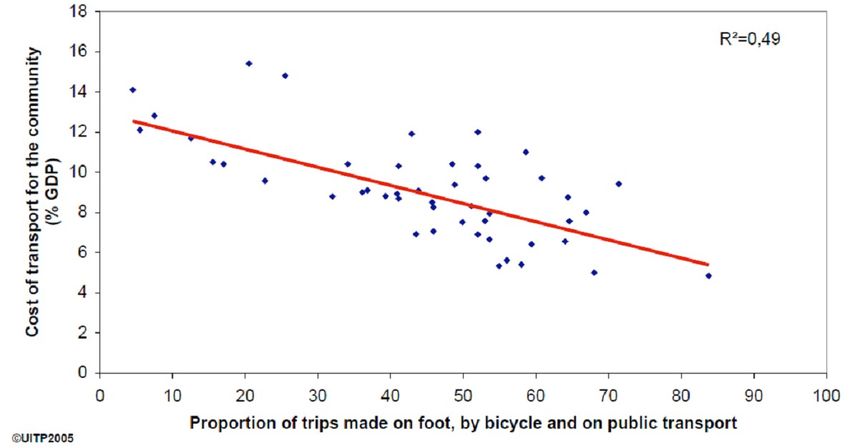
Figure 1: Cost of transport for the community vs modal split
(Vivier & Pourbaix 2006)
“When you’re a hammer, everything looks like a nail.”
When asked at a presentation if they had considered a rail alternative to the
Westgate Tunnel proposal, Transurban replied that they are a “road company”.
The proposed Westgate Tunnel in Melbourne is a pertinent example of commercial interests
advancing a proposal that is a poor match with the broader public interest. This market-led
proposal would significantly increase general traffic capacity directly into the Melbourne CBD
and result in higher traffic volumes and serious harm to urban amenity (Lucas 2017). Traffic
induced by this road would also add to traffic volumes in the western suburbs and
exacerbate the negative effects of road traffic outlined above. Such a design is arguably
unique among recent major road proposals in that it is a major radial road project explicitly
directing large volumes of low occupancy vehicles into the central city in clear contravention
of broader strategies to shift inner city journeys to public transport, walking and cycling.
3“By 2020
90 per cent of all commuter trips to the CBD will be by public transport,
cycling or walking — the 2006 journey to work census figure was 72 per cent.
By 2030
80 per cent of all trips to the City of Melbourne will be by public transport,
cycling or walking — the latest Victorian Integrated Survey of Travel and
Activity (VISTA) 2009 figure is 50.9 per cent.
95 per cent of all trips within the municipality will be by public transport cycling
and walking — the latest VISTA 2009 figure is 84 per cent.”
City of Melbourne Transport Strategy (City of Melbourne 2012, p.114)
"For Melbourne to continue to be a globally connected and competitive city with
strong and healthy communities and higher social and economic participation, the
share of trips by public transport, as well as active transport modes such as walking
and cycling, must increase."
Plan Melbourne – Metropolitan Planning Strategy (DELWP 2017, p.62)
The WGT also performs poorly in the serving the aim of the original Westgate Distributor
(WGD) proposal that the Victorian ALP included in its Project 10,000 policy paper ahead of
the 2014 Victorian state election. The original WGD was intended to get heavy commercial
vehicles off residential streets in the inner west by providing more direct access to the Port of
Melbourne from the Westgate Freeway and did not include provision for additional general
traffic capacity directly into the Melbourne CBD.
However, by major expansion of the scope to include radial passenger travel to the
Melbourne CBD, the Westgate Tunnel can be expected to induce substantial extra
passenger vehicle traffic that will greatly impede the efficient movement of commercial
vehicles (PTUA 2017). Furthermore, in the absence of whole-of-network pricing the
significantly higher tolls for heavy commercial vehicles relative to light vehicles on CityLink
may act as a disincentive for HCVs to use the WGT and therefore result in failure to fully
resolve the problem of trucks on residential streets in the inner west. In contrast, the
commercial interests of the project proponent would be well-served by a large volume of
additional light vehicle traffic, and arguably not harmed by penalising heavy vehicles that
cause a disproportionate amount of wear to the road surface and that may instead choose to
use publicly-maintained roads.
While toll road operators endeavour to portray themselves as good corporate citizens, we
also note their significant financial contributions to political parties (e.g. see Table 2) and the
potential for political donations to influence government decisions (McMenamin 2016).
4Table 2: Donations to ALP and Coalition declared by Transurban – 1999-2000 to 2015-16
1999-2000 2000-01 2001-02 2002-03 2003-04 2005-06 2006-07 2007-08 2008-09 2009-10 2010-11 2014-15 2015-16 Total
Australian Labor Party
ALP - ACT 500 500
ALP - NSW 5,000 29,200 15,600 20,330 30,570 51,495 11,500 9,500 1,000 1,500 175,695
ALP - Queensland 15,000 2,250 3,100 20,350
ALP - Victoria 11,500 21,000 22,850 2,600 11,000 18,628 10,775 12,339 12,573 4,950 128,215
Progressive Business 3,900 22,025 23,799 49,724
ALP - national 11,000 1,485 21,773 7,700 41,958
ALP - Total 11,500 32,000 27,850 29,200 34,500 48,690 65,369 91,896 22,275 21,839 14,073 17,250 416,442
Liberal-National Coalition
Coalition – NSW 6,500 14,200 18,798 27,930 26,745 3,514 10,469 4,000 1,340 8,120 121,616
Coalition – Queensland 3,250 12,000 3,100 18,350
Coalition – SA 500 500
Coalition – Victoria 100,000 36,818 6,000 20,300 5,950 5,720 1,500 10,700 4,600 7,250 198,838
Coalition – national 7,900 1,750 1,100 10,750
Liberal Party – Total 100,000 6,500 51,018 25,013 45,415 32,515 7,920 11,219 15,800 17,940 15,470 328,810
National Party - Total 11,435 4,565 180 1,314 750 3,000 21,244
Coalition - Total 100,000 6,500 51,018 36,448 49,980 32,695 9,234 11,969 15,800 17,940 18,470 350,055
Total ALP & Coalition 111,500 32,000 27,850 35,700 85,518 85,138 115,349 124,591 31,509 33,808 29,873 17,940 35,720 766,497
Note: Due to deficiencies in the reporting of political donations in Australia (Ng 2016), these figures should be considered indicative rather than exhaustive.
5Effectiveness of road capacity expansion
There is now copious evidence of the failure of major road projects to provide enduring
congestion relief in urban environments. Expansion of road capacity induces additional
vehicle traffic in a number of ways including:
● encouraging additional low-value journeys that were previously not considered worthwhile;
● shifting existing journeys from other modes such as public transport into private vehicles;
● changing the timing of existing private motor vehicle journeys from less congested times;
and
● encouraging land use changes that lengthen journeys and/or require additional journeys.
Over time these additional journeys fill the additional road capacity and cause travel delays
to return to previous levels. In some cases congestion ends up worse than prior to the road
expansion due to what is known as the Downs-Thomson Paradox. Where road expansion
encourages journeys to shift away from public transport, service frequencies may be
reduced as a result, causing more people to shift to private motor vehicles and road
congestion to increase beyond previous levels (Mogridge 1990).
At least as long ago as 1994, it was recognised that “increases in traffic on improved roads
are, in general, not offset by equivalent reductions in traffic on unimproved alternative
routes” (HM Department of Transport 1994).
Despite promises in the 1990s that CityLink would free Melbourne from congestion, traffic
delays only five years after opening were worse than those predicted for 2011 under the no-
build scenario (Odgers 2009). Analysis performed for the EastLink toll road in eastern
Melbourne asserted, somewhat bizarrely on the basis of rural examples rather than more
relevant urban evidence, that induced traffic would be insignificant (Wilmot 2006).
Unfortunately these lessons do not appear to have been learned in Australia, including in
Victoria where the Auditor-General found in 2011 that road planners:
“...did not adequately assess the traffic induced by these improvements,
communicate the risks, or estimate the impact of the economic benefits. These
shortcomings create a risk of over-estimating the benefits and giving decision-makers
false confidence…. Unlike road authorities in the UK and New Zealand, VicRoads
does not have adequate guidelines for forecasting traffic in congested areas.”
(Victorian Auditor-General 2011)
Again in 2013 the Victorian Auditor-General found that:
"[t]he absence of a transparent framework for assessing the traffic congestion
impacts of related expansion proposals means it cannot be assured that they are the
most effective and economical options for managing congestion in the long term.
Although alleviating congestion is often one of several drivers for such proposals,
current approaches to assessing their congestion benefits do not sufficiently
6demonstrate the extent to which they address the supply- and demand-side causes
of congestion, or how they contribute to increased congestion by inducing extra road
use.
This limits confidence in the soundness of related infrastructure expansion
decisions."
(Victorian Auditor-General 2013)
These systematic failures to properly account for induced traffic persist in assessment of the
proposed Westgate Tunnel toll road which features in a market-led proposal put forward by
Transurban. For example, transport modelling performed for the project overlooks land use
impacts which are an important driver of medium- to long-term induced traffic (Pittman
2017). Thus the Victorian Government looks set to provide the world with yet another
expensive example of how new urban roads fail to solve congestion.
While the benefits of new roads are frequently overstated, so too are the costs of doing
nothing, or the "no build" scenarios. Nicolaisen and Naess (2015) outline the “pessimism
bias” built into much traffic modelling that predicts much higher congestion levels than
actually eventuate when proposed roads do not proceed to construction. In effect, the
absence of road capacity reduces, rather than induces, actual traffic volumes relative to the
forecasts of traffic models, and travel times where a proposed road is not built are better
than expected.
This has also been observed where removal of existing road capacity has not resulted in
expected traffic chaos, but instead encouraged adoption of more efficient travel behaviour
such as use of public transport (Chung et al, 2012). Thus the congestion costs of no-build
scenarios are frequently overstated, along with the purported benefits of building toll roads
based on (similarly overstated) travel time savings (Pittman 2017). Therefore we should
remain sceptical of claims about large economic contributions from toll roads.
7References
Chung, J, Yeon Hwang, K, & Kyung Bae, Y (2012) 'The loss of road capacity and self-
compliance: Lessons from the Cheonggyecheon stream restoration', Transport Policy, vol.
21, pp. 165-178. Available from:10.1016/j.tranpol.2012.01.009. [13 July 2017].
City of Melbourne (2012) Transport Strategy 2012: Planning for Future Growth,
http://www.melbourne.vic.gov.au/parking-and-transport/transport-planning-
projects/Pages/transport-strategy.aspx
Department of Land, Water and Planning [DELWP] (2017) Plan Melbourne 2017-2050,
Department of Land, Water and Planning, Melbourne,
http://www.planmelbourne.vic.gov.au/__data/assets/pdf_file/0007/377206/Plan_Melbourne_2
017-2050_Strategy_.pdf
HM Department of Transport (1994). Trunk Roads and the Generation of Traffic. Report of
the Standing Advisory Committee on Trunk Road Assessment (SACTRA). HM Stationery
Office.
Lucas, C. (2017) West Gate Tunnel will jam traffic 12 to 14 hours a day, slow trams: city
council, The Age, 29 June, http://www.theage.com.au/victoria/west-gate-tunnel-will-jam-
traffic-12-to-14-hours-a-day-slow-trams-city-council-20170629-gx1h6d.html
McMenanin, I. (2016) No bribes please, we’re corrupt Australians!, The Conversation, 31
May, https://theconversation.com/no-bribes-please-were-corrupt-australians-59657
Mogridge, M. J. H.; (1990), Travel in towns: jam yesterday, jam today and jam tomorrow?
Macmillan Press, London
Ng, Y-F. (2016) Explainer: how does our political donations system work – and is it any
good?, The Conversation, 30 May, https://theconversation.com/explainer-how-does-our-
political-donations-system-work-and-is-it-any-good-60159
Odgers, J (2009). Have all the travel time savings on Melbourne’s road network been
achieved? Technical Report, RMIT University.
Pittman, N (2017). Response to the West Gate Tunnel Transport Impact Assessment
transportation modelling report in the West Gate Tunnel Environment Effects Statement.
Technical Report, University of Melbourne.
PTUA (2017). West Gate Tunnel Project: Submission on the Environment Effects Statement,
Public Transport Users Association, Melbourne
8Transurban (2008) Security Holder Review 2008, Transurban Group: Melbourne,
https://www.transurban.com/content/dam/investor-
centre/04/security_holder_review_2008.pdf
Victorian Auditor-General (2011). Management of Major Road Projects. Victorian
Parliament, PP No 38, Session 2010–11.
Victorian Auditor-General (2013). Managing Traffic Congestion. Victorian Parliament, PP
No 221, Session 2010–13.
Vivier, J. & Pourbaix, J., 2006, Mobility in Cities Database: Better Mobility for People
Worldwide - Analysis and Recommendations, International Association of Public Transport,
Brussels
Wilmot, K (2006) Fool's gold at end of EastLink rainbow, The Age, 20 October,
http://www.theage.com.au/news/business/fools-gold-at-end-of-eastlink-
rainbow/2006/10/19/1160851066435.html
9You can also read