Socio-Economic Disadvantage and Health in Port Phillip and Stonnington - A Data Snapshot
←
→
Page content transcription
If your browser does not render page correctly, please read the page content below
Socio-Economic Disadvantage
           and Health
in Port Phillip and Stonnington
       - A Data Snapshot

                     For
   Cities of Port Phillip and
         Stonnington

          September 2011

               Prepared by

                16 St Vincent Street
             Caulfield East, Vic, 3145
               Tel/Fax 03 9571 6418
                Mob. 0409 301 441
        Email: resolvecc@optusnet.com.au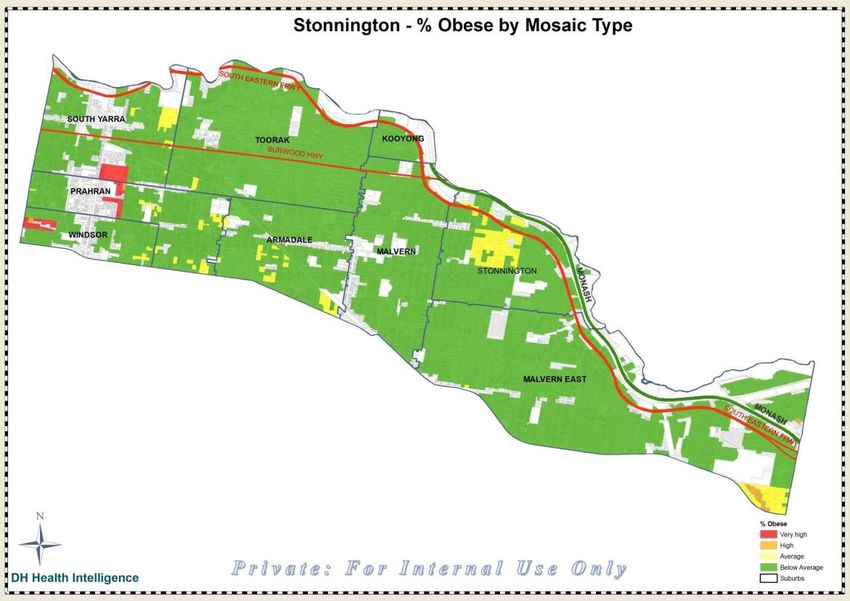
1. Introduction
This data snapshot has been prepared by Resolve Community Consulting based on
the data collected and included in the Cities of Port Phillip and Stonnington tender
application for the Federal Government’s Healthy Communities Initiative Grant (HCI).
The focus of the tender application requirements was on socio-economic
disadvantage and the health problems of obesity/overweight in adults. This
influenced the data presented and analysed in this Data Snapshot. Focussing on
socio-economic disadvantage in Port Phillip and Stonnington required a narrowing of
the lens to focus on specific pockets of disadvantage to demonstrate the need for
health programs for adults in these areas, particularly contrasted with the generally
wealthy healthy populations of these two LGAs. In analysing the socio-economic
data for these LGAs, it was evident that the highest areas of disadvantage were
found in areas of high concentration of public housing, particularly public housing
estates across both municipalities. This shaped the tender application and the data
presentation. This Snapshot is supplemented by a CD containing some of the raw
data collected through the tender writing process.

The data included in the HCI tender application is presented in this data snapshot
together with some additional data that was not critical to the HCI tender application.
It is anticipated that this Snapshot will provide a useful resource for both Councils to
use in planning, advocating and leading programs to support positive health
outcomes in areas of high disadvantage both through a successful outcome in the
HCI tender process and in other Council and community sector partnerships.

2. Demographic Data
2.1 Port Phillip/Stonnington Overview
The 2006 Census provides the following demographic data for Port Phillip (COPP)
and Stonnington (COS) (Table 1).

Table 1. Stonnington/Port Phillip Demographic Data (Census 2006)
LGA
                                                                                                   % Institutional
                                           % Indigenous

                                                                       % Aust. Born

                                                                                                                     population **
                                                                                                                     Institutional
         Population*

                                                          Indigenous

                                                                                      % O/s born

                                                                                                   population
                                % Female

                                                          Number -

                                                                                                                     Number -
                       % Male
         Total

COPP     85,012        50       50         0.3            235          59             27           5.3               4,353
COS      88,976        48       52         0.2            167          63             27           2.8               2,495

Figures 1 and 2 illustrate that Port Phillip/Stonnington have relatively young to middle
aged populations compared to the Melbourne average. This reflects the attraction of
these areas to residents of working age. Port Phillip has a slightly higher than
average proportion of people aged 50-84 than the Melbourne average. Both LGAs
have lower proportions of children than the Melbourne average.

    Page | 2 |                                 COPP COS Healthy Communities Data Snapshot |
                                                                         | September 2011 |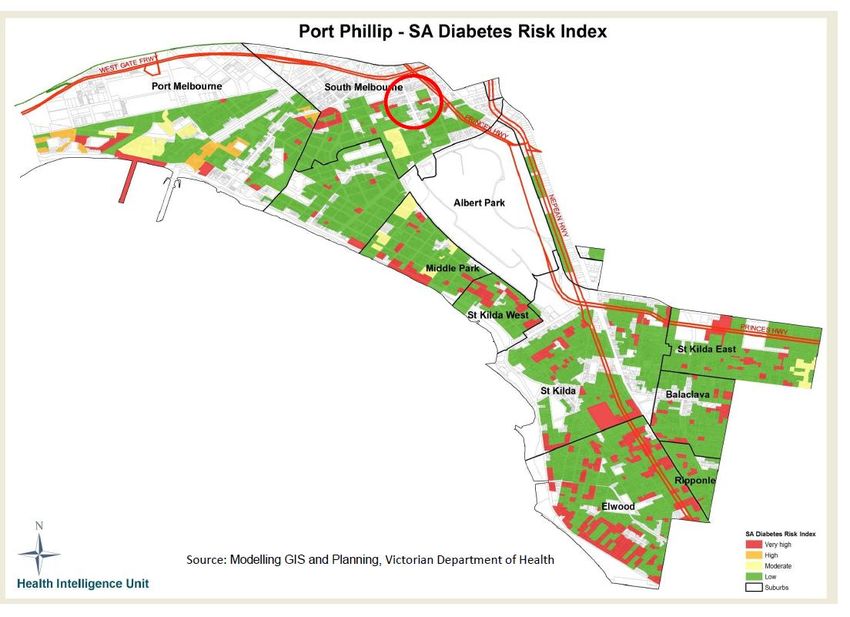
Figure 1.

Figure 2.

2.2 Public Housing
There are high numbers of public housing tenants living in both LGAs. Port Phillip
has the second highest number of public housing tenants in metropolitan Melbourne
at 3,815, second after Yarra (5,049)1. Stonnington ranks 14th highest on this list. The
combined total of public housing residents living in these LGAs is 5,577, higher than
any single metropolitan Melbourne LGA. Table 2 shows that there are 4,101 people
living in medium to high density public housing in these LGAs, many living on large

1
    Summary of Housing Assistance Programs 2009–10, Victorian Department of Human Services.

       Page | 3 |                                COPP COS Healthy Communities Data Snapshot |
                                                                           | September 2011 |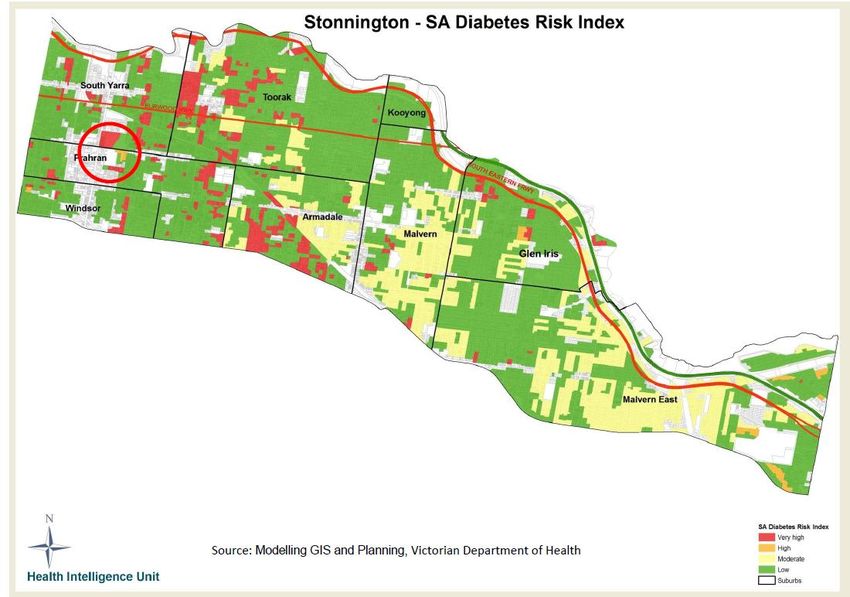
public housing estates such as Horace Petty in Stonnington which houses 1,169
tenants in 624 properties2.

Table 2. Victorian Government Owned Housing in Stonnington/Port Phillip3
    Region           Victorian Government Owned

                                                                                       Community
                                Semi-Det.

                                                                 High-rise

                                                                             Rooming
                     Separate

                                                      Low-rise
                                            Medium
                                            Density

                                                                             Rooms

                                                                                       Owned
                     House

                                House

                                                                             House

                                                                                                   Total4
                                                      Flat,

                                                                 Flat,
    COPP             78         119         538       1,134      805         630       505         3,815
    COS              18         6           195       639        790         64        44          1,762
    Total            96         125         733       1,773      1,595       694       549         5,577

3. Socio-Economic Data
3.1 SEIFA data
The Socio-economic Indexes for Areas (SEIFA) provides an index of relative
disadvantage across Australia drawn from the 2006 Census. SIEFA data is
available at a range of levels including local government area and census collector
district (CCD).

Overall SEIFA rankings are high for both LGAs at 1064.6 for Port Phillip and 1087.7
for Stonnington. However, there are pockets of extremely low SEIFA rankings in
each LGA. The CCDs with extremely low SEIFA rankings in Port Phillip/Stonnington
match to areas with large proportions of public housing residents and reflect some of
the highest disadvantage in Australia. In Port Phillip, 390 residents had the highest
levels of disadvantage with a SEIFA ranking of 500-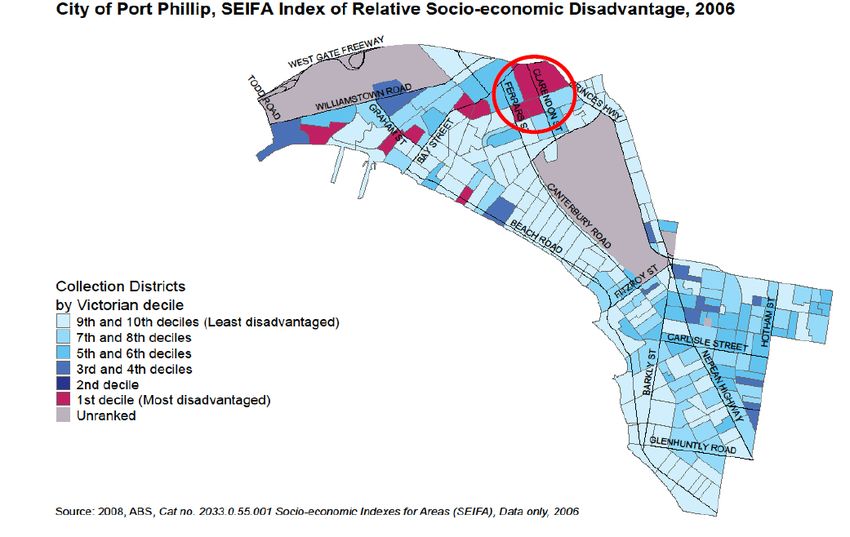
Figure 3. City of Port Phillip SEIFA Index of Relative Socio-Economic
Disadvantage 2006 (HCI target area highlighted)

Figure 4. City of Stonnington SEIFA Index of Relative Socio-Economic
Disadvantage 2006 (HCI target area highlighted)

   Page | 5 |                       COPP COS Healthy Communities Data Snapshot |
                                                              | September 2011 |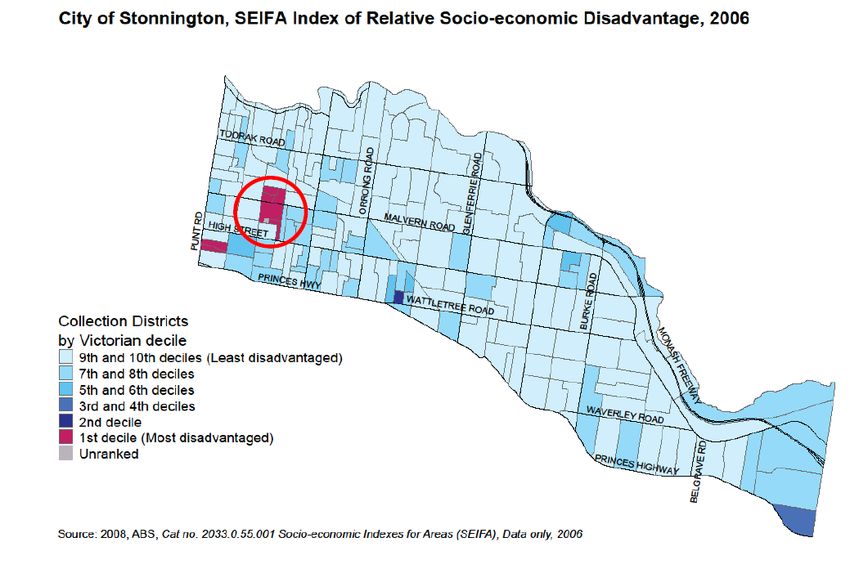
Figure 5 provides the SEIFA ratings for the CCDs targeted by the HCI submission,
compared to the overall SEIFA rating for COPP/COS. Note that the Horace Petty
estate covers three CCDS and the SEIFA rating is an average rating across the
three CCDs.
Figure 5. SEIFA Rating for Targeted Port Phillip/Stonnington CCDs

                             SEIFA Rating for Targeted CCDs, Port
                                     Phillip/Stonnington
  1200

  1000

   800

   600

   400

   200

     0
          Port Phillip LGA

                                                                                                                                                    CCD no. 2261413 includes social housing at 25-27
                               CCD no. 2281302 - includes Park Towers estate

                                                                               CCD no. 2281301 - includes Emerald Hill Estate

                                                                                                                                  Stonnington LGA

                                                                                                                                                                                                       Horace Petty Estate (average SEIFA rankign across
                                                                                                                                                                                                        CCDno. 2260811, 2260907, 2260909 - includes
                                                                                                                                                                King St and 21 Bangs St

                                                                                                                                                                                                                        the three CCDs)

A snapshot of the CCD with the lowest SEIFA ranking in Port Phillip/Stonnington
provides an example of the high level of disadvantage in these LGAs (see Figure 6).
This CCD includes the public housing estate Park Towers which has 229 dwellings.

   Page | 6 |                                                                                                                   COPP COS Healthy Communities Data Snapshot |
                                                                                                                                                          | September 2011 |
Figure 6. Profile of South Melbourne CCD No. 22813026
Profile of CCD No. 2281302 (%)
100
90
95
80
70
60
50
40
30 43 43
38 34
20
10 22
0
SEIFA data is based on place of usual residence. Port Phillip/Stonnington also have
a number of people experiencing homelessness and extreme socio-economic
disadvantage who would not be recorded in this data.
The Port Phillip Homelessness Action Strategy recognisees that data on
homelessness is currently “limited and dispersed across different data sets”, making
interpretation and comparisons difficult. This would also be the case in Stonnington.
The Strategy provides the Census 2006 data for the Inner Melbourne counting
district which includes Melbourne CBD, Yarra, Port Phillip and parts of Stonnington.
Data for individual LGAs was unavailable7.
160 people were in improvised homes, tents or sleeping outdoors;
630 people were sleeping crisis accommodation;
660 people were sleeping on friends’ or families’ couches; and
2,040 people were in boarding houses.
6
Census 2006
7
City of Port Phillip, 2008, Homelessness Action Strategy 2008-2013, p.12.
Page | 7 | COPP COS Healthy Communities Data Snapshot |
| September 2011 |3.2 Workforce Participation/Income support
Over 21,0008 people in Port Phillip/Stonnington population are in receipt of the main
Centrelink income support benefits including over 10,300 residents of working age
(see Figure 7). The majority these receive the Aged Pension (11,580) followed by
the Disability Support Pension (4,986) and Newstart (3,721).
Figure 7. Numbers of People in Receipt of Centrelink Income Support in Port
Phillip/Stonnington
Numbers of People in Receipt of
Centrelink Income Support in Port
Phillip/Stonnington
7,000
6,000
5,000
4,000
3,000 COPP
2,000 COS
1,000
0
NewStart Parenting Disability Aged Pension
payment single Support Pension
(DSP)
There is a high incidence of long term unemployment with 49% of Port Phillip
residents and 40% of Stonnington residents who are receiving Newstart having been
on the payment for over 12 months9.
8
Australian Bureau of Statistics, 2009 National Regional Profile: Port Phillip (LGA) and National Regional
Profile: Stonnington (LGA)
9
ABS 2009 Op. Cit.
Page | 8 | COPP COS Healthy Communities Data Snapshot |
| September 2011 |Table 4 shows the spread of Centrelink recipients over postcode areas in Port Phillip
and Stonnington. The highest number of DSP recipients across both municipalities
is in St Kilda/St Kilda West (1,076) as well as the highest number of Newstart
recipients (839). The second highest is number of DSP recipients across both LGAs
is in St Kilda East (603) as is the second highest number of Newstart recipients
(839). These two postcodes also have the highest number of Health Care Card
Holders. Windsor/Prahran postcode has both the highest number of DSP (629) and
Newstart recipients (467) in Stonnington followed by South Yarra (DSP=401 and
Newstart=374). These two postcodes also have the highest number of Health Care
Card Holders.
Table 4. Benefits by Postcode10
Postcode Name of suburb Newstart Parenting Parenting Disability Health
payment payment Support Care
single11 partnered Pension Card12
3004 Melbourne 60 20 20 66 162
3141 South Yarra 374 82 35 401 880
3142 Toorak 132 20 20 125 384
3143 Armadale 123 32 20 159 302
3144 Malvern 83 20 20 113 320
3145 Malvern East 202 64 25 369 805
3146 Glen Iris 256 71 21 276 899
3181 Windsor/Prahran 467 92 42 629 973
3182 St Kilda/ St Kilda 839 102 53 1,076 1,284
West
3183 St Kilda East 506 98 101 603 1,270
3184 Elwood 339 109 30 332 738
3205 South 248 103 21 522 525
Melbourne
3206 Albert Park 135 35 20 208 368
3207 Port Melbourne 275 124 20 578 652
Total 4,039 972 448 5,457 9,562
10
Centrelink December 2009, provided by ISEPICH.
11
All values of 20 represent >20.
12
Health Care Cards are available to certain recipients of benefits, low income earners and selected other
groups. Most people on pensions and some on NewStart (if over 60) would be eligible for a Pensioner
Concession Card (ie. they would not have a Health Care Card). Age pensioners would have Pensioner
Concession Cards, but some self-funded retirees could be eligible for Health Care Cards.
Page | 9 | COPP COS Healthy Communities Data Snapshot |
| September 2011 |4. Health Data
4.1 Overall Health in Stonnington and Port Phillip
Overall Stonnington/Port Phillip have relatively average levels or slightly lower than
average of health risk compared to the Melbourne Statistical Division (SD)13.
Despite this there is still a substantial number of adults aged 18+ across both LGAs
with at least one of four health risk factors - smoking, harmful use of alcohol, physical
inactivity, obesity at 39,172 for Port Phillip and 36,090 for Stonnington (see
Figure 8).
Figure 8. Health Risk Factors, COPP, COS, Melbourne SD (rate per 100).
Health Risk Factors, COPP, COS and
Melbourne (rate per 100)
60
50
40
30
20
10
0
Port Phillip
Stonnington
Melbourne (SD)
13
Social Health Atlas, 2010, Australian Bureau of Statistics.
Page | 10 | COPP COS Healthy Communities Data Snapshot |
| September 2011 |The usual daily intake of two or more serves of fruit is higher for children aged 5-17
than for adults across both LGAs reflecting general trends across the Melbourne
Statistical Division (see Figure 9).
Figure 9. Usual Daily Intake of Two or more Serves of Fruit for School-Aged
Children and Adults, COPP, COS, Melbourne SD (rate per 100).
Usual Daily Intake of Fruit, COPP,
COS, Melbourne (rate per 100)
80
70
60
50
40 Port Phillip
30
Stonnington
20
10 Melbourne (SD)
0
Usual daily intake of two+ Usual daily intake of two+
serves of fruit (5-17 year serves of fruit (18+)
olds).
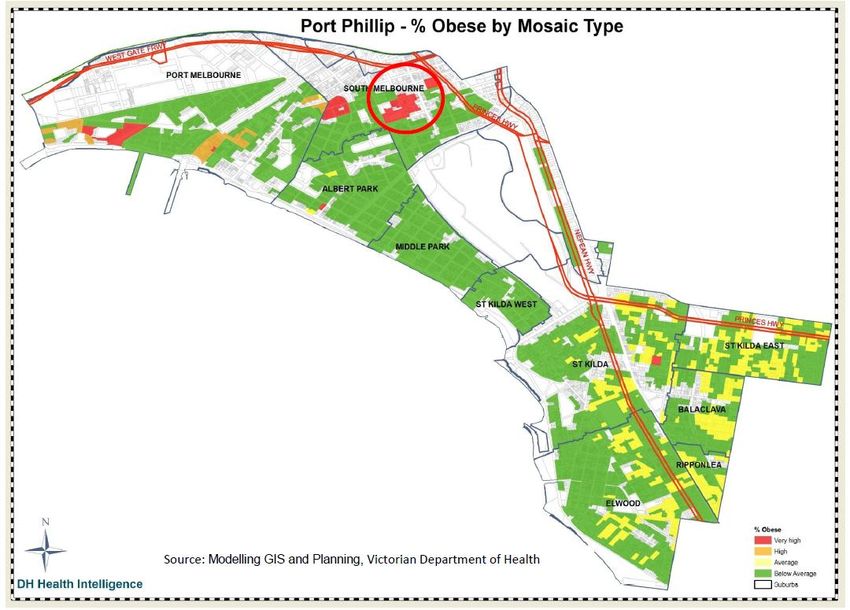
Victorian Department of Health data (Figures 10 and 11) demonstrates that Port
Phillip and Stonnington both have relatively low overall rates of overweight/ obesity
with some pockets of very high rates of overweight/obesity. These areas of very
high rates of overweight/obesity are located in the low SEIFA areas surrounded by a
generally healthy population. In addition, these are also areas of high rates of public
housing.
Figure 10. Percentage of Overweight/Obesity, Port Phillip
Page | 11 | COPP COS Healthy Communities Data Snapshot |
| September 2011 |Figure 11. Percentage of Overweight/Obesity, Stonnington
Very high diabetes risk is more widespread across both LGAs, both in pockets of
high disadvantage and in wealthier pockets of the LGAs (see Figures 12 and 13).
Figure 12. Diabetes Risk, Port Phillip
Page | 12 | COPP COS Healthy Communities Data Snapshot |
| September 2011 |Figure 13. Diabetes Risk, Stonnington
4.2 Health Characteristics of Disadvantaged COPP/COS Residents
An Inner South Community Health Service (ISCHS)14 client survey provides insights
into these pockets of poor health. The survey found:
87% of respondents were healthcare card holders compared with 6% for
Stonnington/Port Phillip overall;
41% of respondents lived in public housing;
Survey respondents reported having
o heart disease (18%)
o diabetes mellitus (15%)
o cancer (11%)
o emphysema and/or chronic bronchitis (11%)
o stroke (8%).
46% of respondents reported having depression and 43% reported having
anxiety.
38% of respondents smoked every day or every 2-3 days compared to 20-
22% for the Southern Metropolitan region (see Figure 14).
14
ISCHS Client Survey Project, 2009
Page | 13 | COPP COS Healthy Communities Data Snapshot |
| September 2011 |Figure 14. Proportion of ISCHS client survey respondents who smoke
compared to local area residents15.
Table 5 shows that healthy eating is a challenge for respondents with 38.5% usually
skipping breakfast and 35.1% skipping lunch. Only about half of respondents eat
fresh fruit and vegetables every day. 47.3% of respondents eat fresh fruit every day
compared with 54.0% of Stonnington residents and 51.8% of Port Phillip residents
overall16.
Table 5. ISCHS’ Client Nutrition
15
ISCHS op. cit.
16
Social Health Atlas, 2010, Australian Bureau of Statistics.
Page | 14 | COPP COS Healthy Communities Data Snapshot |
| September 2011 |Table 6 illustrates low levels of physical activity among respondents. The majority of
respondents (60.9%) never or rarely took part in brisk walking and 71.1% rarely or
never took part in moderate activity.
Table 6. ISCHS’ Client Exercise
5. Public Housing
5.1 Public Housing Data
People from non-English speaking backgrounds are highly represented in both
public housing statistics and diabetes admissions to hospital for over 65s in
Stonnington/Port Phillip, indicating high levels of disadvantage and chronic health
issues among this group (see Figure 15).
Figure 15. Port Phillip/Stonnington Country of Birth, Public Housing and
Diabetes Admissions (%) 17
Country of Birth (English or non-English speaking), Public
80 Housing and Diabetes Admissions
Percent of
70 population (all
60 ages)
50 Percent of OoH
40 residents
30
20 Percent of 65+
population
10
0
Percent of 65+
Australia or other Non-English Australia or other Non-English diabetes
English speaking speaking or not English speaking speaking or not admissions
(CoPP) stated (CoPP) (CoS) stated (CoS)
17
Population data on country of birth is from the Australian Bureau of Statistics 2006 census. Data on diabetes
admissions is provided by the Department of Health Southern Metropolitan Region Ambulatory Care Sensitive
Conditions data for 2008/09 financial year. Data on country of birth of residents in Office of Housing Dwellings
was provided to the City of Port Phillip by the Department of Human Services, Office of Housing in 2007.
Page | 15 | COPP COS Healthy Communities Data Snapshot |
| September 2011 |The data presented in this section is taken from a spreadsheet provided by Port
Phillip Community Group for the facilities managed on behalf of the Office of
Housing, dated 31 August 2009. The data below relates to housing estates within
the Cities of Port Phillip and Stonnington and may not include scatter-site public
housing. More data is available also for individual properties in the spreadsheet
(included on the CD).
Public housing tenants in COPP/COS are more likely to be aged 50 years old and
over (68%) with 55% aged 60 years and older (see Figure 16). Only 12% of public
housing tenants in these estates are aged under 20. These figures reflect the fact
that five estates are designated as Older Persons High Rise as well as a generally
older population in these estates overall. issues This has implications for the types of
programs, including health and physical activity programs, provided to these tenants.
Figure 16. Age of Public Housing Tenants in COPP/COS, %
Age of Public Housing Tenants, %
16 12 Under 20
5 20 to 29
30 to 39
6
40 to 49
23 9 50 to 59
60 to 69
70 to 79
13
80+
16
Page | 16 | COPP COS Healthy Communities Data Snapshot |
| September 2011 |There is a diverse ethnic mix among public housing tenants in COPP/COS (see
Figure 17). Only 28% of these tenants are of Australian background with the second
largest group making up people from the former USSR (27%) including Russia and
Ukraine. People from an Asian ethnicity make up 15% of tenants, including 5% from
Vietnam. Only 4% of tenants were from African backgrounds including Somalia,
Sudan, Ethiopian, Egypt and South Africa. This has implications for the way in which
information and programs are provided including cultural and language implications.
Figure 17. Ethnicity of Public Housing Tenants in COPP/COS %
Ethnicity of Public Housing Tenants, %
30 28 27
25
20
15
8 9
10 7
5 5 4
5 3 2 2
0
Figure 18 shows that 17% of tenants in COPP/COS are flagged as having a
disability. There is no more information on the type of disability available in this
dataset.
Figure 18. Public Housing Tenants in COPP/COS and Disability, %
Public Housing Tenants and Disability,
%
17
Disability - Yes
Disability - No
83
Page | 17 | COPP COS Healthy Communities Data Snapshot |
| September 2011 |PPCG prepared a brief data summary of three of the estates selected for the HCI
tender. This data summary is presented below.
City of Port Phillip
1. 332 Park St, South Melbourne (also known as Park Towers)
High rise
460 tenants,
Approx 2/3 are over 50
Ethnic spread (especially elderly Russian community)
Active Tenants Association
Have a community room
Have recently begun in the community room a tenant-initiated and run gentle
exercise group for older tenants in response to elderly people being overweight
Have an enclosed vegetable garden
2. 200 Dorcas Street, South Melbourne (also known as Emerald Hill Court)
248 tenants in main building – high rise
Other side of road there are walk ups – approx another 150 people. Total pop 350-
400.
Mixture of ages including families – teenagers and children
Mainly Australian born, but some Russian and other more recent arrivals
Have a Tenants Association
Have a community room
A collective of local organisations have been meeting for a few years developing
The Patch to help improve educational outcomes for young people on this estate
A community kitchen has recently begun in the community room
City of Stonnington
3. 21 Bangs Street and 25 and 27 King Street, Prahran
21 Bangs St has 240 tenants – good mix of ages. 45% are over 50
High rise building
21 Bangs St has no tenants association and tenants have been hard to engage
21 Bangs St has a flat set aside as a community facility
ISCHS are involved as have the Older Persons High Rise Support program worker
located at Bangs St.
NICA – National Institute of Circus Arts is nearby – has potential
25 and 27 King St are high rise
146 tenants at 25 King and 135 at 27 King St.
All tenants are over 50
Very good large open community facilities
Lots of activities in community rooms
Especially 27 King St are open to people from outside the estate engaging with
them. 27 King is between 25 King and 21 Bangs St.
Page | 18 | COPP COS Healthy Communities Data Snapshot |
| September 2011 |The Department of Human Services provided a Community Snapshot prepared for
the Prahran Urban Renewal Project and a spreadsheet providing more detailed data
about tenants on the Horace Petty Estate in South Yarra in Stonnington. These files
are included in the CD. Some of the data is presented below.
Overview of Horace Petty Estate (HPE)
HPE currently has 624 one, two and three bedroom units.
217 units in 9 walk-up buildings, 397 units in high rises, 10 units in two storey
townhouses
This is set to expand with 188 new single and 2 BR units to be completed by the
end of 2012.
Housing Profile:
The HPE houses 1169 clients in total. A significant proportion of residents have
lived on the estate for more than 20 years (18%)
Age structure:
the largest age group is the 65+ years bracket at 380 residents (33%), which is
much higher than the overall proportion COS residents in this age group (11.8%)
The second largest population group is 40-54 years at 205 residents (18%).
Analysis indicates that HPE has a total working age population of 49.23%
Household Structure:
Although the predominant family type in HPE is older single (37%) there is a
significantly high proportion of sole parent families (14%) with dependants under
15 years
Tenure:
According to recent data there is a low turnover of tenancy.
Income and Centrelink Payment:
The majority of the population is in receipt of a Centrelink payment.
53% of tenants earn less than $250 per week as compared to the rest of the State at
32%.
The predominant income type is Aged Pension (36%), followed by Disability
Support Pension (21%), Newstart (7%), Parenting Payment (6%) and Youth
Allowance (5%)
Cultural Diversity:
There are 70 different nationalities on the estate.
The main countries of origin are Australia (35%), the Former USSR (23%),
Vietnam (6%), and China (2%).
Although English is the preferred language (62%), 38% of residents speak another
language at home.
Internet Connection:
61% of households have no internet connection as compared to 30% of the rest of
Stonnington.
Labour Market Information:
80% of residents are considered ‘workless’ (in receipt of a Centrelink payment
however not looking for work) as compared to the rest of the Victoria (39% - ABS
2006)
The Stonnington unemployment rate is 2.7%, compared to the rest of the state
5.5%
Page | 19 | COPP COS Healthy Communities Data Snapshot |
| September 2011 |5.2 Health, Public Housing and Stress
A recent Monash University student study18 into stress, obesity and public housing
included surveys of residents at two of the housing estates targeted by the
COPP/COS HCI application as well as three other properties in COPP/COS. The
objectives of the project were:
To provide people in public housing with knowledge on healthy eating by
showing an example of simple healthy morning tea
To increase awareness on stress and coping
To begin to understand the potential link between chronic stress, poor health
behaviours and obesity in public housing
The students surveyed 29 people living in public or community housing in Port Phillip
and Stonnington. The study found high rates of chronic stress and
obesity/overweight in public housing residents with 69% (of 29 respondents)
recorded as obese/overweight. The study recommended the following strategies:
stress management
exercise programs
education on healthy eating including on low income
Integrating programs for maximum effect.
A PowerPoint presentation about this research is included on the CD.
6. Conclusion
This data snapshot provides a summary of the relevant health and socio-economic
data used to prepare the COPP/COS Healthy Communities tender. It effectively
illustrates the health inequalities for people living in public housing estates in
COPP/COS. Additional data is available on disadvantage and on health indicators in
COPP/COS that may be useful in supplementing this snapshot. This would include
disadvantage other than that found in public housing, including the homeless
population in both LGAs and low income private renters. However it is anticipated
that this document will provide a useful resource to support the implementation of the
HCI should it be successful and to be used in planning and other tender/grant
application processes of a similar nature.
18
Stress, health behaviours and obesity: An Investigation, 2011 (unpublished), K. Luthra and J. Hauptman.
Monash Medical Student Research Project.
Page | 20 | COPP COS Healthy Communities Data Snapshot |
| September 2011 |You can also read