2020 HURRICANE GUIDE How to Move from "React and Respond" to "Prepare and Serve" this Hurricane Season - Insurity
←
→
Page content transcription
If your browser does not render page correctly, please read the page content below

2020 HURRICANE GUIDE
How to Move from “React and Respond” to
“Prepare and Serve” this Hurricane Season

Table of Contents
Introduction: How to Move from “React and Respond”          2
to “Prepare and Serve”
2020 Hurricane Season Forecast                              3

Pre-event: Plan Now for Fewer Downstream Costs Later        4

Pre-event: Best Practices Checklist                         5
Hurricane Data Available to Insurity Clients                7

During: Understand Your Actual Exposure and Make Sense      8
of All the Data
During: Best Practices Checklist                            9
Gaining a Complete View of Risk Means Leveraging Multiple   10
Sources of Data

Post-event: Use Post-event Data and Visual Analytics        11
to Understand Potential Losses and Quickly Respond to
Claims
Post-event: Best Practices Checklist                        11

Conclusion: Shine in the Eyes of Your Customers with Data   12
and Analytics that Work for You

                                        1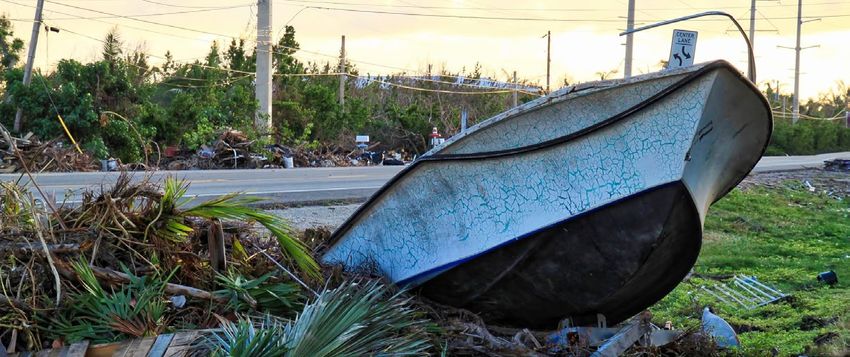
Introduction: How to Move from “React and Respond”
                          to “Prepare and Serve”

                          Hurricane season brings with it much more than the hurricanes themselves: inland flooding, wind,
                          storm surge, hail, and even tornadoes. Beyond the loss exposure, insurers must deal with operational
                          and organizational strain. It’s a season when, perhaps more than any other, insurers need to have their
                          proverbial “ducks in a row.” This means preparing now for the possibility of the worst.

                          Globally, tropical cyclone is the costliest peril. The aggregated payouts from heightened tropical
                          cyclone/hurricane activity in 2017, 2018, and 2019, accounted for 36 percent of the last 20 years’ worth
                          of payouts for the peril—and 12 percent of all payouts for all perils since 2001.

                                                           Cumulative Insured Loss by Peril

                    500          Tropical Cyclone
                                 Severe Weather                                                                                                446
                                 Flooding
                    400          Earthquake
                                                                                                                                               359
                                 Drought
                                 Winter Weather
2019 USD Billions

                    300          Wildfire
                                 EU Windstorm
                                 Other

                    200                                                                                                                        188

                                                                                                                                               102
                    100

                      0
                          2000     2001 2002 2003 2004 2005 2006 2007 2008 2009 2010   2011   2012   2013   2014   2015   2016   2017   2018   2019

                          Bottom line, risk is evolving and preparedness must evolve with it in order to provide timely response
                          and meet ever-increasing customer demands.

                                                                             2
Speed Matters During Live Events

How effectively you prepare for and respond to hurricanes can either be an asset to your
business or a detriment. By moving from “react and respond” to a more proactive “prepare and
serve” approach, you can meet the growing demands and expectations of your customers and
shareholders. To do so, streamlined access to expert data and advanced analytics as events
unfold is imperative to managing costs and customer satisfaction. Case in point, Texas and
Florida have shown declining customer satisfaction scores in the aftermath of weather-related
events according to a 2018 JD Power claims study.

Customer and shareholder expectations are growing, and your event response operations
must keep pace in order to effectively compete.

Use the data and analytics best practices in this document to help your team prepare now. As
always, if you’re an Insurity client, be sure to tap into the wealth of insurance expertise and
knowledge that our team can provide.

  The 2020 Atlantic hurricane
  season is expected to
  be “above average” and
                                            2020                        Hurricane Season
                                                                        Outlook

  potentially very active
  due to high sea surface
  temperatures that create                   13-19
                                                 Named storms
                                                                                 3-6
                                                                              Major hurricanes
  fuel for developing tropical
  storms.

                                                 6-10
                                                  Hurricanes

                                            Source: NOAA 2020 Atlantic hurricane forecast

                                             3
Pre-event: Plan Now for Fewer
Downstream Costs Later

Now is the time to make sure you have the capacity to handle what Mother Nature throws
your way this season, including using historical data to conduct dry runs (see page 6). It’s
also important to ensure your data licensing is in place for third-party data providers and
modelers. For example, during hurricanes Michael and Florence many of our clients had
access to event footprints as they became available from data providers like NOAA, JBA,
KatRisk, and Impact Forecasting. These up-to-date footprints coupled with policy exposed
limits (PEL), helped insurers understand actual exposure and focus their response efforts.

Take a look at the following best practices. How many boxes can you check?

                                              4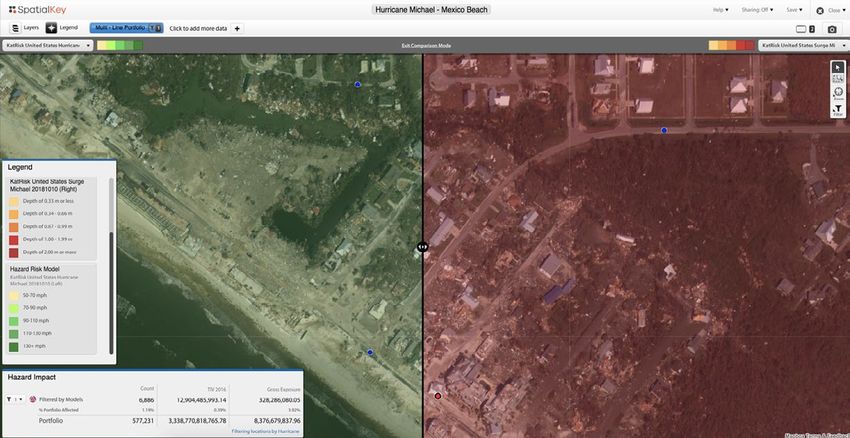
Pre-event: Best Practices Checklist
Know where to go for your policies in-force: Anticipate the questions you’ll be under
pressure from management to answer,
Which systems house the most up-to-date
view of policies in force (PIF), and what such as:
is the process for getting your hands on What is our loss potential?
them?
Do we have adequate reserves and
Assess your analytic capabilities: reinsurance in place?
What tools do you have at your disposal to Which major contracts, companies, and/or
understand at-risk properties and what are clients are at risk?
the caveats of those tools? For example,
can you account for actual exposure, not Do we have a communication strategy to
just number of properties or TIV? begin outreach for insureds most at risk?
Renew or expand third-party data Evaluate considerations beyond the property
licences now: level, such as:
Assess your data licensing and access to Business interruption (BI): For example, the
inland flood, storm surge, and wind event building is fine, but flyover data shows the
footprints (see chart on page 7). road to get there is flooded.
Know how you will use this data to Agreements: Does the client’s contract
formulate your response and communicate have mitigation requirements?
potential exposure to your stakeholders.
Coverage: Are there coverage exclusions
Know what partners to have on speed dial that should be considered prior to the
and where you can source innovative data event making landfall (e.g. all distribution
and information you haven’t anticipated. trucks must be moved to a specific “higher
ground” garage).
Have a pre-approved contingency budget
in place for data and analytic needs. Every
event is unique and there are pieces of
information that you may not anticipate.
For example, will you need post-hurricane
flyover imagery to begin addressing
business interruption or additional living
expenses (ALE) for policyholders?
5
How to Conduct a Hurricane Dry Run
Stress test with past scenarios to gain insight Analytic and geospatial tools that are critical to
into the composition of a portfolio of risks to maximizing your insights include the ability to:
identify the location characteristics likely to
Filter by wind speed, flood depth, etc.
drive loss, and the impact it will have on your
teams: Assess proximity with distance and radius
tools
Use past hurricane events to understand
the holes in your processes as well as your View and filter highest value properties and
organizational triggers (i.e. Do you know associated building characteristics
what constitutes an “event” and when to
start pulling in other representatives within View before and after event satellite
your organization?). imagery to identify potential claims hot
spots
Visualize your portfolio performance
against your past hurricane claims Visualize storm track and windfields
experience and exposure data, then
Calculate potential exposure, net of policy
develop risk mitigation measures.
structures
Perform “what-if” analyses to see how Compare multiple modeler views of risk
a historical hurricane would impact your side-by-side
portfolio today:
Walk through your process for accessing
What would have happened if Hurricane
data in your systems and using your available
Irma had hit Florida’s east coast as
predicted instead of veering to the west? analytic tools:
Consider what would happen if another
Know where to go for your in-force policies.
Harvey hit (with this wind speed or storm
surge at landfall, we can expect X losses)? Know the steps to get external or third-
party data approved and loaded as it
What if an event closed down your
becomes available.
home office? What’s the process for
redundancies? Can you still serve your Know how often to expect third-party data
clients, and what are your vulnerabilities for updates.
handling the influx of claims, etc.?
Know how to estimate your actual
Modify historical and active storm tracks to exposure.
analyze possible exposures.
Now, go fetch a current view of your PIF,
Display the storm track and its wind
speeds. trigger moratoriums, stage adjusters and
claims vehicles, quantify potential losses to
management, and send mock notifications
and updates to policyholders, insureds, and
clients.
6
Hurricane Data Available to Insurity Clients
During 2018’s hurricane season, Insurity clients using our SpatialKey solutions were able to
access 50+ ad-hoc datasets from expert providers like KatRisk, JBA, Impact Forecasting,
NOAA, and a host of others. Tell us the data you need, and we’ll do our best to expedite
your request.

Data                Flood depths         Wind          Event           Aerial          Data
Provider            (inland & surge)                   footprint       imagery         updated

NOAA                                                                                   Every 4 hours

FEMA                                                                                   Post event (only
                                                                                       if FEMA releases
                                                                                       for an event)

JBA                                                                                    As available

KatRisk                                                                                As available

Impact                                                                                 As available
Forecasting

Ad-hoc client                                                                          As available or
requested                                                                              as requested

Interested in integrating any of this data? Or do you have other data needs? Reach out to
your Insurity account manager, or contact us at info@insurity.com

                                             7
During: Understand Your Actual
Exposure and Make Sense of All the
Data
Now that you have procured access to all the data you’ll (hopefully) need, it’s time for the
hard part: making sense of it. Even with the best technology and in-house GIS experts at
your disposal, hurricanes can create a scramble. But, the job of operationalizing data (or
transforming data from all these disparate, expert sources into usable formats) and then
extracting actionable insight from it, is more efficient with the SpatialKey Event Response
solution. This is when having an outsourced solution with a dedicated data team removes
the technical and time-consuming burden of working with massive streams of complex
hazard and event data.

Your Insurity account manager can work with you and advise you on ways to manage
working with sophisticated data from multiple providers—so you can save time and get to
the work of understanding and executing on what all the data actually means!

                                               8
During: Best Practices Checklist
Check for regular data updates: providers (e.g. more complex shapefiles
require pre-processing).
Know when to expect updates from
various data providers. Be sure to check Ensure you have the in-house GIS
the SpatialKey Data Mart regularly, and expertise to work with complex
monitor your email for notifications and and sophisticated data, or consider
updates. outsourcing to your solutions provider.
Follow weather-related Twitter accounts like: Make certain your system can handle
more demanding thresholds (e.g. more
National Weather Service (@nws) people trying to use the system during an
event, loading of complex and large file
NOAA (@noaa) formats, etc.).
National Hurricane Center Atlantic Ops Consider your integration set up and APIs:
(@NHC_Atlantic)
With more data and more sophisticated
The Weather Channel (@weatherchannel) data flowing in, you need to know if your
integrations have the capacity to keep up.
FEMA (@fema)
Don’t fall victim to analysis paralysis:
Ensure you can understand actual exposure:
Tap into the industry expertise your
Pinpoint areas with high concentrations
account manager can provide, such
of risk and understand actual exposure,
as helping to interpret variations and
not just TIV.
nuances in models and event footprints.
Turn around event footprints and models Use a geospatial analytics solution like
quickly: SpatialKey Event Response to help you
“move the levers” and understand your
As data becomes available, ensure you’re sensitivity to model outputs.
able to get it into usable formats.
Don’t underestimate the complexity and
time required to transform file formats
and load sophisticated data from multiple
9Gaining a Complete View of Risk Means
Leveraging Multiple Sources of Data
“How can I gain a more complete understanding of risk?” is a question many of our clients
ask during events. The answer: SpatialKey Event Response allows you to pull together
multiple sources of data into a single session for a more complete view of risk. The ability
to compare multiple hazards and/or models in one place is increasingly important with
complex events like hurricane. By coupling NOAA aerial imagery with KatRisk’s surge
and wind layers, you can understand the drivers behind the losses in the Mexico Beach
example shown below. Even the properties that are still standing may have extreme flood
damage due to flooding from surge. Your Insurity account manager can be instrumental
in helping you access expert data, interpret it, answer critical questions, and use their
industry knowledge to apply the intelligence.
Our “comparison slider” tool shows KatRisk’s Hurricane Michael wind footprint on the
left and KatRisk’s Hurricane Michael surge footprint on the right for Mexico Beach. Both
footprints are overlaid with NOAA’s post-event aerial imagery.
10Post-event: Use Data and Visual
Analytics to Understand Potential
Losses and Quickly Respond to Claims
Immediately following an event, it’s important that you have the data and analytics in place
to understand and gain an accurate idea of potential concentrations of loss. This information
helps you anticipate the extent of claims and pinpoint exactly where those claims will be
coming from—without the need to have boots on the ground to get initial estimates. SpatialKey
Event Response can provide you with “ground truth” data such as FEMA, as well as aerial
imagery and analytics, to help you formulate your claims response and deployment as well as
investigative efforts.
Post-event: Best Practices Checklist
Respond to claims faster and estimate Conduct an end-of-season historical
losses with the right data: analysis/audit:
Again, access to data is paramount. Understand gaps in your processes,
For example, the ability to bring in analytic tools, data, and concentrations
aerial imagery data may help you
of accumulations so that you can spot
pinpoint potential claims and more
accurately assess damage before trends and make changes prior to next
claims are even filed. season:
Plan a debrief immediately following How quickly were you able to
generate an accurate estimate of
each event:
losses?
Discuss what went well and where
Were you satisfied with the data
improvements can be made.
and analytics that helped inform
Consult with trusted advisors: your claims responsiveness and
accuracy?
Tap into industry experts, such as
your Insurity account manager, who How satisfied were your customers
can provide added perspective with your responsiveness?
and suggestions for improving Are your risk accumulations at
your process, data sources, and acceptable levels in hurricane-prone
share how the rest of the market areas?
responded.
How will the impact of this
Assess and review vendor performance: season’s hurricanes influence your
underwriting pricing and strategy?
Which solutions providers shined
and who wasn’t as responsive or
attentive to your needs?
11Conclusion:
Shine in the Eyes of Your Customers with
Data and Analytics that Work for You
Having a robust data and analytics solution that goes beyond public or open source data and
simple analytics is absolutely paramount during these large-scale events. With data and analytics
that work for you, you’ll be able to demonstrate the strength of your service and insurance
program.
The SpatialKey Event Response solution can create operational efficiency that enables your
team to focus on what matters: providing exemplary customer service. Insureds will judge their
insurance investment based on your level of response. SpatialKey Event Response enables you
to be more precise and proactive with your outreach. So when the time comes for your customers
to make renewal decisions, your new level of service will ensure solid retention.
Interested in learning more about streamlining your event response processes?
Download our latest guide for P&C insurers: How to Make Your Event Response
Operations Run Like Clockwork.
12Insurity is a leading provider of cloud-based core system solutions and data analytics for the
world’s largest insurers, brokers, and MGAs. Through its best-in-class digital platform and with
unrivaled industry experience and thought leadership, Insurity is uniquely positioned to deliver
exceptional value, empowering clients to focus on their core businesses, optimize their operations,
and provide superior customer experiences. With users worldwide and more cloud-based
deployments than any other core system provider in the insurtech space, Insurity is trusted by 15 of
the top 25 property/casualty carriers in the US. For more information, visit www.insurity.com.
Contact us to learn more about Insurity’s industry-leading geospatial analytics solutions and how
SpatialKey Event Response can help make your event response operations run like clockwork.
+1 866 476 2606
www.insurity.com
© 2020 Insurity, Inc. All rights reserved.You can also read