Greater London Authority Datastore - COVID-19 Mobility Report - Open Data ...
←
→
Page content transcription
If your browser does not render page correctly, please read the page content below
Greater London
Authority
Datastore -
COVID-19

Mobility Report

                  1
Greater London Authority Datastore - COVID-19 | Mobility Report
Executive Summary
In the early days of the pandemic, the Greater London Authority Datastore published the COVID-19
Mobility Report, a resource updated daily to provide insight into the changing mobility dynamics in
London. While the Datastore can be considered a relatively early adopter within the open data movement,
prior to the pandemic it had primarily relied on data generated from the public sector to fuel its reports
and open datasets. Powered by five private-sector mobility datasets and one public-sector data source,
the Datastore’s COVID-19 Mobility Report offers a case study of how the public sector can rapidly adopt
new types of data from alternative sources in times of great urgency.
Problem at Hand
With over 1,500,000 confirmed COVID-19 cases and over 55,000 deaths as of November 24 2020, the
United Kingdom has the highest case fatality rate (3.6%) in all of Europe.1 Following the country-wide
lockdown imposed on March 23, mobility across the United Kingdom sharply decreased, bottoming out
1. Johns Hopkins Coronavirus Resource Center. “Mortality Analyses,” March 10, 2021. https://coronavirus.jhu.edu/data/mortality.
2Greater London Authority Datastore - COVID-19 | Mobility Report
at an 80% nationwide decrease in average mobility in the month of April.
These sharp decreases in mobility and its impact on consumer spending and productive output led to
economic hardship for people and businesses across the United Kingdom. The country experienced
the largest contraction of GDP throughout Europe in the second quarter of 2020 (-20.4%).2 London was
especially impacted economically, with unemployment claims rising by 146%, compared to a national
increase of 107%.3
To better understand rapidly evolving dynamics of mobility during the pandemic, the Greater London
Authority (GLA) turned to their City Intelligence Unit to compile mobility datasets and analyses
demonstrating the pandemic’s impact on mobility-related issues, such as transportation, retail and
recreation, and labor trends. These reports are hosted on the GLA Datastore.
Project
The COVID-19 Mobility Report is hosted by the London Datastore, an open-source platform for freely
accessing data that is relevant to the city of London. Currently containing over 6,000 datasets, the
Datastore provides researchers, businesses, developers and everyday citizens data to better understand
London and tackle civic challenges and opportunities related to the city. Beyond simply serving as a
database, the London Datastore provides users with additional information and context as to how data
can be applied for civic, research and economic development purposes.
The Datastore collates datasets and produces reports drawing from a variety of public and private
datasets. Its primary areas of focus fall into the following categories:Jobs And Economy;
• Transport;
• Environment;
• Community Safety;
• Housing;
• Communities;
• Health; and
• London as a World City.
Managed by the GLA—an administrative body controlled by both the Mayor of London and the London
Assembly—the Datastore also serves as a publicly accessible repository of the datasets generated by
the GLA itself from projects related to the everyday governing of the Greater London area.4 In addition to
providing resources to the general public through its website, the Datastore also serves specific civic and
public-sector stakeholders, including 33 administrative boroughs,5 London-based charities, the United
Kingdom’s central government, and specific government agencies such as Public Health England.
2. “Coronavirus: UK Worst Hit among Major Economies.” BBC News, August 26, 2020, sec. Business. https://www.bbc.com/
news/business-53918568.
3. Norman, Amy, and Scott Corfe. “Lockdown in London: Tracking the Impact of Coronavirus on the Capital’s Economy.” Social
Market Foundation, July 22, 2020. https://www.smf.co.uk/publications/lockdown-in-london/.
4. European Commission. “The Greater London Authority (GLA).” Text, December 13, 2017. https://ec.europa.eu/growth/tools-da-
tabases/regional-innovation-monitor/organisation/greater-london-authority-gla.
5. Including the City of London
3Greater London Authority Datastore - COVID-19 | Mobility Report
As COVID-19 cases began to rise throughout the United Kingdom and London, the Greater London
Authority along with key Datastore stakeholders began to seek insights into how Londoners’ mobility
was changing, and whether the United Kingdom-wide lockdown (implemented March 23) was driving
compliance.6 In response to this demand, the Datastore launched the COVID-19 mobility report in March
2020, the first of over 20 COVID-19 resources listed by the Datastore, addressing topics ranging from
case and death counts, to reports on socioeconomic impacts of the pandemic within Greater London.
The COVID-19 Mobility Report draws from six private and public mobility data sources to provide
situational awareness on five key metrics tied to mobility:
• Public Transit Ridership;
• Pedestrian Activity;
• Retail and Recreation;
• Home Working; and
• Demographics.
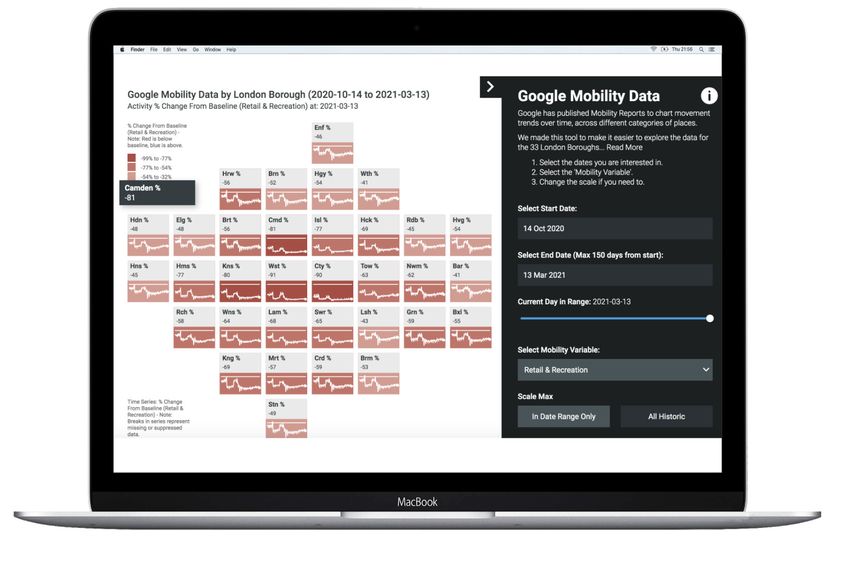
The report provides static visualizations to demonstrate the evolving mobility dynamics throughout the
pandemic for each category, while also providing daily updated downloadable datasets in CSV format
which aggregate data from each provider across each category.
Data Assets
The COVID-19 Mobility Report uses six datasets, five from private-sector sources and one public-sector
source, Transport for London, as detailed below:
• Google: Google’s COVID-19 Community Mobility reports are used by the Datastore for developing a
number of metrics, including usage of public transportation, pedestrian activity, retail and recreation
activity and home working trends. Google calculates changes in mobility by measuring the number
of visits to key points of interest, such as transportation stations, retail stores, and public parks.
Google collects first-party data both through smartphone applications (e.g. Google Maps) and
directly through the operating system of Android devices. It is then able to overlay GPS data on
points of interest to calculate the number of visits and changes over time. Google Community
Reports are provided in aggregate format by geographical region.7
• Apple: Apple’s Mobility Trends reports are used by the Datastore to measure changes in use of
public transportation and pedestrian (walking) activity. Apple collects this first-party data through the
Apple Maps application, which records location when directions requests are inputted into the app.
Apple uses differential privacy techniques to ensure that location data cannot be tied to an
identifiable device internally. They also aggregate all data at a regional level before sharing it
externally.8
• Purple: Purple is a connectivity and analytics company that provides guest Wi-Fi services for public
and commercial points of interest, while also compiling data on wi-fi usage for analytics purposes.
6. The Independent. “Timeline of Key Coronavirus Events since the UK Was Put into Lockdown Six Months Ago,” September 23,
2020. https://www.independent.co.uk/news/uk/home-news/coronavirus-uk-timeline-lockdown-boris-johnson-pubs-test-and-
trace-vaccine-b547630.html.
7. Google. “COVID-19 Community Reports Mobility Report CSV Documentation.” Google, March 2021. https://www.google.com/
covid19/mobility/data_documentation.html.
8. Apple. “COVID‑19 - Mobility Trends Reports.” Accessed March 10, 2021. https://www.apple.com/covid19/mobility.
4Greater London Authority Datastore - COVID-19 | Mobility Report
According to the Datastore,
“Purple gathers data from users registering with the public WiFi hotspots they
manage, plus footfall from anonymous users at some locations. Registered users
provide demographic information, and the data are subsettable by industry
sector. The locations of hotspots, and therefore the metrics, tend to be biased
towards commercial centres. The data are compared to a baseline of the nine
weeks from Jan 13 2020.”9
Unlike other mobility data providers, which only collect location coordinates and anonymized user
IDs, Purple collects Personally Identifiable Information (PII). This information, such as name, email
address, and additional demographic information is considered to be sensitive from a privacy
perspective.10
• CityMapper: CityMapper is a transportation and navigation app that allows users to find directions
and plan trips. CityMapper provides a mobility index for COVID-19 analyses by comparing all trips
planned by users of the app with trips during pre-COVID times to create a relative index of mobility.11
According to its privacy policy, CityMapper collects users’ locations when they use the app, but it
doesn’t not provide clear paths for opting in or out of data collection.12
• OpenTable: OpenTable, the restaurant reservation app and website, provides an index showing how
rates of reservations have changed during COVID-19 as compared to activity for the same dates in
2019.13 Data is fully aggregated, and the only indication of location at the point-of-interest level for
the restaurants.
• Transport for London: Transport for London provides data on how ridership of the Bus and Tube
in London has changed year-over-year during COVID-19. Ridership data is collected directly by
Transport of London. During COVID-19, boarding guidelines for bus passengers temporarily changed
to no longer require users to tap their cards during the months of April and May.14
Design
At the outset of the COVID-19 Mobility Report project, the Datastore team initially sought public-sector
transportation usage data from Transport for London (TFL), the transportation authority for the city of
London. While TFL were able to provide limited data for the first several months of the pandemic, there
was a general lack of granularity and timeliness in data updates (this was resolved in December 2020,
when TFL began providing more detailed, regularly updated data).15
With an acute need for royalty free, daily updated data, the Datastore turned to Google’s COVID-19
Community Mobility Reports and Apple’s Mobility Trends. In addition to providing real-time insights,
an added benefit of these sources for the Datastore was the ability to compare mobility trends across
different cities in the United Kingdom while using the same datasets with consistent collection and
processing methodologies. According to the Datastore team, such comparative analysis would be difficult
to complete using data from Transport for London, since it is by design solely focused on the Greater
London area. To enrich their mobility analyses, the Datastore also gathered data from CityMapper, as well
9. London Datastore. “Coronavirus (COVID-19) Mobility Report.” Accessed March 11, 2021. https://data.london.gov.uk/dataset/
coronavirus-covid-19-mobility-report.
10. GDPR.eu. “What Is Considered Personal Data under the EU GDPR?,” February 1, 2019. https://gdpr.eu/eu-gdpr-personal-data/.
11. Citimapper. “Citymapper Mobility Index.” Accessed March 11, 2021. https://citymapper.com/cmi/about.
12. https://global-api.citymapper.com/resourceproxy/privacy-policy.html
13. Citimapper. “Citymapper Mobility Index.” Accessed March 11, 2021. https://citymapper.com/cmi/about.
14. GOV.UK. “Transport Use during the Coronavirus (COVID-19) Pandemic.” Accessed March 11, 2021. https://www.gov.uk/gov-
ernment/statistics/transport-use-during-the-coronavirus-covid-19-pandemic.
15. Transport for London. “What We Do.” Accessed March 11, 2021. https://www.tfl.gov.uk/corporate/about-tfl/what-we-do.
5Greater London Authority Datastore - COVID-19 | Mobility Report
as Purple and Opentable for insights on how retail, restaurants and “high streets” activity was impacted by the
pandemic and mobility restrictions.
To receive row-level aggregated data, the Datastore entered into royalty-free license agreements with all data
providers, which, in turn, share daily updated aggregated data feeds through GitHub. The Datastore team
also has direct contact with representatives from Purple, CityMapper, and OpenTable in order to facilitate data
sharing and analysis. In parallel to their engagement with these data providers, the Datastore also historically
has worked with telecommunications data, but they are restricted from making derivative datasets publicly
available by the telco providers.
The Datastore combines these datasets and provides visualizations on their website, along with daily updated
downloadable CSV files. Since these datasets combine various data sources with different collection and
preprocessing methodologies, the Datastore provides its users with the following disclaimer:
“These sources have differences in how the data are put together, the users who
provide the data, and the exact areas they cover, meaning they won’t represent
London’s population as a whole and can’t always be compared directly with each
other. For example, some data sources normalise so that week/weekend cycles aren’t
included, and others don’t.”16
As with all other initiatives, the Datastore’s COVID-19 Mobility Report follows internal ethics guidelines to
determine what data can be publicly shared. According to the Datastore team, all personnel undergo ethics
and privacy training, and the Datastore as a whole follows the United Kingdom Statistics Authority’s Voluntary
Application of the Statistics Code of Practice.17
Analysis & Insights
As expected, the Datastore’s Mobility Reports show a sharp drop in overall mobility and visitation to many
retail and recreation points of interest throughout the pandemic, with the most dramatic drops occurring
during the spring and more recent November lockdowns.18 Several points of interest types—such as grocery,
pharmacies, and parks—have experienced heightened activity throughout the pandemic, with parks activity
peaking during warm summer months. Throughout the pandemic, there has been a sustained increase in
working from home over workplaces. Though this gap tightened slightly in summer months, it again widened
during the November lockdown in the United Kingdom.19
Outputs and Intended Outcomes
With the United Kingdom entering a second national lockdown on November 5, the Datastore’s COVID-19
Mobility Report continues to be a relevant public resource on the pandemic’s effects in London as of the
time of writing.20 In addition to providing situational awareness to the GLA’s primary stakeholders, including
16. Greater London Authority. “Coronavirus (COVID-19) Mobility Report - London Datastore,” March 10, 2021. https://data.london.gov.
uk/dataset/coronavirus-covid-19-mobility-report.
17. London Gov. “Governance – London Datastore,” 2021. https://data.london.gov.uk/about/data-governance-and-quality/.
18. Greater London Authority, ,supra note 16.
19. Ibid.
20. Health Protection (Coronavirus, Restrictions) (England) (No. 4) Regulations 2020. https://www.legislation.gov.uk/uksi/2020/1200/
pdfs/uksi_20201200_en.pdf?utm_source=hootsuite&utm_medium=social&utm_campaign=post
6Greater London Authority Datastore - COVID-19 | Mobility Report
officials from London’s 32 boroughs, the Mobility Report has also been utilized for journalistic reporting
from outlets such as The Guardian21 and Traffic Technology Today,22 as well as academic publications
from the London School of Economics.23
Looking towards a post-lockdown and post-pandemic world, the COVID-19 Mobility Report has laid the
foundation for future Datastore initiatives leveraging mobility data, especially in the area of economic
development. As London seeks to rebuild its economy, insight into visitation patterns to retail locations
provides a valuable proxy for consumer spending. According to the Datastore team, they plan to develop
new reports that analyze the “busyness” of retail sectors and London’s highstreets, leading to an area of
focus that can be sustained well beyond the pandemic and London’s process of economic recovery.
Lessons Learned
Enabling Conditions
The Greater London Authority benefited from having an existing, public facing repository of open data
sets that could easily accommodate London-specific data for COVID-19. Moreover, with a data science
team in place through the GLA’s City Intelligence Unit.
Challenges
The Datastore’s COVID-19 Mobility Report represents a shift towards embracing private sector data in
order to provide timely situational awareness, both in response to immediate crises, and towards building
longer term programs. A cogent example of this can be seen in the difficulty sourcing mobility data in a
timely manner during the first year of the pandemic from Transport for London for, a public-sector entity
that is governed by the same body as the Datastore, the Greater London Authority. It should be noted,
however, that by December 2020 TFL was able to begin providing more detailed and regularly updated
insights, indicating an ability for more streamlined data sharing between public sector entities in order to
overcome public challenges.
Conclusion / Next Steps
When the public sector was unable to provide relevant and real-time mobility data in response to the
COVID-19 crisis in this situation, multiple private-sector entities were able to provide the datasets required
to build the COVID-19 Mobility Report. According to the Datastore team, there was interest prior to
21. Harris, Richard, and James Cheshire. “Working from Home Could Be Keeping Covid-19 at Bay – for Proof, Look at London |
Richard Harris and James Cheshire.” The Guardian. September 14, 2020, sec. Opinion. http://www.theguardian.com/commentis-
free/2020/sep/14/working-from-home-covid-19-london-uk-capital-white-collar-work.
22. Houghton, Ed. “OPINION: Why Covid May Change Attitudes to Ridesharing and Robotaxis.” Traffic Technology Today (blog),
October 28, 2020. https://www.traffictechnologytoday.com/opinion/opinion-why-covid-may-be-change-attitudes-to-ridesharing-
and-robotaxis.html.
23. Gongadze, Salome. “Four Months on: Looking Back on the COVID-19 Epidemic in London.” LSE London (blog), July 3, 2020.
https://blogs.lse.ac.uk/lselondon/four-months-on-looking-back-on-the-covid-19-epidemic-in-london/.
7Greater London Authority Datastore - COVID-19 | Mobility Report
the pandemic in leveraging private-sector mobility data for various Datastore projects, but it took the
urgency of a crisis in order to catalyze action. Furthermore, this adoption of private-sector mobility data
was facilitated by the willingness of big-data companies to provide free access to data, a possible pre-
condition for the sustainability of continued public-private partnerships.
8You can also read