Interactive web-based visualization of multi-dimensional physical and astronomical data - arXiv
←
→
Page content transcription
If your browser does not render page correctly, please read the page content below
Interactive web-based visualization of multi-dimensional physical and
                                                                      astronomical data
                                             Faruk Diblen∗2 , Luc Hendriks†1,3 , Bob Stienen‡1 , Sascha Caron§1,3 , Rena Bakhshi¶2 , and Jisk
                                                                                        Attema‖2
                                             1
                                                 High Energy Physics, IMAPP, Radboud University Nijmegen, Heyendaalseweg 135, 6525 AJ
                                                                                        Nijmegen, NL
                                                  2
                                                    Netherlands eScience Center, Science Park 140, 1098 XG Amsterdam, The Netherlands
                                                                     3
                                                                       Nikhef, Science Park 105, 1098 XG Amsterdam, N

                                                                                          November 10, 2020
arXiv:2011.03801v1 [hep-ex] 7 Nov 2020

                                                                                                 Abstract

                                                 In this manuscript, we propose to expand the use of scientific repositories such as Zenodo and HEP Data,
                                                 in particular in order to better examine multi-parametric solutions of physical models. The implemen-
                                                 tation of interactive web-based visualizations enables fast and comfortable re-analysis and comparisons of
                                                 phenomenological data.
                                                     In order to illustrate our point of view, we present some examples and demos for dark matter models,
                                                 supersymmetry exclusions and LHC simulations.

                                                 Keywords: visualization, multi-dimensional data, machine learning, simulations, particle physics

                                     1        Introduction
                                     Practically any research done in modern physics nowadays is grafted on (simulated) data. Whether it is a the
                                     investigation of the Higgs boson properties or the search & exclusion of new models for physics beyond the
                                     Standard Model at the LHC, the investigation of gravitational waves or the identification of dark matter. In
                                     all these scientific efforts the exploration of data with the help of physical models plays a key role. The models
                                     are often complex, i.e. they depend on various physical parameters and their interpretation may depend on
                                     systematic effects described with the help of additional nuisance parameters.
                                          Traditionally scientific data1 is provided by the experiments mainly in the form of 1-dimensional histograms
                                     and data analysis typically required a comparison of the model to the histogram of data. The scientific models
                                     investigated were also of low complexity. Predictions of models that describe physics are typically compared
                                     to the data using often time-consuming simulations of the underlying physical processes for a large number of
                                     model parameter sets. Finally, the best-fit contours of the models are presented in the form of likelihoods or
                                     posterior distributions as functions of a model parameter θ, typically in the form of 1-2 dimensional figures in
                                     scientific publications.
                                          In the field of searches beyond the Standard Model typically 95% confidence level upper limits are provided,
                                     i.e. model parameter sets are classified between "excluded" and "allowed".
                                          In order to visualise high-dimensional data, one can use 1- or 2-dimensional projections (e.g. some parameter
                                     variables have been marginalized or set to best fit values), or slices of the full space, but this comes at the cost
                                         ∗
                                           f.diblen@esciencecenter.nl
                                         †
                                           luc.hendriks@gmail.com
                                         ‡
                                           b.stienen@science.ru.nl
                                         §
                                           scaron@nikhef.nl
                                         ¶
                                           r.bakhshi@esciencecenter.nl
                                         ‖
                                           j.attema@esciencecenter.nl
                                         1
                                           Before the area of histograms there was the time of pictures, e.g. from bubble chambers.

                                                                                                      1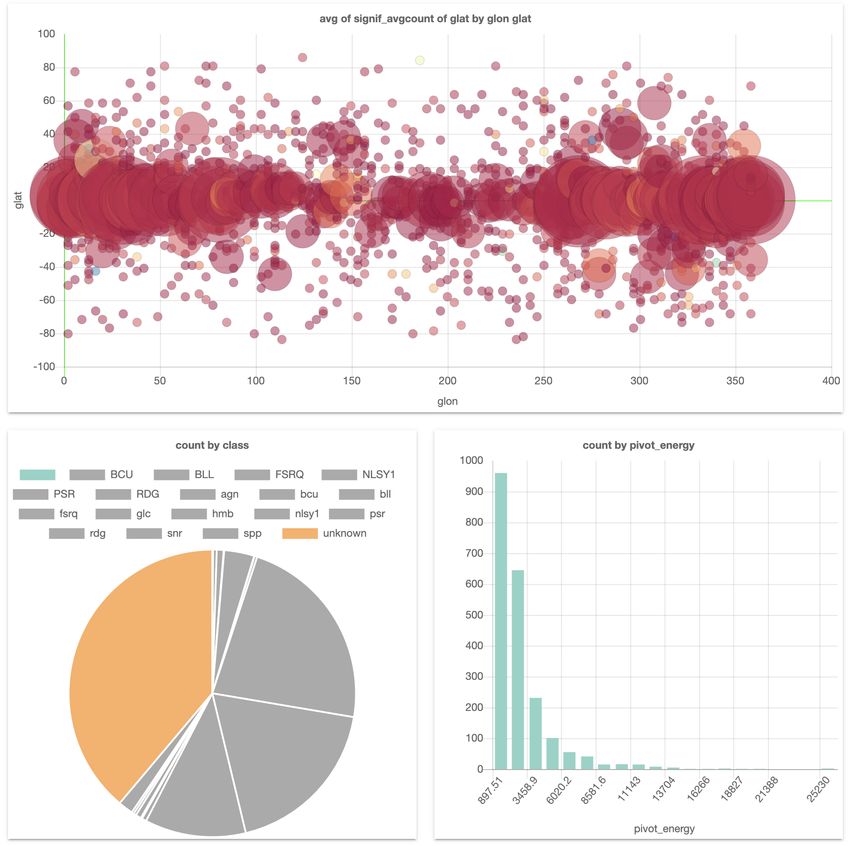
Figure 1: A typical exclusion limit curve (left) and a typical maximum likelihood interval (right) as a function
of the two parameters M1 and M2. Let us assume that the hypothetical real physical model has 20 parameters
M1-M20.

of information contained in the visualisation itself. An example of such a 1-dimensional exclusion contour and
a maximum likelihood interval is given in Figure 1.
    The problem becomes even more apparent in the combination and comparison of the results of two different
research data sets. To actually visualise data and make a comparison between two data sets, expert knowledge
on the creation of those sets is often needed.
    There are exciting visualization tools that solve these problems, but these are not open source [16, 4, 18, 14],
require technical expertise or are generic tools [13, 17].
    An open and user-friendly visualization tool would also allow researchers with limited-time (and limited
technical skills) to find new correlations in published data. We believe that such a web-based and easy-to-use
data-visualisation tool can generate new ideas and accelerate science.
    Repositories like Zenodo [11] allow to store likelihood or exclusion boundaries for thousands to millions
different parameter sets. Zenodo is today also widely used to publicly store the results of simulations used in
scientific publications.
    This manuscript proposes to build two additions to this new way of multivariate data explorations and
shows working demonstrations.

    • Interactive visualisation of data samples: We believe that there should also be an easy way to
      visualize, explore and compare multi-dimensional data. This allows a quick and intuitive visualisation
      and analysis of the model data. We propose a tool for “online” 1 − 3 dimensional visualisation and
      histogramming of high-dimensional data sets which could be connected to online repositories such as
      Zenodo.

    • Generalization of data samples: As described in [7], the regression and classification with Machine
      Learning (ML) allows a practical interpolations in between the provided model solutions. ML-based
      interpolations are best practice also for high-dimensional models. Such tools are built by the community
      (or could be automatically build on some of the Zenodo data sets). This would allow to determine
      exclusion, likelihood, posteriors etc. for an arbitrary set of model parameters.

   In the following we discuss a few example cases and provide links to working demos build on on SPOT [10, 6]
with data sets available on Zenodo via phenoMLdata.org.

2    A demonstration of interactive visualization
phenoMLdata is an online interactive plotting interface to a database of publicly available data sets, based on
the open-source SPOT framework. A prototype of the website can be found at http://spot.phenomldata.org.
    The tool allows for the creation of histograms, line plots, pie charts and scatter plots (both 2-dimensional
and 3-dimensional) of any (combination) of the variables without downloading the data to user’s computer. As
conventional with plotting tools the properties of these plots, like ranges of the axes, colours and points sizes
can be customized and made data dependent.
    During the creation of a plot, all available data from the data sets is plotted. SPOT adds interactivity
between the plots by linking them. In a session with a histogram and a scatter plot users can for example select
a region in the scatter plot. The histogram then automatically alters itself to only show data contained in the
user’s selection, making it possible to make real-time filtering on the data.

                                                         2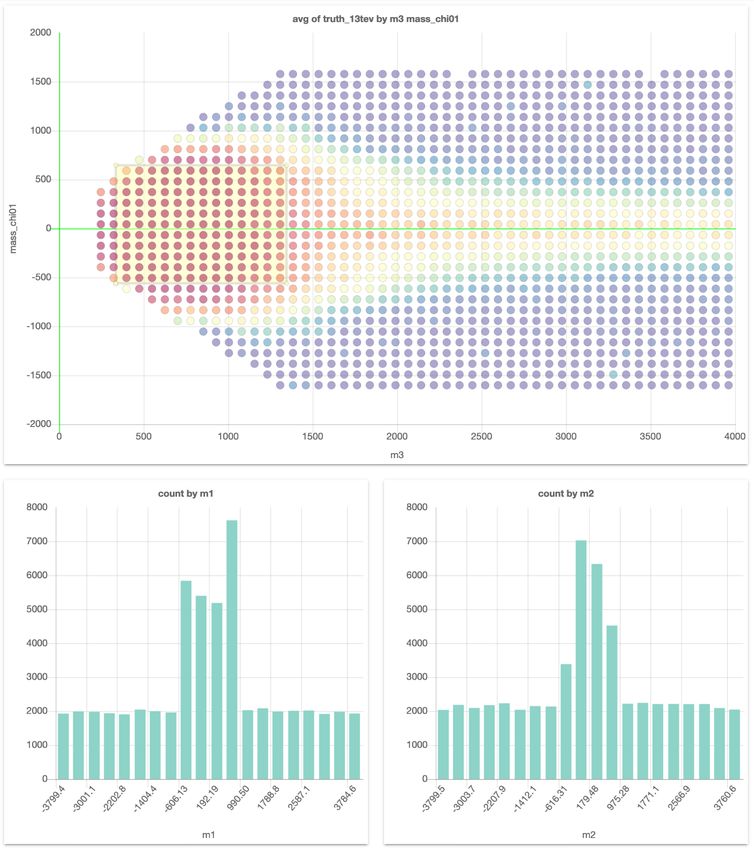
Another advantage is the possibility to compare different data sets. The online interface provides access to a
database containing the data sets. Any data set in this database can be selected for visualisation. By selecting
multiple data sets it is possible to plot (the same) variables of different data sets in the same plot. This makes
it possible to compare e.g. exclusion boundaries of different papers, projected onto any available plane.
Any visualisation made with the tool can be exported as a provenance file (active session) for sharing.
Any other user that uploads this file can then use the visualisations for themselves and has access to the
full interactive arsenal of SPOT in doing so. The next section showcases this explicitly: any of the provided
examples comes with a URL to the provenance file for that specific example. Uploading this file to SPOT opens
the full interactive version of said example.
3 Examples
For each example we provide the "session URL" in the Figure captions. All the session files can be found on
https://doi.org/10.5281/zenodo.4247860.
3.1 Example 1: SUSY-AI
A primary goal of particle physics is to find signals that are predicted by extensions of the Standard Model.
These extensions always come with several new parameters, such as e.g. the masses and couplings of new
particles. The ATLAS experiment provides in [9] for a 19-dimensional model of new physics (the so called
pMSSM) and about 310,000 realizations of this model (with randomly selected parameter sets) the information
whether this parameter set is excluded (or not) by ATLAS measurements. These 310,000 model configurations
with binary exclusions allowed the construction of a Machine Learning classifier to predict the exclusion contour
in the full 19-dimensional model space [8]. The investigation of the exclusion of the 19-dimensional model
parameters is, nevertheless, typically still done through two-dimensional projections.
However, storing the data in a database with an interactive plot tool would solve this problem. The reader
can then simply take the actions that interest them. In this example, a subset of the data from [9] is saved
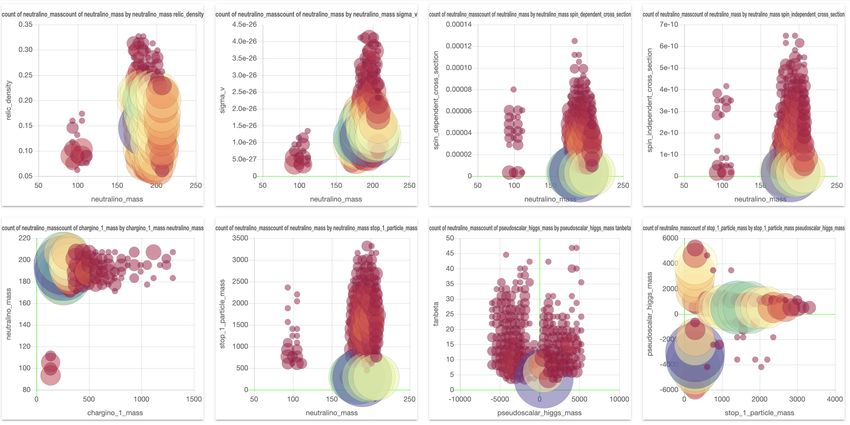
so that every projection and every slice can now be plotted. Figure 2 shows (on the right) an example of an
exclusion plot that can be made, in which colours indicate the average exclusion in each bin. Using the dynamic
links between the plots in this figure, one can make on-the-fly slices in the project plot using the plots on the
right, allowing for a quick and full exploration of the high-dimensional data set. This shows that a tool like
phenomldata.org could be used to accompany papers with an effectively unlimited number of (exclusion) plots
and projections based on the data used in writing the paper.
3.2 Example 2: Galactic Center excess model solutions
In [3] and [2] a 19-dimensional theoretical model 2 was tested against a measurement of an excess in the Galactic
Center (GC), which was observed during the analysis of gamma rays.
In this work, a very small area of the parameter space was found that could explain this excess and lead
to a particular candidate for dark matter. In these papers, various scatter plots are shown to highlight where
in the parameter space these solutions are. However, these various two-dimensional plots are merely slices in
the 19-dimensional parameter space. From a theoretical standpoint we know that this parameter space is very
complex: it contains delta peaks, step functions and high dimensional correlations. The 2D diagrams therefore
do not show the complete information contained in 19D space. In addition, mapping all the combinations of
19D space would require 171 scatter plots, and this still does not show the correlations shown in more than two
dimensions.
Another researcher might be interested in a scatter plot or histogram that is not in the paper, because this
person needs it to design an experiment to verify if the dark matter candidate exists. As this plot is not in
the paper, this person needs to contact the authors and hope that they still have the results of this paper in
high-dimensional format.
Additionally, while different theoretical models will have different input parameters, the output parameters
will most likely overlap. For example, all dark matter models must predict the mass and cross section of the
dark matter candidate, and all models that match the GC excess derive a likelihood. By focusing on these
overlapping parameters, one can compare results of different theoretical models in the same plots and have a
very fast and convenient way to compare results of different papers. An example of the recreation of the plots
in [3] can be found in Figure 4. An example of two plots in [3] can be found in Figure 3.
2
A version of the pMSSM model also used in Example 1 (Section 3.1).
3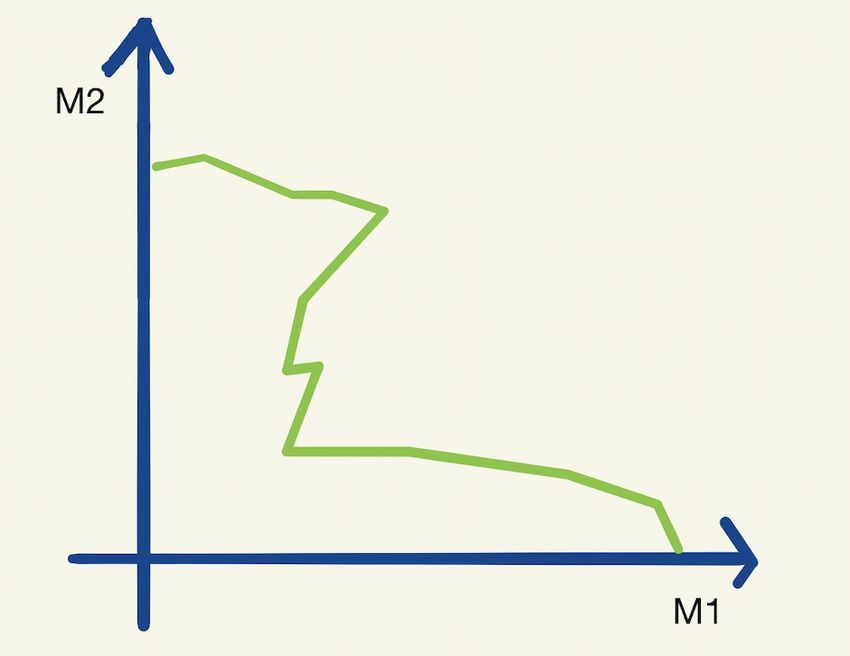
Figure 2: The example projection made of a subset of the data in [9]. The graph on top shows the projection
on 2 of the 19 free parameters and the colors indicate the average exclusion for the model configurations in each
for the bins. The two graphs on the bottom can be used to make cuts on two of the remaining 17 parameters.
Interactive dashboard of these graphs can be accessed here.

Figure 3: Copy of Figure 6a in [3]. This plot has been recreated in SPOT and a screenshot is shown in Figure
4. The figure is the same as the plot in the top left.

                                                       4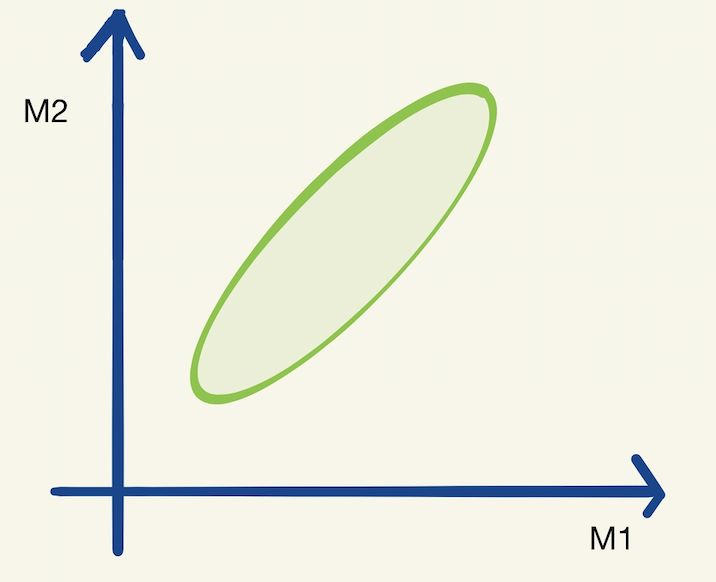
Figure 4: Recreation of the plots in [3] using of SPOT. The interactive dashboard of this data set can be
accessed here.

3.3   Example 3: LHC collider simulation events and humans finding signals
A benchmark data set containing > 108 simulated high-energy collision data has been provided by participants
of the www.darkmachines.org initiative and the 2019 Les Houches workshop [7]. The generated LHC events
correspond to a center-of-mass energy of 13 TeV. Events for the background and signal processes are generated
using the event generator MG5_aMC@NLO v6.3.2 (Madgraph) and versions above [5]. Also a quick detector
simulation was performed and the high-level objects like jets, b-jets, electrons, muons and photons have been
reconstructed. The charge, object type and 4-vector (energy E, transverse momentum pT , pseudorapidity η
and azimuthal angle φ) are stored for each object. A description of the requirements and the data structure
can be found in [7].
    This data set can be useful for various phenomenological studies. One of the goals is to develop and compare
new strategies for searching for signals from new physics. Here it is interesting to see which regions of phase
space are selected by new signal detection algorithms. Cuts of such Machine Learning based algorithms are
typically represented by a complicated multidimensional hyper- surface of the 4-vectors and objects. An online
interactive multidimensional visualisation tool such as SPOT would allow to quickly compare e.g. where such
cuts should have been made (or where such cuts where made if the algorithms output can be included/uploaded
into the data set to be visualised).
    An example of a SPOT session with this data can be found in Figure 5. Here a comparison is made
between a possible gluino signal from Supersymmetry and the expected background events. All events are from
simulation.
    It would be interesting to create a challenge where people can search for the signal by applying selection
criteria by hand. Would they be better than machine learning-based anomaly detection algorithms? A signal
region found by a "human" could be used as a "data derived" signal region in an independent data set, similar
to that proposed by ATLAS in [1].

3.4   Example 4: Fermi Point Source catalogue
The Fermi FL8Y Point Source catalogue [12] contains a list of found point sources using eight years of Fermi
data. It is a big table containing locations and properties of various types of point sources. If one would be
interested to quickly check where the most unresolved point sources are, the catalogue has to be downloaded
and then you have to write a visualisation script to filter out the unresolved point sources and plot the latitude
and longitude of the corresponding rows. This requires technical knowledge and is quite time-consuming for
such a simple check.
    Alternatively, in SPOT it requires only a few clicks to generate these plots and conclude they lie mainly in
the Galactic Plane (where also most of the diffuse background radiation is). An example visualization of this

                                                        5
Figure 5: SPOT-based comparison of a possible LHC signal (here a gluino production from Supersymmetry)
and background. The interactive dashboard of this data set can be accessed here.

data set can be found at 6.

Figure 6: SPOT visualisation of the FL8Y Fermi Point Source catalogue [12]. The interactive dashboard of
this data set can be accessed here.

                                                   6
4 Conclusion
In this note, we propose the expansion of scientific repositories such as Zenodo to allow easy web-based visu-
alization of data. We show some examples where such visualization could speed up science. Additionally, it
would be an important step to encourage the HEP community to study physical models and publish results
in their full dimensionality. This would allow and encourage a revision of the results with different model
parameters, the search for anomalies (or errors) in the published data, the generalization of the results with
machine learning and a better comparison of the scientific publication.
We would like to emphasize that the development and the maintenance of such a tool must be a collaborative
effort. We hope the community will realize the importance of our solution so that we can build these tools
together.
Acknowledgments
This work is supported by the Netherlands eScience Center under the project iDark: The intelligent Dark
Matter Survey.
References
[1] M. Aaboud et al. A strategy for a general search for new phenomena using data-derived signal regions and
its application within the ATLAS experiment. Eur. Phys. J. C, 79(2):120, 2019.
[2] A. Achterberg, S. Amoroso, S. Caron, L. Hendriks, R. Ruiz de Austri, and C. Weniger. A description of
the Galactic Center excess in the Minimal Supersymmetric Standard Model. JCAP, 1508(08):006, 2015.
[3] A. Achterberg, M. van Beekveld, S. Caron, G. A. Gómez-Vargas, L. Hendriks, and R. Ruiz de Austri.
Implications of the Fermi-LAT Pass 8 Galactic Center excess on supersymmetric dark matter. JCAP,
1712(12):040, 2017.
[4] C. Ahlberg. Spotfire: an information exploration environment. ACM SIGMOD Record, 25(4):25–29, 1996.
[5] J. Alwall, R. Frederix, S. Frixione, V. Hirschi, F. Maltoni, O. Mattelaer, H. S. Shao, T. Stelzer, P. Torrielli,
and M. Zaro. The automated computation of tree-level and next-to-leading order differential cross sections,
and their matching to parton shower simulations. JHEP, 07:079, 2014.
[6] J. Attema, F. Diblen, J. H. Spaaks, W. van Hage, L. Boogaardt, S. Verhoeven, D. van Kuppevelt, and
B. van Werkhoven. Spot version 0.2.0, Oct. 2020.
[7] G. Brooijmans et al. Les Houches 2019 Physics at TeV Colliders: New Physics Working Group Report.
"", 2 2020.
[8] S. Caron, J. S. Kim, K. Rolbiecki, R. R. de Austri, and B. Stienen. The bsm-ai project: Susy-ai–generalizing
lhc limits on supersymmetry with machine learning. The European Physical Journal C, 77(4):257, Apr
2017.
[9] T. A. collaboration. Summary of the atlas experiment’s sensitivity to supersymmetry after lhc run 1 —
interpreted in the phenomenological mssm. Journal of High Energy Physics, 2015(10):134, Oct 2015.
[10] F. Diblen, J. Attema, R. Bakhshi, S. Caron, L. Hendriks, and B. Stienen. SPOT: Open Source framework
for scientific data repository and interactive visualization. SoftwareX, 2018.
[11] European Organization For Nuclear Research and OpenAIRE. Zenodo, 2013.
[12] Fermi. Fermi-lat 8 year point source catalog, 2018. Available at https://fermi.gsfc.nasa.gov/ssc/
data/access/lat/fl8y/.
[13] A. Foundation. Superset. https://github.com/apache/incubator-superset, 2020.
[14] J. Heer, J. Mackinlay, C. Stolte, and M. Agrawala. Graphical histories for visualization: Supporting
analysis, communication, and evaluation. IEEE transactions on visualization and computer graphics, 14(6),
2008.
7[15] L. Hendriks, J. Attema, R. Bakhshi, S. Caron, F. Diblen, and B. Stienen. Session files for phenomldata
spot server, Nov. 2020.
[16] T. Lachev and E. Price. Applied Microsoft Power BI: Bring Your Data to Life! Prologika Press, 3 edition,
2018.
[17] Metabase. Metabase. https://github.com/metabase/metabase, 2020.
[18] Plotly. Dash. http://dash.plot.ly, 2020.
8You can also read