REPORT 5: PHYLOGENETIC ANALYSIS OF SARS-COV-2 - IMPERIAL ...
←
→
Page content transcription
If your browser does not render page correctly, please read the page content below
15 February 2020                                       Imperial College London COVID-19 Response Team

Report 5: Phylogenetic analysis of SARS-CoV-2
Erik Volz1, Marc Baguelin, Sangeeta Bhatia, Adhiratha Boonyasiri, Anne Cori, Zulma Cucunubá, Gina Cuomo-
Dannenburg, Christl A. Donnelly, Ilaria Dorigatti, Rich FitzJohn, Han Fu, Katy Gaythorpe, Azra Ghani, Arran
Hamlet, Wes Hinsley, Natsuko Imai, Daniel Laydon, Gemma Nedjati-Gilani, Lucy Okell, Steven Riley, Sabine van
Elsland, Haowei Wang, Yuanrong Wang, Xiaoyue Xi, Neil M. Ferguson

WHO Collaborating Centre for Infectious Disease Modelling
MRC Centre for Global Infectious Disease Analysis
Abdul Latif Jameel Institute for Disease and Emergency Analytics (J-IDEA)
Imperial College London
1
Correspondence: e.volz@imperial.ac.uk

Summary
Genetic diversity of SARS-CoV-2 (formerly 2019-nCoV), the virus which causes COVID-19, provides
information about epidemic origins and the rate of epidemic growth. By analysing 53 SARS-CoV-2
whole genome sequences collected up to February 3, 2020, we find a strong association between the
time of sample collection and accumulation of genetic diversity. Bayesian and maximum likelihood
phylogenetic methods indicate that the virus was introduced into the human population in early
December and has an epidemic doubling time of approximately seven days. Phylodynamic modelling
provides an estimate of epidemic size through time. Precise estimates of epidemic size are not possible
with current genetic data, but our analyses indicate evidence of substantial heterogeneity in the
number of secondary infections caused by each case, as indicated by a high level of over-dispersion in
the reproduction number. Larger numbers of more systematically sampled sequences – particularly
from across China – will allow phylogenetic estimates of epidemic size and growth rate to be
substantially refined.

SUGGESTED CITATION
Erik Volz, Marc Baguelin, Sangeeta Bhatia et al. Phylogenetic analysis of SARS-CoV-2. Imperial College London
(15-02-2020), doi: https://doi.org/10.25561/77169.

                 This work is licensed under a Creative Commons Attribution-NonCommercial-NoDerivatives
                 4.0 International License.

DOI: https://doi.org/10.25561/77169                                                               Page 1 of 8
15 February 2020 Imperial College London COVID-19 Response Team 1. Introduction As of 1500 GMT 14 February 2020, almost 64,000 cases of COVID-19 (formerly 2019-nCoV) have been reported in China (with 1381 deaths), and cases have been detected in at least 24 regions or countries outside mainland China. Since the identification of the novel coronavirus disease from Wuhan City, China in December 2019 there have been ongoing efforts to identify the source of the virus. Many of the cases reported at the beginning of the epidemic had an epidemiological link to a seafood and wildlife market in Wuhan City pointing to a single spillover event from an animal reservoir [1]. Initial phylogenetic analysis showed that the new virus was similar to the SARS coronavirus when compared with other coronaviruses known to infect humans, with bats or pangolins as the most likely animal reservoir [2–4]. Genetic data can give insights into the evolving epidemic which are not always apparent from the epidemiological data alone. As a virus is transmitted through a population, it will accumulate mutations in its genetic code. By identifying changes in genetic sequences sampled from different patients, it is possible to reconstruct the evolutionary history of an epidemic. For a novel pathogen of zoonotic origin this can allow us to estimate when the pathogen was introduced into the human population. Population genetic modelling can also be used to infer population size trends and gives some indication of the unobserved burden of disease in the population. Previous investigations of publicly available sequence data have presented phylogenetic estimates of SARS-CoV-2 time of most recent common ancestor (TMRCA) and growth rates using Bayesian phylogenetic methods [5–7]. Here we use 53 publicly available whole genome sequences sampled up to February 3, 2020 to estimate the growth rate of the epidemic, the size of the epidemic, and the time to most recent common ancestor using a combination of Bayesian and maximum likelihood methods and using a phylodynamic SEIR model. 2. Results Bayesian phylogenetic analysis indicates a common ancestor of these virus lineages occurred on December 8, 2019 (95% CI: November 21-December 20, 2019). The virus phylogeny is consistent with a population genetic model assuming exponential growth. Fitting the exponential growth model provides an estimate of the epidemic growth rate. This provides an estimate of the epidemic doubling time of 6.6 days (95% CI: 4.0-12.7), which is in line with previous reports based on the same genetic data [7]. We also estimated the time to the most recent common ancestor (TMRCA) and doubling time using maximum likelihood with similar findings. We estimate the TMRCA to be on 5 December 2019 (95% CI: 6 November - 13 December 2019) and the doubling time of the epidemic to be 7.1 days (95% CI: 3.0-20.5) (Figure 1). DOI: https://doi.org/10.25561/77169 Page 2 of 8
15 February 2020                                   Imperial College London COVID-19 Response Team

Figure 1. Phylodynamic estimates of epidemic origins and growth rates. A) A root to tip regression
showing the accumulation of genetic diversity with time of sampling. Red points show samples
while black points show estimated TMRCA between samples. B) The bootstrap distribution of
estimated TMRCA. C) The bootstrap distribution of epidemic doubling time. D) Bayesian posterior
distribution of TMRCA. E) Bayesian posterior of the doubling time. Red lines indicate maximum
likelihood or posterior median and 95% confidence interval.

Population genetic modelling can be used to infer population size trends and gives some indication of
the unobserved burden of disease in the population. With currently available data, precise estimates
are not possible and different methods do not give concordant results, but very wide confidence
intervals cover a realistic range of values. By fitting a Bayesian phylodynamic SEIR model, we estimate
that on February 3 there were cumulatively 38,000 infections (95%CI: 4,000-187,000) (Figure 2). These
values correspond to an R0 of 2.15 (95%CI: 1.79-2.75). Alternatively, using an exponential growth
model and adjusting for high variance in transmission rates, we estimate 26,000 cumulative infections
by February 3 (95%CI: 6,000-176,000). With the SEIR model we estimate that on January 18 there were
4,000 cumulative infections (95%CI: 800-15,000) [8,9].

DOI: https://doi.org/10.25561/77169                                                        Page 3 of 8
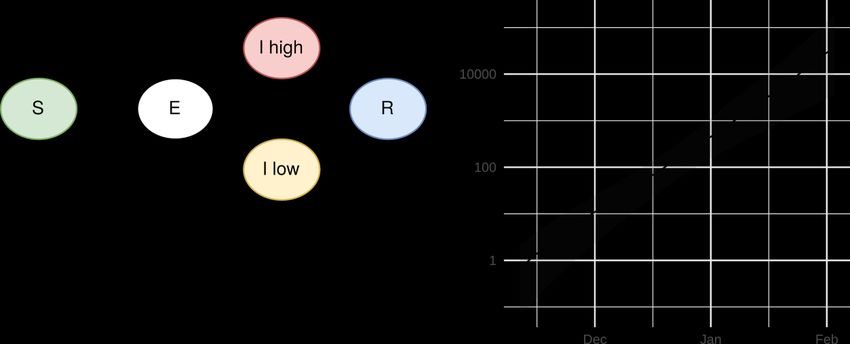
15 February 2020                                  Imperial College London COVID-19 Response Team

Figure 2. Estimates of cumulative infections through time based on a structured coalescent epidemic
model. A) Diagram representing SEIR. The compartment “E” represents the incubation period and
“R” represents recovered and deaths. There are two categories of infectious individuals to represent
high variance in transmission rates. B) Cumulative infections through time up to February 3, 2020.
The shaded region shows the 95% credible interval.

Phylodynamic estimates are sensitive to assumptions regarding variance in transmission rates
between individuals as high variance reduces genetic diversity in a sample. We find that estimates
assuming high levels of overdispersion in the reproduction number are consistent with the
epidemiological record which shows approximately 20,000 confirmed infections by February 3 [10].
Table 1 shows estimated cumulative infections by February 3 under various levels of overdispersion
in the reproduction number. Higher levels of overdispersion lead to higher estimates of number
infected. We further considered an exponential growth model where the rate of growth is constrained
to values estimated in previous reports.
There are a number of limitations to this analysis. The exponential growth model does not account for
a reduction in transmission due to public health interventions, such as travel bans, and quarantine
measures. These estimates do not reflect the situation in areas under quarantine and are more
strongly influenced by epidemic dynamics near the time of origin. The model does not account for
geographic structure and this analysis included many samples from outside of Wuhan City and outside
of mainland China. Sampling of virus genomes was ad-hoc with all early samples originating from
Wuhan, China, and a majority of recent samples originating from travellers outside of mainland China.
Sampling included a number of epidemiologically linked patients and known transmission pairs.
Samples from transmission chains were deduplicated, however transmission histories from travellers
may be correlated in ways that cannot be easily adjusted for.

DOI: https://doi.org/10.25561/77169                                                      Page 4 of 8
15 February 2020                                            Imperial College London COVID-19 Response Team

Table 1: Estimated cumulative infections up to February 3, 2020 based on different population
genetic models and under various levels of overdispersion in the number of transmissions per
infected individual. All results with the exponential growth model assume R=2.9 and a 6.5 day serial
interval, whereas the reproduction number is estimated with the SEIR model.

                        Model type

 Overdispersion         Exponential growth               Exponential growth              SEIR model
 assumed (k)
                        R = 2.9, SI = 6.5 days           R = 2.9, SI = 6.5 days          (R estimated within model)
                                                         Growth rate constrained:
                                                         0.14/day

                        52,000                           111,000                         51,000
 k = 0.075
                        (13,000-349,000)                 (32,000-512,000)                (11,000-335,000)

 k = 0.16               26,000                           56,000                          38,000
                        (6,000-176,000)                  (16,000-259,000)                (4,000-187,000)

 k = 0.30               16,000                           33,000                          -
                        (4,000-105,000)                  (10,000-155,000)

Estimates are given to the nearest 1000 cases. Values in parentheses show 95% confidence intervals.

3. Conclusions
Phylodynamic analysis of publicly available SARS-CoV-2 sequence data provides estimates of growth
and size that are consistent with the epidemiological record. Estimates of epidemic size are highly
dependent on the unknown level of overdispersion in the reproduction number. Estimates assuming
relatively low levels of overdispersion are not consistent with the epidemiological record as they
predict fewer infections than were reported which suggests that there is similar or higher variance in
transmission rates than was observed in the 2003 SARS epidemic.
We have found that SARS-CoV-2 evolves at a rate compatible with related coronaviruses
(approximately 0.0007- 0.002 substitutions per site per year), but the very short period of observation
has allowed very few mutations to occur. There remains considerable uncertainty in growth rates that
will be reduced with the incorporation of additional samples in the coming weeks. As the epidemic
continues to grow and affect more countries, the timely release of genetic data will be invaluable for
refining future estimates.

4. Methods
Bayesian phylogenetic analyses were carried out in BEAST2.6 [11]. Two analyses were carried out with
different population genetic priors: 1) A coalescent with exponential growth and 2) A SEIR model-
based structured coalescent using the PhyDyn package [12]. All analyses made use of a strict molecular
clock and an HKY substitution model following previous study designs [7]. The molecular clock rate of
substitution was constrained between 0.0007 and 0.002 substitutions per site per year. MCMC was
run for 100 million iterations for exponential 160 million iterations for SEIR excluding 50% burn-in.

DOI: https://doi.org/10.25561/77169                                                                        Page 5 of 8
15 February 2020 Imperial College London COVID-19 Response Team
Estimates of effective population size from the exponential-growth coalescent were translated to
epidemic prevalence using the transform of Fraser et al. [13]:
Where R is the reproduction number, days is the generation time, and is the variance in
the offspring distribution, which is the distribution in number of transmissions made by a single
infected individual. In the absence of over-dispersion, this reduces to the equation of Volz et al [14]:
, where is the per-capita transmission rate. Following previous reports [8,9,15], we
examined scenarios where R=2.9, and was chosen to correspond to a SARS-like overdispersion
parameter of k=0.16 [16], or under the condition of no overdispersion.
The SEIR model incorporated two classes of infectious individuals in order to produce a realistic
variance of the offspring distribution which corresponds to the SARS-like k=0.16. The model has a high
transmission rate group comprising 13.5% of infected individuals who transmit at a rate 74 times
larger than the remaining infected individuals.
Maximum likelihood analysis: Time scaled phylogenies, substitution rates, and TMRCA were estimated
using the treedater R package 0.5.0 [17]. The rate of evolution was constrained between 0.0005-
0.00125 substitutions per site per year. Polytomies were resolved randomly prior to coalescent
analysis and results averaged. Parametric bootstrap was used to estimate uncertainty. Sample
selection, quality control, and computation of maximum likelihood phylogenies was based on the
Nextstrain platform [8,9]. Sequences were aligned using MAFFT [18] and phylogenies estimated using
IQTree [19]. Discussions on http://virological.org assisted greatly with quality control and sample
selection. Lineages were dropped from the tree if multiple samples came from a household or a known
transmission pair. An exponential-growth coalescent model was implemented in the phydynR
package [12]. This model was fitted by maximum likelihood to the bootstrap distribution of
phylogenies.
Sequences
See supplementary file for GISAID IDs of sequences used for analyses: gisaid_id.csv.
5. Acknowledgements
We gratefully acknowledge the laboratories that have contributed publicly available genomes via
GISAID: Shanghai Public Health Clinical Center & School of Public Health, Fudan University, Shanghai,
China, at the National Institute for Viral Disease Control and Prevention, China CDC, Beijing, China, at
the Institute of Pathogen Biology, Chinese Academy of Medical Sciences & Peking Union Medical
College, Beijing, China, at the Wuhan Institute of Virology, Chinese Academy of Sciences, Wuhan,
China, at the Department of Microbiology, Zhejiang Provincial Center for Disease Control and
Prevention, Hangzhou, China, at the Guangdong Provincial Center for Diseases Control and Prevention
at the Department of Medical Sciences, at the Shenzhen Key Laboratory of Pathogen and Immunity,
Shenzhen, China, at the Hangzhou Center for Disease and Control Microbiology Lab, Zhejiang, China,
at the National Institute of Health, Nonthaburi, Thailand, at the National Institute of Infectious
Diseases, Tokyo, Japan, at the Korea Centers for Disease Control & Prevention, Cheongju, Korea, at
the National Public Health Laboratory, Singapore, at the US Centers for Disease Control and
Prevention, Atlanta, USA, at the Institut Pasteur, Paris, France, at the Respiratory Virus Unit,
Microbiology Services Colindale, Public Health England, and at the Department of Virology, University
DOI: https://doi.org/10.25561/77169 Page 6 of 815 February 2020 Imperial College London COVID-19 Response Team
of Helsinki and Helsinki University Hospital, Helsinki, Finland, and at the University of Melbourne,
Peter Doherty Institute for Infection and Immunity, Melbourne, Australia, at the Victorian Infectious
Disease Reference Laboratory, Melbourne, Australia, at the Public Health Virology Laboratory,
Brisbane, Australia and at the Institute of Clinical Pathology and Medical Research, University of
Sydney, Westmead, Australia.
6. References
1. Huang C, Wang Y, Li X, Ren L, Zhao J, Hu Y, et al. Clinical features of patients infected with
2019 novel coronavirus in Wuhan, China. Lancet. 0. doi:10.1016/S0140-6736(20)30183-5
2. Wong MC, Cregeen SJJ, Ajami NJ, Petrosino JF. Evidence of recombination in coronaviruses
implicating pangolin origins of nCoV-2019. bioRxiv. 2020; 2020.02.07.939207.
doi:10.1101/2020.02.07.939207
3. Lu R, Zhao X, Li J, Niu P, Yang B, Wu H, et al. Genomic characterisation and epidemiology of
2019 novel coronavirus: implications for virus origins and receptor binding. Lancet. 2020;0.
doi:10.1016/S0140-6736(20)30251-8
4. Zhou P, Yang X-L, Wang X-G, Hu B, Zhang L, Zhang W, et al. A pneumonia outbreak associated
with a new coronavirus of probable bat origin. Nature. 2020; 1–4. doi:10.1038/s41586-020-
2012-7
5. Clock and TMRCA based on 27 genomes - Novel 2019 coronavirus / nCoV-2019 Genomic
Epidemiology - Virological. [cited 14 Feb 2020]. Available: http://virological.org/t/clock-and-
tmrca-based-on-27-genomes/347
6. Phylodynamic analysis of nCoV-2019 genomes – 29-Jan-2020 - Novel 2019 coronavirus /
nCoV-2019 Genomic Epidemiology - Virological. [cited 14 Feb 2020]. Available:
http://virological.org/t/phylodynamic-analysis-of-ncov-2019-genomes-29-jan-2020/353/7
7. Phylodynamic Analysis | 90 genomes | 12 Feb 2020 - Novel 2019 coronavirus / nCoV-2019
Genomic Epidemiology - Virological. [cited 14 Feb 2020]. Available:
http://virological.org/t/phylodynamic-analysis-90-genomes-12-feb-2020/356
8. Imai N, Dorigatti I, Cori A, Riley S, Ferguson NM. Report 1: Estimating the potential total
number of novel Coronavirus cases in Wuhan City, China. [cited 20 Jan 2020]. Available:
https://www.imperial.ac.uk/mrc-global-infectious-disease-analysis/news--wuhan-
coronavirus/
9. Imai N, Dorigatti I, Cori A, Riley S, Ferguson NM. Report 2: Estimating the potential total
number of novel Coronavirus cases in Wuhan City, China. [cited 24 Jan 2020]. Available:
https://www.imperial.ac.uk/mrc-global-infectious-disease-analysis/news--wuhan-
coronavirus/
10. World Health Organization. Novel Coronavirus(2019-nCoV) Situation Report-15. 2020.
Available: https://www.who.int/docs/default-source/coronaviruse/situation-
reports/20200204-sitrep-15-ncov.pdf
11. Bouckaert R, Vaughan TG, Barido-Sottani J, Duchêne S, Fourment M, Gavryushkina A, et al.
BEAST 2.5: An advanced software platform for Bayesian evolutionary analysis. PLoS Comput
Biol. 2019. doi:10.1371/journal.pcbi.1006650
12. Volz EM, Siveroni I. Bayesian phylodynamic inference with complex models. PLoS Comput
DOI: https://doi.org/10.25561/77169 Page 7 of 815 February 2020 Imperial College London COVID-19 Response Team
Biol. 2018. doi:10.1371/journal.pcbi.1006546
13. Fraser C, Li LM. Coalescent models for populations with time-varying population sizes and
arbitrary offspring distributions . bioRxiv . 2017. doi:10.1101/131730
14. Volz EM. Complex population dynamics and the coalescent under neutrality. Genetics. 2012.
doi:10.1534/genetics.111.134627
15. Imai N, Cori A, Dorigatti I, Baguelin M, Donnelly CA, Riley S, et al. Report 3: Transmissibility of
2019-nCoV. 2020. Available: https://www.imperial.ac.uk/media/imperial-
college/medicine/sph/ide/gida-fellowships/Imperial-2019-nCoV-transmissibility.pdf
16. Lloyd-Smith JO, Schreiber SJ, Kopp PE, Getz WM. Superspreading and the effect of individual
variation on disease emergence. Nature. 2005;438: 355–359. doi:10.1038/nature04153
17. Volz EM, Frost SDW. Scalable relaxed clock phylogenetic dating. Virus Evol. 2017.
doi:10.1093/ve/vex025
18. Katoh K, Standley DM. MAFFT multiple sequence alignment software version 7:
Improvements in performance and usability. Mol Biol Evol. 2013.
doi:10.1093/molbev/mst010
19. Nguyen LT, Schmidt HA, Von Haeseler A, Minh BQ. IQ-TREE: A fast and effective stochastic
algorithm for estimating maximum-likelihood phylogenies. Mol Biol Evol. 2015.
doi:10.1093/molbev/msu300
DOI: https://doi.org/10.25561/77169 Page 8 of 8You can also read