Seafood Sector Presentation - April 2016 - Fish Pool
←
→
Page content transcription
If your browser does not render page correctly, please read the page content below
Seafood Sector Presentation – April 2016

                                           12.07.201
                                            1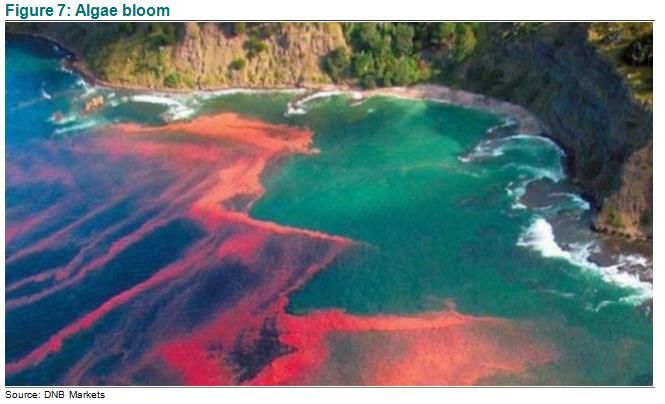
Seafood sector report – April 2016

Extended super-cycle

                                     2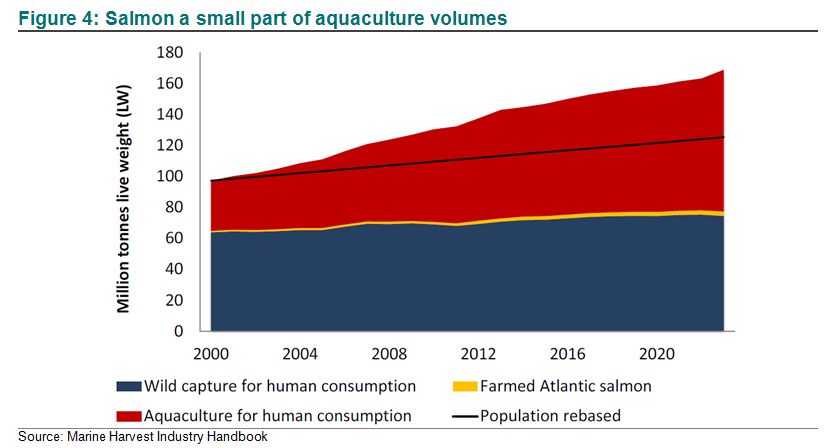
Extension of the salmon cycle, this cycle looks set to last an unprecedented 8 years…

                   3 year cycles replaced by a 8 year cycle?

                                                                              3
Structural trends favour seafood…..and poultry
4Structural trends favour seafood…..and poultry
5Structural trends favour seafood…..and poultry
Aquaculture and poultry estimated to contribute 2/3 of volume growth
between 2014-2024
6But salmon unlikely to spearhead growth… At least over the next two years…
Salmon only
account for 4% of
aquaculture
volume
7Top 5 nations salmon producers have hardly grown since 2012
8Top 5 nations salmon producers have hardly grown since 2012
If top 5 regions do not grow, the industry do not grow….
9Supply decline from Chile and Norway trigger the largest negative supply shock in history
6% supply contraction and -140kt dwarfs 2010’s 3.7% and -54kt drop following
the ISA crisis in Chile
10Chile - Algae bloom, or ‘the red tide’ is toxic for many marine animals
11Chile volumes collapsing, lost 120kt or 15% of individuals due to algae…
15% of individuals lost, equivalent to 120kt of lost output in 2016-17e
12Current losses amount to 120kt, but could more than double if region XI is affected
Region X loss of 118kt, but another 179kt if region XI is hit equally hard...
13Chile - Smolt release was dropping sharply even before the algae bloom
Looking at the past three months, smolt releases for atlantics and other species
have taken a nose dive, down 16–28% and 15–39%, respectively
14Chile, what’s next???
Who has the cash to put more fish into the sea?
If they have cash, do they even want to put more fish into the sea?
Record high prices, but no new framework to safeguard against
another collapse… What to do….?
The old proverb: One bird in your hand is better than 10 on the roof…
15Norway - Decline in 2016 is the price to pay for eating into the inventory
Record small harvest size means fewer individuals reach full size, cutting output potential
16Did we ‘overharvest’ 25million individuals? No wonder 2016 supply is tight!
A simple first in, first out model suggest 9% volume decline from Norway in 2016…
17But biomass growth of 15G has been very solid, making up some lost ground
Norwegian biomass growth (%) Total growth in the sea (% of biomass in the beginning of the month)
13%
26%
8% 21%
4% 4% 16%
3% 4% 3%
3%
1%
0% 11%
-1%
-2% -2% -2%
-2%
-3% -3%
-4% 6%
Jan Feb Mar Apr May Jun Jul Aug Sep Oct Nov Dec
-7%
Jan Feb Mar Apr May Jun Jul Aug Sep Oct Nov Dec
Max - min 09-14 2013 2014 2015 2016
2013 2014 2015 2016
18Global supply growth estimate
Norway and Chile simultaneous drop cause largest drop in history
19Seafood weekly 22 April 2016
Salmon spot prices at record high levels in both EUR and NOK terms.
EUR/kg
7.5
Salmon price expectations
6.5 DNB 2016e salmon price estimate at
NOK50/kg, and NOK51/kg for 2017e.
5.5 (EUR5.4/kg in 16e and EUR5.5/kg in 17e,
with a EURNOK of 9.3)
4.5
NQSALMON prices are approximately
NOK0.75/kg higher than FHL/NOS prices
3.5
as the NQSALMON prices also include
trader sales margins
2.5
1.5
1 5 9 13 17 21 25 29 33 37 41 45 49
High/Low 00-14 2016 Average 00-14 2015 2014
NOK/kg
65
55
45
35
25
15
Source: DNB Markets, NSL/NOS, Fishpool
1 5 9 13 17 21 25 29 33 37 41 45 49
Analysts: Alexander Aukner (+47 24 16 90 79; alexander.aukner@dnb.no )
High Low 00-14 2016 Average 00-14 2015 2014Seafood weekly 22 April 2016
Chilean and Canadian salmon prices in all time high territory
Chilean salmon (fresh fillets Miami – USD/kg) at USD12.0/kg Seattle price (fresh Atlantic salmon 8-10lbs FOB Seattle)
10.0
14.0
13.0 9.0
12.0 8.0
11.0
7.0
10.0
6.0
9.0
8.0 5.0
7.0 4.0
6.0
3.0
5.0
2.0
4.0 1 5 9 13 17 21 25 29 33 37 41 45 49
1 6 11 16 21 26 31 36 41 46 51
High Low 2015 2014 2016
High-Low 04-14 2015 2014 Average 04-14 2016
Source: Kontali, Urner Barry, DNB Markets Source: Kontali, DNB Markets, Urner Barry
Analysts: Alexander Aukner (+47 24 16 90 79; alexander.aukner@dnb.no )Seafood weekly 22 April 2016
Fishpool forward contracts – Settling down at record high levels.
EUR/kg Last Last Three
EUR/kg Actual week month months
6.8
Q1 2016e 6.19 6.12 5.98 5.35
6.3 Q2 2016e 6.25 6.18 5.98 5.08
5.8 Q3 2016e 5.48 5.43 5.28 4.47
Next 12m 5.87 5.81 5.62 4.89
5.3
2016e 5.92 5.86 5.65 4.88
4.8
2017e 5.51 5.46 5.19 4.57
4.3
Last Last Three
3.8
Oct-15 Nov-15 Dec-15 Jan-16 Feb-16 Mar-16 Apr-16 May-16 Jun-16 Jul-16 Aug-16 Sep-16 Oct-16 Nov-16 Dec-16
NOK/kg Actual week month months
Q1 2016e 58.7 58.1 57.1 50.2
Three months ago One month ago Actual DNB Estimate
Q2 2016e 57.9 58.0 57.0 49.3
Q3 2016e 51.0 51.3 50.5 43.5
NOK/kg
Next 12m 54.9 54.9 53.6 47.0
70
2016e 55.3 55.3 54.0 47.0
65 2017e 51.9 52.0 50.2 45.0
60
55 DNB Estimates:
2016e: EUR5.4/kg, NOK50/kg
50
2017e: EUR5.5/kg, NOK51/kg
45
40
Source: Fishpool, DNB Markets
35 Note: From 2015, Fishpool forward prices include a trading/exporter
Oct-15 Nov-15 Dec-15 Jan-16 Feb-16 Mar-16 Apr-16 May-16 Jun-16 Jul-16 Aug-16 Sep-16 Oct-16 Nov-16 Dec-16 margin of NOK0.75/kg. In order to get the old NOS price delivered Oslo,
NOK0.75/kg must be deducted from the forward price. In order to get
price back to farmer, one must deduct another NOK0.5-1.0/kg for freight
Three months ago One month ago Actual DNB Estimate
cost. Hence a forward price of NOK40/kg corresponds to a price back to
farmer of NOK38.25-38.75/kg
Analysts: Alexander Aukner (+47 24 16 90 79; alexander.aukner@dnb.no )
Source: Fishpool, DNB MarketsSeafood weekly 22 April 2016
How high can the price go…. EUR6/kg and NOK57/kg within reach?
Annual salmon prices (EUR/kg) & global supply growth EUR6/kg? EURNOK rate (2001-2017e)
+EUR1.5/kg
6.0 5.5 25%
5.4
5.0
5.0 4.7 4.7 20%
4.5
3.9 3.9 15%
4.0 3.5 3.5
3.2 3.1 3.2 10%
3.0 2.7 2.7 2.6
2.4
5%
2.0
0%
1.0 -5%
0.0 -10%
FHL NOS(EUR)
Source: FHL/NOS, DNB Markets
CAGR 96-14 Global supply growth (rhs)
Annual salmon prices (NOK/kg) & global supply growth NOK55/kg
55 25%
51
Highest ever EUR/kg change YoY is EUR1.5/kg…
50
50 20%
45
15%
Assuming 2016 will see the same increase, we are
looking at EUR6/kg…which at EURNOK9.2 equals
39 40
39
40 37
10%
35 NOK55/kg
31
30 30 5%
30
25 26 26
25
25 0% Each NOK/kg increase equals ~5% EPS increase
21 22
20 19
20 -5%
15 -10%
NSL/NOS/NQSALMON
Source: FHL/NOS, DNB Markets (NOK) Global supply growth (rhs) CAGR 96-11 (rhs) Source: FHL/NOS, DNB Markets
Analysts: Alexander Aukner (+47 24 16 90 79; alexander.aukner@dnb.no )Historical correlation suggests our estimates are conservative
2016… NOK54/kg
2017…NOK62/kg
Historical correlation suggest NOK54/kg and NOK62/kg, some NOK3/kg and NOK11/kg
above our estimates…
24NOK60/kg… How expensive is it really?
25NOK60/kg… How expensive is it really?
26NOK60/kg… How expensive is it really?
27Retailers still generating good margins
28But growth pains not permanent!
Norway - New technology and green licenses to ensure growth is restored after 2017:
New growth - Green licenses and R&D licenses take effect from late 2017, bringing growth back into positive territory.
Old growth - With the large number and wide variety of sea-lice combating technologies coming on stream, we expect the
challenges with sea-lice to be contained in 2–3 years, allowing growth from regular licenses in Norway to recover.
Chile – Revamp of the regularly system upcoming, with the support of large industry
players should spark a fresh start in Chile as:
Biomass drops;
New vaccines come on stream;
New regulations reduce uncertainty
This could mean Chilean volume growth in 2018-2019?
29Extension of the salmon cycle, this cycle looks set to last an unprecedented 8 years…
3 year cycles replaced by a 8 year cycle?
30Extension of the salmon cycle, this cycle looks set to last an unprecedented 8 years…
Conventional and non-conventional growth resume at the same time?
31Growth is set to gather pace post-2017
32New R&D license applications in Norway mushrooming…
Nr. Applicant Type of concept Output Capex Capex / license
Concept name Licenses MTB (kt) HOG (NOKm) (NOKm)
Nordlaks 'Farming Ship' 1 Nordlaks Oppdrett AS Semi submercibel sea farm 39 30,000 36 2100 54
AkvaFuture (closed concept in the sea)
2 AkvaDesign AS Closed consept 10 7,800 9
Gigante Offshore 3 Gigante Offshore AS "Supertankmerd" - rørkonstruksjon fortøyd på svai 8 6,240 7 500 63
Gifas Marine 4 Gifas Marine AS "SubFishcage" - nedsenkbar stormerd 4 3,120 4 120 30
Atlantis Subsea 5 Atlantis Subsea Farming AS, Sinkaberg Nedsenkbare oppdrettsanlegg 6 4,680 6
The Egg' 6 Marine Harvest Norway AS "Egget" - lukket merdteknologi 14 10,920 13
Aquatraz 7 MNH Produksjon AS "Aquatraz" - semi-lukket merd 8 6,240 7
Slam Collector 8 Blom Fiskeoppdrett AS Teknologi for oppsamling av slam 8 6,240 7
MARKOB 9 Lerow AS "MARKOB" - Semi-offshore messingnettmerd med 8 6,240 7 400 50
Arctic Offshore Farming 10 Norway Royal Salmon ASA og Aker ASA Halvt nedsenkbart offshore oppdrettsanlegg i stål 15 11,700 14 900 60
Akvahub 11 Norsk Marin Fisk AS og Stjernefarm SUS "AkvaHub" - behandling mot lus og AGD med ferskvann i 3 2,340 3 100 33
Steeline 12 Kobbevik og Furuholmen Oppdrett AS "Steelline" - lukket produksjonsenhet i syrefast stål 4 3,120 4 410 103
Eide Fjordbruk 13 Eide Fjordbruk AS Åpen dataplattform og tilhørende systemer 6 4,680 6
Beck-Cage 14 Marine Harvest Norway AS "Beck-cage" - Offshore nedsenkbare bur 6 4,680 6
Marine Donut 15 Marine Harvest Norway AS "Marine Donut" heldekkende, lukkede enheter 8 6,240 7
Pipefarm 16 Lerøy Seafood Group AS "Pipefarm" lukket flytende lengdestrømsanlegg 9 7,020 8
Ocean Farming 17 Ocean Farming AS (SalMar) "Havmerd" basert på offshoreteknologi 8 6,240 7 690 86
HeliXir 18 Måsøval Fiskeoppdrett AS "Helixir" avlusningsflåte 3 2,340 3
Total 167 129,840 156 kt output
Cermaq? ? ? ?
Others….? ? ? ?
• How to differentiate? First come, first served?
• How to define what is technologically new vs. old?
• Legal actions from backers of rejected projects?
Average project cost of NOK63m per license = NOK10.5bn capex need, pre working capital
3356kt of planned land based farming projects…
56kt of planned capacity, but most of the projects are not fully financed and volumes are
unlikely to hit the market until 2017–2020, if they receive financing. To put the volumes into
context, 56kt would represent 2.6% of our 2016 global supply forecast of 2,070kt (HOG)
34Extension of the salmon cycle, this cycle looks set to last an unprecedented 8 years…
?
Conventional and non-conventional growth resume at the same time?
35Protein peer multiples
36Alaska Department of Fish & Game projects 40% less wild salmon in 2016…
37Disclaimer
IMPORTANT/DISCLAIMER
This note (the “Note”) must be seen as marketing material and not as an investment recommendation within the meaning of the Norwegian Securities Trading Act of 2007 paragraph 3-10 and the
Norwegian Securities Trading Regulation 2007/06/29 no. 876. The Note has been prepared by DNB Markets, a division of DNB Bank ASA, a Norwegian bank organized under the laws of the
Kingdom of Norway (the “Bank”), for information purposes only. The Note shall not be used for any unlawful or unauthorized purposes. The Bank, its affiliates, and any third-party providers, as well
as their directors, officers, shareholders, employees or agents (individually, each a “DNB Party”; collectively, “DNB Parties”) do not guarantee the accuracy, completeness, timeliness or availability of
the Note. DNB Parties are not responsible for any errors or omissions, regardless of the cause, nor for the results obtained from the use of the Note, nor for the security or maintenance of any data
input by the user. The Note is provided on an “as is” basis. DNB PARTIES DISCLAIM ANY AND ALL EXPRESS OR IMPLIED WARRANTIES, INCLUDING, BUT NOT LIMITED TO, ANY
WARRANTIES OF MERCHANTABILITY OR FITNESS FOR A PARTICULAR PURPOSE OR USE, FREEDOM FROM BUGS, SOFTWARE ERRORS OR DEFECTS, THAT THE NOTE’S
FUNCTIONING WILL BE UNINTERRUPTED OR THAT THE NOTE WILL OPERATE WITH ANY SOFTWARE OR HARDWARE CONFIGURATION. In no event shall DNB Parties be liable to any
party for any direct, indirect, incidental, exemplary, compensatory, punitive, special or consequential damages, costs, expenses, legal fees, or losses (including, without limitation, lost income or lost
profits and opportunity costs) in connection with any use of the Note, even if advised of the possibility of such damages. Any opinions expressed herein reflect the Bank’s judgment at the time the
Note was prepared and DNB Parties assume no obligation to update the Note in any form or format. The Note should not be relied on and is not a substitute for the skill, judgment and experience of
the user, its management, employees, advisors and/or clients when making investment and other business decisions. No DNB Party is acting as fiduciary or investment advisor in connection with the
dissemination of the Note. While the Note is based on information obtained from public sources that the Bank believes to be reliable, no DNB Party has performed an audit of, nor accepts any duty of
due diligence or independent verification of, any information it receives. Confidentiality rules and internal rules restrict the exchange of information between different parts of the Bank and this may
prevent employees of DNB Markets who are preparing the Note from utilizing or being aware of information available in DNB Markets/the Bank which may be relevant to the recipients of the Note.
Please contact DNB Markets at + 47 22 94 89 98 for further information and inquiries regarding this Note, such as ownership positions and publicly available/commonly known corporate advisory
performed by DNB Markets etc, in relation to the Norwegian Securities Trading Act 2007/06/29 no. 75 and the Norwegian Securities Trading Regulation 2007/06/29 no. 876.
The Note is not an offer to buy or sell any security or other financial instrument or to participate in any investment strategy. Distribution of material like the Note is in certain jurisdictions restricted by
law. Persons in possession of the Note should seek further guidance regarding such restrictions before distributing the Note.
The Note is for clients only, and not for publication, and has been prepared for information purposes only by DNB Markets - a division of DNB Bank ASA registered in Norway with registration number
NO 984 851 006 (the Register of Business Enterprises) under supervision of the Financial Supervisory Authority of Norway (Finanstilsynet), Monetary Authority of Singapore, the Chilean
Superintendent of Banks, and on a limited basis by the Financial Services Authority of UK. Information about DNB Markets can be found at dnb.no.
Additional information for clients in Singapore
The Note has been distributed by the Singapore branch of DNB Bank ASA. It is intended for general circulation and does not take into account the specific investment objectives, financial situation or
particular needs of any particular person. You should seek advice from a financial adviser regarding the suitability of any product referred to in the Note, taking into account your specific financial
objectives, financial situation or particular needs before making a commitment to purchase any such product.
Recipients of the Note should note that, by virtue of their status as “accredited investors” or “expert investors”, the Singapore branch of DNB Bank ASA will be exempt from complying with certain
compliance requirements under the Financial Advisers Act, Chapter 110 of Singapore (the “FAA”), the Financial Advisers Regulations and associated regulations there under. In particular, it will be
exempt from: - Section 27 of the FAA (which requires that there must be a reasonable basis for recommendations when making recommendations on investments).
Please contact the Singapore branch of DNB Bank ASA at +65 6212 0753 in respect of any matters arising from, or in connection with, the Note.
We, the DNB group, our associates, officers and/or employees may have interests in any products referred to in the Note by acting in various roles including as distributor, holder of principal
positions, adviser or lender. We, the DNB group, our associates, officers and/or employees may receive fees, brokerage or commissions for acting in those capacities. In addition, we, the DNB group,
our associates, officers and/or employees may buy or sell products as principal or agent and may effect transactions which are not consistent with the information set out in the Note.
Additional Information, including for Recipients in the In the United States:
The Note does not constitute an offer to sell or buy a security and does not include information, opinions, or recommendations with respect to securities of an issuer or an analysis of a
security or an issuer; rather, it is a “market letter,” as the term is defined in NASD Rule 2211.
38You can also read