Is the Commercial Real Estate Market Sustainable? - Mark J. Eppli. Ph.D. Director, Graaskamp Center for Real Estate, University of Wisconsin ...
←
→
Page content transcription
If your browser does not render page correctly, please read the page content below

Is the Commercial Real Estate Market Sustainable?

                             Mark J. Eppli. Ph.D.
Director, Graaskamp Center for Real Estate, University of Wisconsin -- Madison
                            September 12, 2018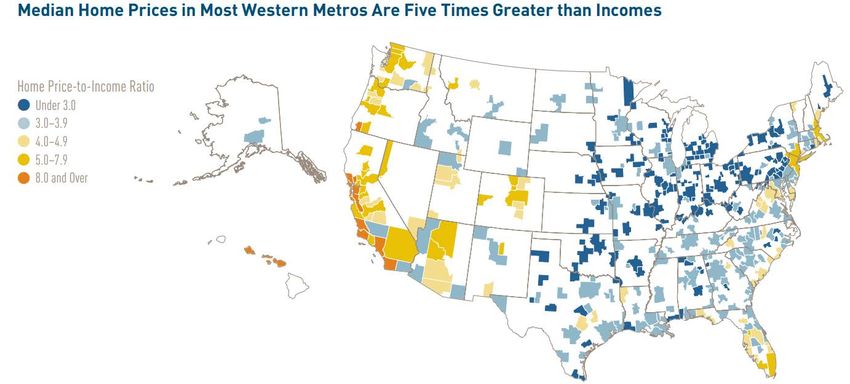
Is the Commercial Real Estate Market Sustainable?
I.     Investment Speculation
     •     Bitcoin or Florida land rush
II. Capital Markets (supply of and demand for capital)
     • Equity
     • Debt
III. GDP
     • Demand for space
IV. Construction
     • Supply of space
V. Rates
     • Employment Growth, pushing inflation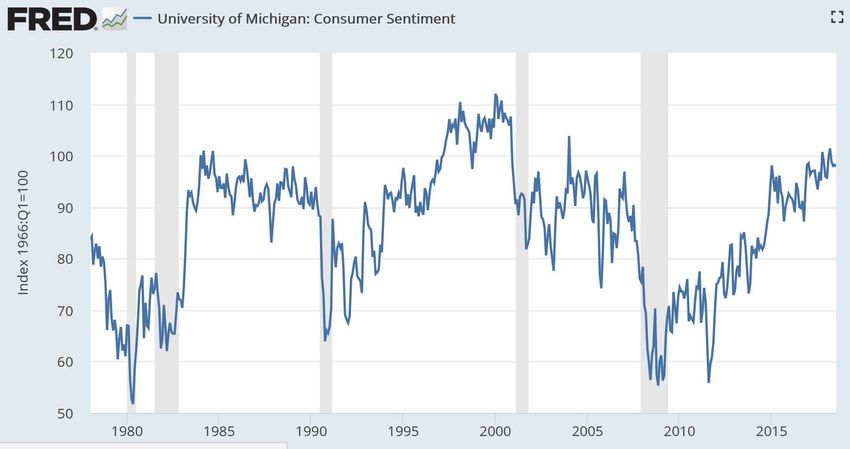
Speculation
The irrational bidding up of asset prices
Commercial property prices have rebounded and hit new highs . . . .

                              Source: Green Street Advisors and Graaskamp Center for Real Estate
. . . . . however the 2013-2018 real estate price appreciation looks different than 2002-2007 . . . .

                                           Source: Green Street Advisors and Graaskamp Center for Real Estate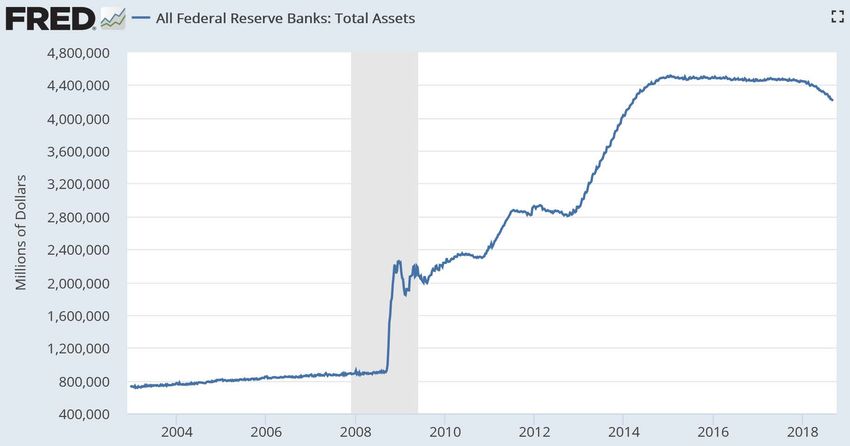
. . . . however, recent property cap rates, while at all time lows, but are stable . . . .

                                                             Source: Real Capital Analytics, July 2018.
. . . . property price appreciation reflects NOI growth . . . .

                                    Sources: NCREIF, and Graaskamp Center for Real Estate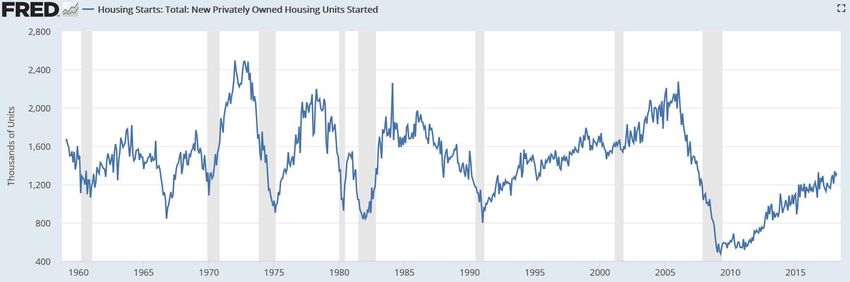
Speculative Bubble

• Commercial real estate price appreciation has moderated over the
  past three years (lowering the possibility of a speculative bubble)
• Property cap rates are at all time lows (enhancing a possible bubble)
• Solid NOI growth has justified part of the price inflation (lowering
  the possibility of a speculative bubble)

In summary, while commercial real estate is roughly fully priced, it is
not over priced relative to risk spreads for other asset classes), and is
not likely in a speculative bubble.

Capital Markets
The market for investment capital
Commercial Real Estate Equity Investment
. . . . commercial transaction levels are moderating . . . .
                                ....

   Source: Q1 2018 Mortgage Bankers Association’s Commercial/Multifamily Quarterly Databook.
. . . . . the 2012-2017 price increases look different than the 2002-2007 price increases . . . .
Source: NREI, December 2017, “Continuing to Cash in,” p. 20, and Graaskamp Center for Real EstatePension fund investment volume is in real estate is likely to remain strong . . . .
Source: Callan and Associates, Risky Business, September 2016 and Graaskamp Center for Real Estate. . . . Why the increase
in riskier assets? The
Actuarial Funded Ratio
(AFR) has dropped
from 103% in 2002 to
72% in 2016.
While the annual
required contribution
as a percent of payroll
has grown from 6.7% in
2001 to 17.6% in 2013 .
...
Source: Center for State and Local Government Excellence, www.slge.org.,
and Center for Retirement Research at Boston College, www.ccr.bc.edu.. . . . . institutional investors are increasing their planned allocation to real estate . . . .
Source: NREI, December 2017, “Continuing to Cash in,” p. 19, and The Graaskamp Center for Real Estate. . . . global private equity has stepped back a bit, however has dry power $136 billion in
2017 compared with $120 billion in 2016 . . . .
Global Private Equity Real Estate Funding
Source: WSJ, 1/3/18, page B7 and PreqinCommercial Real Estate Debt Investment
Big picture, total U.S. debt levels have stabilized as a percent of GDP . . . .

                                               Source: Federal Reserve and Marquette University
. . . . . commercial real estate debt outstanding . . . .
Commercial Debt Growth
Period 3-Year 5-Year 10-Year
Commercial through 2017Q3 5% 4% 1%
Commercial through 2008Q4 11% 12% 11%
Source: Federal Reserve Flow of Funds and Graaskamp Center for Real Estate.. . . . year-over-year cumulative construction lending growth . . . .
....
Source: Mortgage Bankers Association, Commercial Multifamily Real Estate Finance, 2018Q1 .. . . . as banks reveal solid discipline, tightening lending standards (HVCRE restrictions?) . . . .
Sources: Federal Reserve Economic Data and Graaskamp Center for Real Estate. . . . with low charge-off rates, banks are making money and will stay in the game . . . .
Sources: Federal Reserve Economic Data and Graaskamp Center for Real EstateCapital Markets Bubble • Institutional, private equity, and wealthy investors are likely to continue to invest in commercial real estate • The lending market will be robust, with greater competition from a lack of CMBS and other refinance loans • Property underwriting fundamentals are stable-to-good, with some apartment overbuilding In summary, the markets will be awash in debt, especially looking for income producing product (as opposed to construction loans) with modest pricing pressure.
GDP
(creating demand for space)
Since the Great Recession, GDP has grown at a modest 2.1%. At 110 months it is
the second longest of the 33 economic cycles since 1854 . . . .
GDP Growth 1960-2018Q2 (year-over-year)
10.0%
8.0%
6.0%
Average Growth Rate: 3.2%
4.0%
2.0%
0.0%
Apr-64
Jan-60
Oct-72
Jul-68
Mar-74
Apr-81
Jan-77
Oct-89
Apr-98
Jun-61
Aug-75
Jul-85
Mar-91
Jan-94
Oct-06
Apr-15
Jun-78
Aug-92
Jul-02
Mar-08
Jan-11
Dec-69
May-71
Jun-95
Aug-09
Nov-62
Jun-12
Sep-65
Feb-67
Dec-86
May-88
Nov-79
Sep-82
Feb-84
Dec-03
May-05
Nov-96
Sep-99
Feb-01
Nov-13
Sep-16
Feb-18
-2.0%
-4.0%
Sources: Federal Reserve Economic Data and Graaskamp Center for Real Estate. . . . GDP growth is largely impacted by two things: Thing One is employment growth. . . .
Sources: Federal Reserve Economic Data, Department of Labor, and Graaskamp Center for Real Estate. . . . and Thing Two is labor productivity, Things One and Two are trending slower . . . .
Non-Farm Business Labor Productivity (annual rate)
3.00%
2.50%
2.00%
1.50%
1.00%
0.50%
0.00%
1960-1970 1970-1980 1980-1990 1990-2000 2000-2010 2010-2017Q1
Sources: Federal Reserve Economic Data, Department of Labor, and Graaskamp Center for Real Estate. . . . GDP growth by component . . . .
Sources: Federal Reserve Economic Data. . . . primary GDP components . . . .
Sources: Federal Reserve Economic Data and Marquette University. . . . why are household’s spending? The wealth effect, and net worth is back . . . .
Sources: Federal Reserve Economic Data and Marquette University. . . . household liabilities growth remains low . . . .
2007-2017 CAGR = 0.81%
1997-2007 CAGR = 9.65%
Sources: Federal Reserve Economic Data and Marquette University. . . . leaving consumers with dry power . . . .
Sources: Federal Reserve Economic Data. . . . and confidence.
Sources: Federal Reserve Economic DataWhy the continued GDP growth? Business investment will re-emerge . . . .
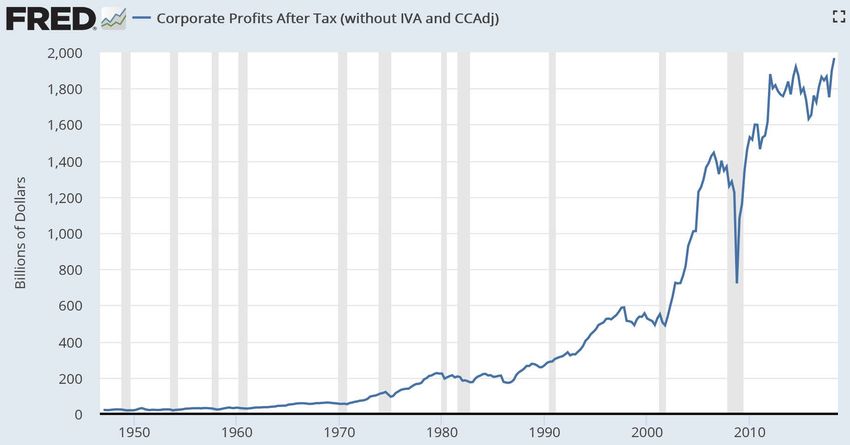
Sources: Federal Reserve Economic Data. . . . corporate profits are strong and will grow with lower tax rates . . . .
Sources: Federal Reserve Economic DataEconomic Growth (demand for space) • GDP never hit a period of rapid growth post-Great Recession • GDP will not take off like a rocket ship because of the Tax Act • Consumers have high net worth, modest debt and low debt service payments, and will continue to be the stable force behind GDP growth • Business investment will push growth by about 0.4-0.6% In summary, both consumption and business spending is well positioned for the coming 12-18 months
Construction
Is new construction creating an oversupply of space. . . .

                                     Average - $188 billion

Sources: U.S. Census
and Marquette University

                                                                  Sources: U.S. Census and Graaskamp Center for Real Estate
. . . . same chart as the previous slide, but accounting for inflation . . . ‘
Real Construction Put in Place by Property Type (2016=100)
350000
300000
Average - $225 billion
250000
200000
150000
100000
50000
0
1993 1994 1995 1996 1997 1998 1999 2000 2001 2002 2003 2004 2005 2006 2007 2008 2009 2010 2011 2012 2013 2014 2015 2016
Type of Construction: Apartments Office Retail Industrial Medical Office Hotel
Sources: U.S. Census and Graaskamp Center for Real Estate. . . . same chart as the previous slide but accounting for population growth
– do you evidence of a supply bubble!
Sources: U.S. Census and Graaskamp Center for Real EstateEmployment and Inflation
95 months of employment growth, the longest in history averaging 196,000 monthly jobs . . . .

                                                     Source: Federal Reserve Economic Data and Graaskamp Center for Real Estate
. . . . low unemployment and higher wages have increase labor force participation. . . .
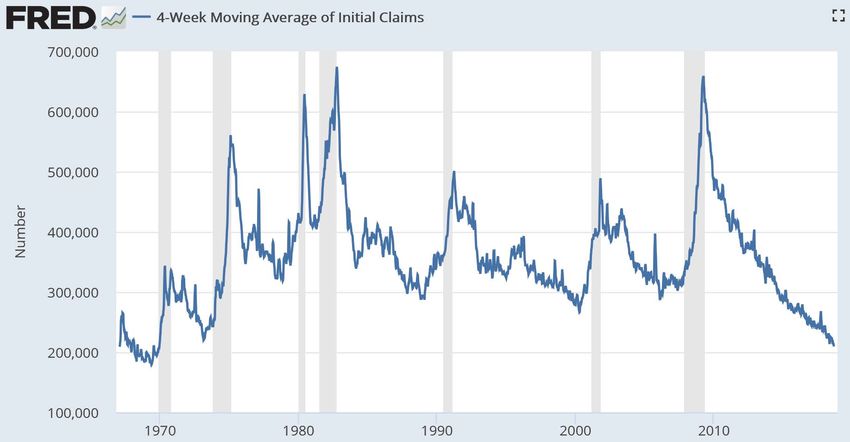
Sources: Federal Reserve Economic Data. . . . The labor force has more than doubled since 1967, with similar low initial
unemployment claims. . . .
Sources: Federal Reserve Economic Data. . . . the job market has dramatically tightened . . . .
Sources: Federal Reserve Economic Data and Marquette University. . . . wages have outpaced inflation since 2012 . . . .
Sources: Federal Reserve Economic Data, Federal Reserve Bank of Atlanta,and Graaskamp Center for Real Estate. . . . low unemployment push up wages, increasing inflation. . . .
Sources: Federal Reserve Economic Data and Graaskamp Center for Real EstateOther Factors Impacting Inflation and Interest Rates
. . . . . . Quantitative easing in reverse . . . .

                                          Source: Federal Reserve Economic Data
. . . . trade wars, lumber and other commodity increases are pushing up prices. . . .
Sources: Federal Reserve Economic DataWage inflation is emerging • 3.9% current unemployment rate is the lowest in 16 years (at or below full employment) • 95 months of month-over-month job growth limits the candidate pool • 18.9 million jobs is the largest job growth in a U.S. expansion • 180 weeks of initial unemployment claims remaining below 300,000 • College educated worker pool is fully employed In summary, about 70% of everything we purchase is labor and labor rates will increase in the coming year.
Summary of the Economy and the Commercial Lending Market in 2018
The Economy:
• Consumers remains confident, businesses have lower taxes
• Very tight labor market, expect wage inflation
• Fed will raise rates 3-4 times in 2018 flattening out the yield curve
• Early-2020 the economy will stall out

Commercial Real Estate Lending:
• Real estate fundamentals remain strong
• Supply of debt is larger than the demand, competition on terms
• Flattening yield curve, and active GSEs, moderate pricing pressure
• Higher rates and a step up in cap rates in late-2019/early-2020, will
  stall out the real estate markets
The State of the Economy, Homeownerhips and Housing Affordability

         I.   Housing Demographics

         II. Homeownership

         III. Housing Affordability
Housing Demographics
Millennials plan to marry and have kids, just like previous generations . . . .

           Percent of Young Adults Expecting to Marry, Have Kids

                          Source: “15 Economic Facts about Millennials,” The Council of Economic Advisors, Oct. 2014.
. . . . however, Millennials are marrying later in life . . . .
Source: U.S. Census.. . . . and households have changed, only 20% of households are married with children . . . .
Source: U.S. Census.. . . . household formation is overwhelmingly minority, the current white, non-
Hispanic birth rate is 1.8 per woman. . . .
Change in household formation 2010-2030 (in millions)
Source: “Headship and Homeownership: What does the Future Hold?” Goodman et al., June 2015, Urban Institute.. . . demand for housing (household formation) is 1.5+ million housing units per
year (including removals of 150,000-300,000 units per year). . . .
Source: Joint Center for Housing Studies, Updated Household Projections: 2015-2035, p. 17.. . . . and the supply of housing units is not keeping up with demand . . . .
Average: 1,434,000
Source: Federal Reserve Economic Data. . . . construction of smaller, lower costs starter homes remains low . . . .
Source: Joint Center for Studies of Harvard University, State of the Nation’s Housing Market, 2018, Figure 10, page 10.. . . . Milwaukee is similarly challenged with an inadequate supply of housing . . . .
Homebuilding was down about 6% in Metropolitan Milwaukee during the first half of 2018
According to MTD data:
The number of new permits were issued in Metro MKE was 684, down from 728 in 2017
The average size of a new home is 2,976, up from 2,796
The average value of a new home was $376,768, 9% more than $346,092 in 2017
In short, fewer, larger, and pricier homes for Milwaukee.
Source: Milwaukee Journal Sentinel, July 11, 2018, D1.. . . . why the lack of housing?
Since the Great Recession,
The supply of finished lots has significantly contracted nationwide:
• Land loans subject to greater lender scrutiny and reserve requirements (HVCRE and Basel III)
• Land development has a long lead time and is volatile limiting equity investment
• Many land developers went bankrupt during the Great Recession
• Many construction workers left the profession and many small construction companies failed
In short, limited supply of lots, limited supply of construction workers, limited number of construction companies,
yields a limited supply of new homesHomeownership
Property prices remain near or below 2006Q3 prices . . . .

                           Source: 2017 Fannie Mae Credit Supplement, February 18, 2018 .
. . . . since 2007 homeownership and homeownership rates have declined . . . .
Source: Joint Center for Housing Studies, The State of the Nation’s Housing: 2017, p 20.. . . . fewer owner-occupied units are pushing up house price appreciation . . . .
Source: 2017 Fannie Mae Credit Supplement, February 18, 2018 .. . . . six million homes went from owner-occupied to renter occupied . . . .
Source: Urban Institute, L. Goodman and K. Kaul : Fannie Mae’s Financing
of Single-Family Rentals: Good Pilot but Plenty to think about, February 2017.. . . .Wisconsin beat U.S. house price appreciation at 6.5% in 2017 . . . .
Source: Wisconsin REALTORS Association, interactive webpage:
https://www.wra.org/Resources/Property/Wisconsin_Housing_Statistics/. . . . price changes in 2017 varied significantly across price point . . . .
Source: National Association of REALTORS, Summary of January 2018 Existing Home Sales Statistics.. . . .2017 transaction volume in Wisconsin was up 1.4% over 2016 . . . .
Source: Wisconsin REALTORS Association, interactive webpage:
https://www.wra.org/Resources/Property/Wisconsin_Housing_Statistics/. . . .2017 Wisconsin foreclosures were the lowest in 17 years . . . .
Source: Wisconsin REALTORS Association, interactive webpage:
https://www.wra.org/Resources/Property/Wisconsin_Housing_Statistics/The Problem: Low national inventory levels, 3.5 month supply of for-sale housing . . . .
Source: National Association of REALTORS, Summary of January 2018
Existing Home Sales Statistics.The Local Problem: Low inventory levels, a 3.5 month for-sale housing in Wisconsin . . . .
Source: Wisconsin REALTORS Association, interactive webpage:
https://www.wra.org/Resources/Property/Wisconsin_Housing_Statistics/. . . . benefit of the Problem: Fewer average days on market . . . .
Source: Wisconsin REALTORS Association, The Inventory Problem: Causes Consequences
and the Future for Housing, https://www.wra.org/WREM/Jan18/EconomicForecast/. . . . echo . . . six million homes went from owner-occupied to renter occupied . . . .
Source: Urban Institute, L. Goodman and K. Kaul : Fannie Mae’s Financing
of Single-Family Rentals: Good Pilot but Plenty to think about, February 2017.. . . . fewer home for sale due to low mobility rates . . . . Source: The Brookings Institution U.S. migration still at historically low levels, census shows, William Frey, November 20, 2017
. . . . people are aging in place. . . .

        Source: The Brookings Institution U.S. migration still at historically low levels,
        census shows, William Frey, November 20, 2017
. . . . however, the upper Midwest is more affordable than the rest of the U.S. . . . .
Source: Joint Center for Studies of Harvard University, State of the Nation’s Housing Market, 2018, Figure 13, page 12.. . . . and there will be pent up demand from couples marrying later.
Source: HousingEconomics.com, NAHB, Missing Young Adult Households,
Natalia Siniavskaia, February 4, 2016.Housing Affordability
The dream of successive generations making more money than their parent’s
            generation is fading (the dream 30 years later) . . . .

               Source: Richard Reeves and Eleanor Krause, Raj Chetty in 14 Charts: Big findings on Opportunity
               and Mobility We Should All Know, Brookings, January 11, 2018.
. . . . a college education is highly correlated with family income, often limiting
upward mobility for lower-income families . . .
Source: Richard Reeves and Eleanor Krause, Raj Chetty in 14 Charts: Big findings on Opportunity
and Mobility We Should All Know, Brookings, January 11, 2018.. . . . and mobility from the lower fifth of the income distribution to the top fifth
is lower in the U.S. than in other countries . . . .
Source: Richard Reeves and Eleanor Krause, Raj Chetty in 14 Charts: Big findings on Opportunity
and Mobility We Should All Know, Brookings, January 11, 2018.. . . . . Homeownership rates are down across all ag cohorts except the 65-75 cohort . . . .
Homeownership Rates by Age, 1995-2014
Source: Joint Center for Housing Studies, Harvard, Rachel Borgardus Drew, February 2015.. . . . further, the net worth for lower two-fifths of the household is very low . . . .
Source: Joint Centers for Housing Studies at Harvard, State of the Nation’s Housing, 2016.. . . .FICO scores increased during and since the Great Recession. . . .
Source: Housing Finance at a Glance: June 2015, Urban Institute, Goodman et al.. . . .credit scores over the past five years . . . .
Source: Urban Institute, Housing Finance at a Glance, February 2018 p. 13.. . . . young adults have weak credit scores. . . .
FICO Score Distribution by Age Group in 2013
Source: “15 Economic Facts about Millennials,” The Council of Economic Advisors, Oct. 2014.. . . . low-income households have high housing burdens and are unable to save
for homeownership or retirement . . .
Source: Joint Center for Studies of Harvard University, State of the Nation’s Housing Market, 2018, Figure 32, page 31.. . . . many low income renters are severely burdened, with more than 50% of
their household incomes going to housing payments.
• 20.8 million renters are rent burdened with greater than 30% of
their household income used to pay housing costs
• 11.0 million renters are severely rent burdened with greater than
50% of household income going to housing payments
• Fully 80 percent of renters earning less than $30,000 were cost
burdened in 2016, including 55 percent with severe burdens.
Source: Joint Center for Studies of Harvard University, State of the Nation’s Housing Market, 2018, page 30.Single Family Summary • Single family appreciation rates will outpace inflation • Single family lending is available, but fairly tightly allocated given that we are nine years into an economic expansion • The shortage of single-family housing units is likely to persist for the coming 24 months • Incomes and housing opportunities are bifurcating, with many of the bottom income tiers housing or severely housing burdened
You can also read