Mid West Economic Insights - September 2020 - Limerick Chamber
←
→
Page content transcription
If your browser does not render page correctly, please read the page content below

Mid West
Economic
Insights
   September 2020

2                                                                       Mid West Economic Insights September 2020

     Foreword
                                The European Commission’s           Despite a rise to 51.9 in July, Irelands services PMI
                                (EC) Summer Forecast 2020           continues to lag behind that of the eurozone (55.1)
                                projects that the euro area         and the UK (56.6).
                                economy will contract by 8.7%
                                                                    As we continue to transition towards a full reopening of
                                in 2020 before recovering at an
                                                                    the economy it is clear that the true extent of the impact
                                annual growth rate of 6% in
                                                                    of COVID-19 is not yet known. Furthermore, the fate of
                                2021. This revised downward
                                                                    Ireland’s economy is dependent on a number of factors
                                estimate is reflective of
                                                                    including: 1) the stimulus policies adopted by the new
    the fact that there is still much uncertainty surrounding the
                                                                    government; 2) the impact of the ‘hard’ form of Brexit
    scale, duration and risk of resurgence for the
                                                                    that is now increasingly likely given the current state of
    pandemic. Each EU country has adopted a tailored
                                                                    the UK-EU negotiations; and, 3) changing
    approach to the reopening of its economy and, as such,
                                                                    international rules around taxation. One thing that we
    there will be a varied pace of recovery across Europe.
                                                                    can be sure of, however, is that any recovery across the
                                                                    regions is unlikely to be uniform.
    Ireland’s economy was in a strong position at the start of
    2020 with unemployment at 4.7% (CSO).
                                                                    Understanding the main components of the regional
    Furthermore, according to the EC, it was the only
                                                                    economy is vital in effectively lobbying for appropriate
    eurozone country to report growth (1.2%) in GDP in Q1
                                                                    policy instruments to support economic growth.
    2020. This growth was largely due to pharmaceutical
                                                                    Regional level data is limited and, as such, the purpose of
    exports, construction investment and manufacturing
                                                                    this report is to provide insights for members and
    activity. In contrast, overall eurozone GDP declined by
                                                                    policymakers on key areas of the Mid West economy.
    an unprecedented 3.6% in the same period. Ireland’s
    economic activity declined significantly in the second
                                                                    The principal findings of this reports include:
    quarter of the year due to lockdown restrictions
                                                                    • The Mid West labour market was in a strong position
    implemented in the fight against COVID-19. This is shown
                                                                      prior to COVID-19 with an unemployment rate of
    in Ireland’s manufacturing and services Purchasing
                                                                      4.9%, however, at the height of lockdown
    Managers Indices (PMI’s) which fell to 36 (from 45.1)
                                                                      unemployment hit almost 32%. This rate has now
    and 13.9 (from 32.5) respectively in April (HIS Markit).
                                                                      fallen to approximately 14.5% as a result of the
                                                                      phased reopening of the economy.
    In tandem with the easing of lockdown restrictions,
                                                                    • The number of FDI jobs in the Mid West has
    there was some evidence of increasing economic activity,
                                                                      increased since 2012, with IDA supported companies
    albeit at a much smaller rate to that seen prior to
                                                                      now accounting for 11.4% of regional employment
    the deployment of COVID-19 mitigation measures.
                                                                      compared to 9.5% in 2012.
    Retail sales increased by 29.5% in May following the
                                                                    • Growth in Mid West house prices has slowed in the
    introduction of Phase 1 of the reopening plan, which
                                                                      last year. Furthermore, there is significant variation
    allowed motor trade, hardware and electrical
                                                                      between average asking prices and sale prices.
    businesses to reopen. A further increase of 38.4%
                                                                    • Commercial office construction in Limerick is
    was reported for July. Ireland’s manufacturing PMI
                                                                      currently lagging behind that of Cork and Galway,
    increased from 39.2 in May to 57.3 in July as a result of
                                                                      however commercial industrial construction is ahead
    an increase in new orders and output. Output
                                                                      of Cork and Galway.
    expectations however in the context of the eight year
                                                                    • The Mid West is particularly exposed to the adverse
    series remained weak, reflecting continued uncertainty
                                                                      effect of COVID-19 on tourism with a potential loss in
    surrounding the impact of the pandemic and Brexit on
                                                                      revenue of between €372m and €496m forecast for
    the future business environment.
                                                                      2020.
    Growth in the services PMI in June was dampened by
    the restrictions still in place for many activities. While
                                                                    Dr Catríona Cahill
    the index rose to 39.7 (significantly well below the rate of
                                                                    Chief Economist
    59.9 recorded in February) the cautious approach taken
                                                                    Limerick Chamber
    by the Irish government to reopening the economy
    was particularly evident in light of the corresponding
    Eurozone PMI recording of 48.3.
3                                                                                        Mid West Economic Insights September 2020

    Contents

    Enterprise & Employment                                                                                                      4
    Property                                                                                                                     9
    Tourism                                                                                                                     17
    Business Sentiment                                                                                                          22

    Disclaimer
    Neither Limerick Chamber nor any person acting on behalf of Limerick Chamber is responsible for the use that might be made of the information
    contained in this publication.
4                  Mid West Economic Insights September 2020

    Enterprise
    & Employment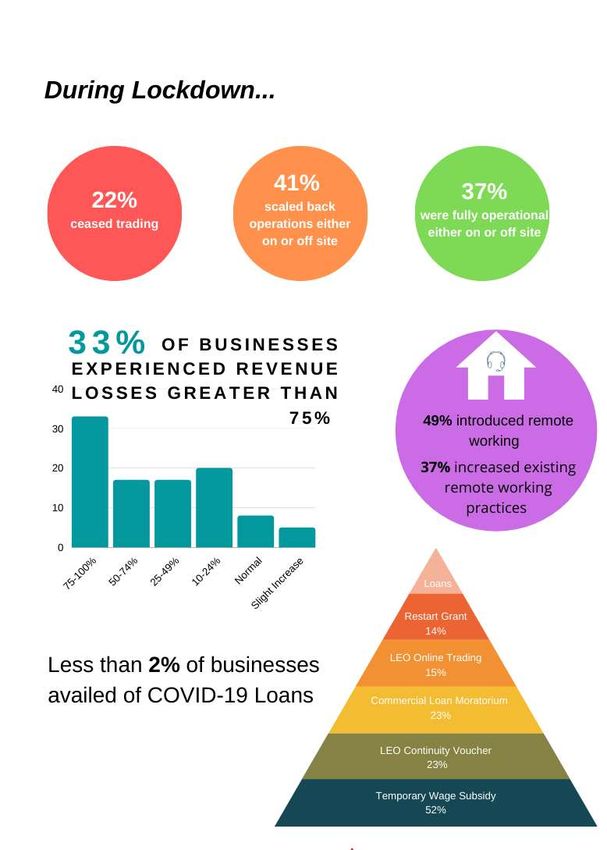
5                                                                                             Mid West Economic Insights September 2020

    Table 1.1 Mid-West Commercial Activities 2020

    By Share of Employment                                                  % total   By Share of Units                                   % total
    Industry                                                                 14.4     Agriculture, forestry and fishing                    45.6
    Wholesale and Retail                                                      13      Wholesale and Retail                                 11.8
    Human Health                                                             12.1     Accommodation and Food Services                       8.7
    Education                                                                 9.5     Other Services                                         5
    Accommodation and Food Services                                           7.1     Human Health                                          4.8
    Construction                                                              6.3     Professional, scientific and technical activities     4.1
    Public Administration and defence                                         6.2     Arts, Entertainment and Recreation                    3.4
    Agriculture, forestry and fishing                                         5.7     Construction                                          3.1
    Administrative and support services                                       5.1     Education                                             2.8
    Professional, scientific and technical activities                         4.7     Manufacturing                                         2.8

    Source: Authors’ calculations using data from CSO andGeoDirectory2020

    Industry remains the most significant                                             Two of the Mid West’s top 5 employment sectors are
                                                                                      heavily impacted by COVID-19: 1) Accommodation
    employer in the Mid West                                                          and Food Services (A&FS), and 2) Wholesale & Retail
                                                                                      (W&R). Other sectors where the impacts are
    Prior to COVID-19, 31,500 people were employed in
                                                                                      significant but somewhat less severe include the
    Industry (inc. manufacturing) representing 14.4% of
                                                                                      manufacturing and construction sectors. Businesses
    employment in the Mid West. In addition to being
                                                                                      in A&FS and W&R, in addition to associated businesses
    the sector with the largest employment share,
                                                                                      such as ‘Arts and Entertainment’, experienced a
    Industry is the second largest sectoral contributor to
                                                                                      significant reduction in activity in Q2 2020. Despite
    output in the Mid West representing roughly 44% of
                                                                                      some retail activities (e.g. grocery) exhibiting
    Gross Value Added.2 The remaining four sectors in
                                                                                      increased demand during the lockdown, the sector as a
    the top 5 can largely be grouped under services. In
                                                                                      whole was adversely affected.
    2015, these services accounted for the highest
    share of output in the Mid West at €8,014m (54.9                                  In addition, A&FS and W&R represent 20.5% of
    % of total output). Wholesale & Retail is the most                                commercial units in the Mid West. Given that these
    significant sector within services as it represents                               companies are predominantly based in city and town
    13% of employment and generated output of                                         centres, and are most at risk of closure, this is likely to
    €3,240m.                                                                          lead to an increase in commercial vacancies. Vacancy
                                                                                      rates in Limerick (15.9%), Clare (14.9%) and Tipperary
    The impact of COVID19 has not been uniform across
                                                                                      (14.2%) are already higher than the national average
    all sectors of the economy. The sectors that
                                                                                      (13.3%).
    successfully implemented remote working (e.g.
    finance and ICT) have been the least affected on the
    basis that they rely less on direct contact with
    consumers.

    2
        CSO 2018 based on 2015 data (data for the 2016 to 2018 period for the Mid West and South West is confidential)
6                                                                                                        Mid West Economic Insights September 2020

    Table 1.2 Mid West Labour statistics

                                                 Q1 2019                     Q2 2019                     Q3 2019                     Q4 2019             Q1 2020
        In employment ('000)
                                                    215.8                       216.5                       217.8                       215.8             218.4

          Unemployed ('000)
                                                     12.5                        14.0                        10.9                        11.1             11.4

        In labour force ('000)
                                                    228.3                       230.5                       228.7                       226.9             229.7

        Unemployment rate -
        Persons aged 15-74                             5.5                         6.1                         4.8                         4.9             5.0
                (%)

    Source: CSO 2020

    Mid West labour market in a strong                                                              significant increase in the traditional job benefit/seekers
                                                                                                   payment given that COVID-19 specific income support
    position prior to COVID-19                                                                     schemes (i.e. Pandemic Unemployment Payment (PUP)
                                                                                                   and Enhanced Illness Benefit (EIB)) were
    The Mid West labour market was in a strong
                                                                                                   implemented soon after the lockdown was declared.
    position prior to the outbreak of COVID-19 with an
                                                                                                   Therefore, to better understand the impact
    unemployment rate of 4.9%. The unemployment
                                                                                                   of COVID-19 on unemployment we consider data from
    rate of 5% recorded in Q1 2020 does not fully
                                                                                                   the PUP, EIB and the Temporary Wage Subsidy Scheme
    reflect the impact of COVID-19 as the outbreak
                                                                                                   (TWSS).
    occurred in the last two weeks of March.
    Furthermore, we should not expect to see a

    Figure 1.1 Covid-19 Income Supports - Mid West

    Source: Authors’ calculations using data from Department of Social Protection and Revenue Commissioners. Note: % of labour force on secondary axis
7                                                                  Mid West Economic Insights September 2020

                                                                However, it is evident that as restrictions now begin
    Mid West ‘unemployment’ reached
                                                                to lift and businesses have begun to reopen, the
    approximately 32% at height of                              number of people claiming PUP has started to fall,
                                                                while the number of people benefiting from the TWSS
    lockdown                                                    has continued to rise.

    The pattern of COVID-19 income support dependency           This indicates a return to employment for the majority of
    was largely uniform across the regions with a significant   these individuals as the reduction in PUP outweighs the
    number of individuals signing up to the PUP during          increase in applicants for traditional job seekers benefit.
    the lockdown period. At the height of the shutdown          As of the 15th September, 18,244 individuals were in
    approximately 32% of the Mid West labour force was          receipt of PUP in the Mid West (66.7% reduction from its
    in receipt of PUP, the EIB and traditional jobseekers.      height on the 7th May). The current ‘unemployment’
    The TWSS was introduced after the PUP and, as such,         rate for the Mid West is estimated to be almost
    TWSS take up was slower (furthermore businesses             14.5%.
    that experienced full closure did not initially avail
    of the scheme and instead furloughed
    employees).

    Figure 1.2 FDI Associated Employment

    More than a quarter of people living in Limerick are in FDI Associated
    Employment
    Figure 1.2 does not reflect the number of FDI jobs located in a county but rather the number of individuals
    who live in the county and are directly employed by an FDI company or an associated firm.

    At 25.3% Limerick has the second highest proportion of total employment by county.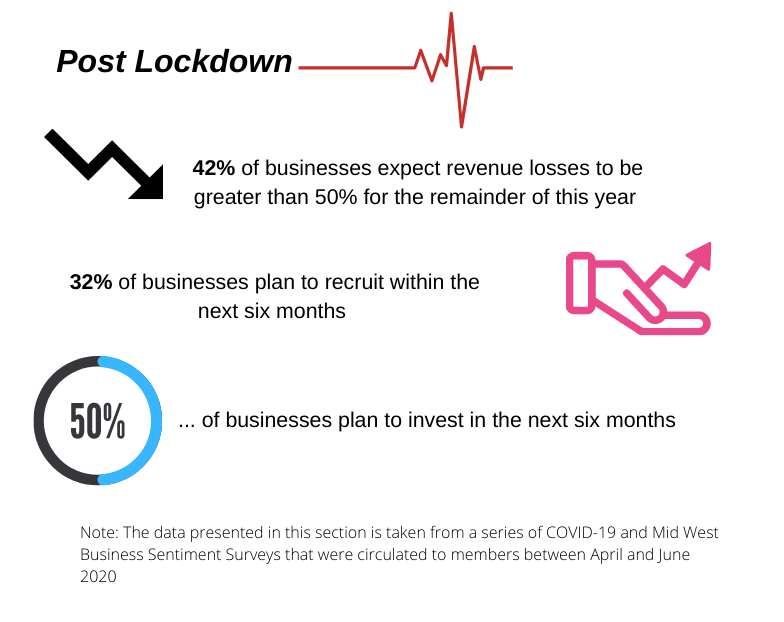
8                                                                                      Mid West Economic Insights September 2020

    Table 1.3 Employment in agency supported firms as a % of regional employment

                                            IDA SUPPORTED COMPANIES                                 EI SUPPORTED COMPANIES

                                         2012                2018                2019            2012           2018            2019

                STATE                     9.29               11.44               11.09           8.29            9.98           9.39

             MID-WEST                     9.50               11.24               11.44           7.12            8.94           8.90

                WEST                     10.48               14.14               12.84           7.65            9.61           8.64

               BORDER                     6.04                5.91                6.01           9.29           10.30          10.36

            SOUTH-EAST                    5.74                6.75                6.72           9.76           10.48          10.25

           SOUTH-WEST                    10.49               13.91               13.50           8.21            9.46           9.08

               DUBLIN                    12.50               15.90               15.45           9.03           11.19          10.31

              MID-EAST                    6.08                6.08                5.63           6.78           8.23            7.67

              MIDLAND                     4.89                5.61                5.27           8.15           10.44           9.00

    Source: Authors’ calculations using data from DEBI Annual Employment Survey 2019

    Number of Mid West FDI jobs                                                    higher percentage (11.4%) of FDI jobs than the state
                                                                                   as a whole. Unsurprisingly, Dublin has the highest
    continues to increase                                                          proportion of FDI jobs, however, in terms of Enterprise
                                                                                   Ireland supported jobs Dublin currently ranks second
    Table 1.3 provides a better indicator of the number
                                                                                   behind the Border region (Mid West in 6th). While it is
    of FDI jobs in each region. In 2019, 11.1% of all
                                                                                   evident from table 1.3 that the number of FDI jobs
    workers were directly employed in IDA supported
                                                                                   in the Mid West has grown since 2012, the
    companies. With the exception of the Border and Mid
                                                                                   indigenous SME sector remains the cornerstone of
    East, the proportion of FDI jobs has grown across
                                                                                   employment in the region.
    the regions since 2012. The Mid West has a slightly
9              Mid West Economic Insights September 2020

    Property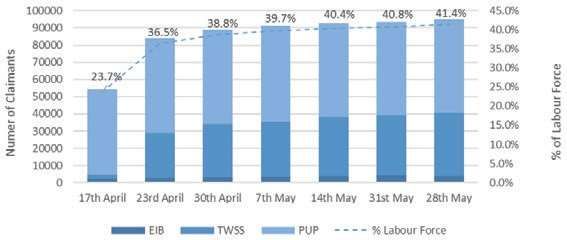
10 Mid West Economic Insights September 2020
Figure 2.1 Residential Property Price Index
170
160
150
140
130
120
110
100
90
Jun-15
Apr-16
Jun-16
Apr-17
Jun-17
Apr-18
Jun-18
Apr-19
Jun-19
Apr-20
Jun-20
Dec-16
Aug-15
Dec-15
Feb-16
Aug-16
Feb-17
Aug-17
Dec-17
Dec-18
Oct-17
Feb-18
Aug-18
Feb-19
Aug-19
Dec-19
Feb-20
Oct-15
Oct-16
Oct-18
Oct-19
National - houses National exc. Dublin - houses Mid West - houses
(BASE 2015 = 100)
Note: RPPI presented here represents houses and not apartments
Source: CSO 2020
Mid West Residential (House) It is worthwhile noting that this was in contrast to
a 0.9% increase nationally (exc. Dublin) and a
Property Prices rise by 0.7% in 0.2% decrease nationally (inc. Dublin).
the year to June
While it appears from the above data that COVID-19
has not had a significant impact on house prices to
National residential house prices increased by 0.3% in
date, it is difficult to determine how the housing
the year to June 2020. This compares with an
market will behave in the coming months. Outcomes
increase of 2.1% in the twelve months to June 2019.
will be influenced by a number of factors including: 1) the
In the Mid West, residential property prices increased
by 3.7% in the 12 months to June 2019 and by 0.7% extent of any reduction in supply due to house building
activity being reduced; 2) the impact on mortgage demand
in the year to June 2020. Overall, the national index is
and mortgage approvals; 3) the effect that COVID-19
16.2% lower than its highest level in April 2007, while
induced uncertainty will have on sentiment and
residential property prices in Ireland, excluding Dublin,
therefore volume sales; 4) the duration and nature of the
are 20.4% lower than their May 2007 peak.
physical distancing rules that remain in place to mitigate
While it is clear that the growth rate in house prices the spread of the virus; and 5) the threat of virus
is slowing, it is difficult to determine to what extent. resurgence.
There was a 1.9% reduction in house prices between
Q1 and Q2 2020 in the Mid West.11 Mid West Economic Insights September 2020
Table 2.1 House Prices Q1 2020
Daft CSO CSO
Daft CSO CSO
(Mean) (Mean) (Median)
(Mean) € (Mean) € (Median) €
Yr-Yr Yr-Yr Yr-Yr
% % %
Limerick City 201,778 202,606 175,366 0.9 4.4 4.0
Limerick 188,838 221,304 209,833 -3.8 9.4 12.7
Clare 186,805 194,985 186,416 -2.1 5.9 8.6
Tipperary 179,749 158,101 152,500 -1.9 -0.6 2.8
National 256,338 292,606 253,000 2.2 1.8 1.8
Source: Authors’ calculations using data from CSO and Daft
Table 2.2 House Prices June* 2020
CSO Daft CSO
Daft
(Mean) € Yr-Yr Yr-Yr
(Mean) €
% %
Limerick City 194,497 163,117 -3.6 -11.4
Limerick 181,838 232,692 -11.4 2.3
Clare 182,604 216,721 -7.5 13.9
Tipperary 173,633 170,876 -8.3 15.9
National 254,000 282,780 -3.3 -0.6
*Daft county level data not available for April/May
Source: Authors’ calculations using data from CSO and Daft.
Significant variation between asking It is evident from Tables 2.1 and 2.2 that there is
significant variation in some counties between the
prices and sale prices in the Mid West average asking price (Daft) and average sale price (CSO),
with houses in Limerick and Clare selling above the
With the exception of Limerick City, the average asking
asking price and houses in Tipperary below.
price for houses in the Mid West fell in the year to
April 2020. In a similar manner to Limerick City, The average value can be skewed by extreme values
asking prices across the four other main cities and often presents a misleading picture of the housing
were stable in the first quarter and largely unchanged market. The more appropriate measure of median prices
year-on-year. is therefore also provided in Table 2.1 and is explored in
more detail in Table 2.3. It can be seen that there is wide
Daft reported an unprecedented 5% drop in the variation in the prices of different types of properties as
average national asking price between March and well as buyer types, in part due to the small sample size
April. This was somewhat offset by a 3.7% increase of analysing county level data.
between April and May. While there was no
significant change in price levels in June, the
average asking price is now 3.3% lower than the
same time last year. Similar annual decreases are
reported for the Mid West (see table 2.2).12 Mid West Economic Insights September 2020
Table 2.3 Median House Price January - June 2020
FIRST Time Buyer Former Owner Occupier
Jan-Jun (€) Yr-Yr* (%) Jan-Jun (€) Yr-Yr* (%)
New
Limerick City 310,183 8.5 346,666 -3.2
Limerick County 316,431 5.4 335,462 5.1
Clare 266,126 7.9 274,838 -15.3
Tipperary 207,729 -11.6 229,522 8.9
National 338,365 1.2 377,399 0.9
Existing
Limerick City 163,266 -7.3 187,241 6.4
Limerick County 192,791 1.8 205,166 4.5
Clare 182,333 1.4 193,916 9.1
Tipperary 160,333 2.5 163,333 3.5
National 234,875 0.2 242,333 0.6
*Yearly calculation from July to June inclusive
Source: Authors calculations using data from CSO
Significant difference between median median prices in the Mid West for the January to July
period were for new houses in Limerick City (€346,666)
price for new and existing builds purchased by former owner occupiers. In terms of
existing houses, Limerick County held the highest
Table 2.2 shows the median value of new and existing
median value at €205,166.
dwellings for both first time buyers and former owner
occupiers. Nationally, the median price of new
houses for first time buyers in the first half of the
year was €338,365, while the median price of
existing houses was €234,875. The highest13 Mid West Economic Insights September 2020
Table 2.4 Rental Prices Q1 2020 & June 2020
DAFT Q1 RTB Q1 DAFT Yr-Yr* RTB Yr-Yr* Daft June June Yr-Yr
2020 (€) 2020 (€) (%) (%) (€) (%)
Limerick City 1,216 942 1.8 0.4 1,217 -0.7
Limerick County 928 956 7.4 2.8 925 3.4
Clare 887 734 6.6 5.4 879 2.4
Tipperary 867 706 4.3 5.6 858 0.7
National 1,418 1,221 3.8 5.4 1,412 0.5
*Yearly calculation from April to March inclusive ** Data for April/May not available
Source: Authors’ calculations using data from Daft and RTB
Limerick experienced the lowest The national average rent was €1,221 in Q1 2020. Upward
pressure on rents is largely driven by a significant number of
annual increase in rent across the households remaining in the rental sector as a result of
five cities excess demand, shortages in housing supply, affordability
issues and credit access issues. On an annualised basis,
In a similar manner to the variation in asking and sale rents in Limerick City experienced the lowest increase
prices for houses, there also exists a difference between across the five main cities as they only grew by a rate of 0.4
rental listing prices and agreed rent. A robust indicator per cent. Of the ‘Big 5’ cities, Limerick has the 2nd lowest
of rent is the Residential Tenancy Board (RTB) index average rent (€925) against Dublin (€1,702), Cork
which is based on regulatory data covering all new (€1,199), Galway (€1,156) and Waterford (€814) in Q1
tenancy agreements registered with the RTB nationally. 2020.
Figure 2.2 New Dwelling Completion
Units
Apartment completions fall in
2016 2017 2018 2019
Limerick
Limerick in 2019
House 267 462 483 538 Figure 2.2 shows dwelling completions between 2016
and 2019. The total number of dwelling completions in
Apartment 12 15 32 13
the Mid West increased by 87.2% between 2016 and
Total 279 477 515 551 2019. Housing completions rose year-on-year
Clare throughout the period but it is interesting to note that
between 2018 and 2019 apartment completions
House 221 244 242 369
increases in both Clare and Tipperary whereas they fell
Apartment 8 14 2 16 in Limerick.
Total 229 258 244 385
Unsurprisingly, new dwelling completions in the Mid
Tipperary West declined between Q1 (284) and Q2 (219) this
House 149 170 190 278 year mainly as a result of COVID-19 restrictions on
construction activity.
Apartment 14 13 11 47
Total 163 183 201 325
Source: CSO14 Mid West Economic Insights September 2020
Figure 2.3 Dwelling Unit Approvals 2018-2019
Source: CSO
Of the total number of dwelling units approved in the
Number of dwellings units approved Mid West in 2019, 207 were apartments and 3,022
in Limerick falls by 10.1% in 2019 were houses. Notably, there was an increase in the
number of apartment planning permissions granted in
Figure 2.3 shows the number of dwelling units that both Limerick and Clare.
received planning approval in 2018 and 2019. The
number of total dwellings units approved in Limerick fell
from 1776 to 1672. This drop of 10.1% is in
comparison to an increase of 8.9% in Clare and 29.2%
in Tipperary.15 Mid West Economic Insights September 2020
Commercial Property
Irish Office Market Q2 2020
Galway
Market Stock: 308,750 sq m
Take Up H1: 2,350 sq m
Availability: 16,100 sq m
Vacancy Rate: 5.2%
Under Construction: 23,650 sq m
Prime Rent: €323 sq m
Dublin
Limerick Market Stock: 3.8 million sq m
Take Up H1: 59,950 sq m
Market Stock: 367,000 sq m
Availability: 363,550 sq m
Take Up H1: 4,750 sq m
Vacancy Rate: 9.5%
Availability: 43,350 sq m
Under Construction: 544,470 sq m
Vacancy Rate: 10.9%
Prime Rent: €673 sq m (€323 sq m
Under Construction: 0 sq m
– Suburban)
Prime Rent: €250 sq m
Cork
Market Stock: 619,970 sq m
Take Up H1: 5,150 sq m
Availability: 53,650 sq m
Vacancy Rate: 8.7%
Under Construction: 38,500 sq m
Prime Rent: €355 sq m
Source: Cushman and Wakefield 202016 Mid West Economic Insights September 2020
Commercial Property
Irish Industrial Market Q2 2020
Galway
Market Stock: 480,985 sq m
Take Up H1: 24,050 sq m
Availability: 16,100 sq m
Vacancy Rate: 5%
Under Construction: 3,250 sq m
Prime Rent: €85 sq m
Dublin
Limerick Market Stock: 4.3 million sq m
Market Stock: 888,550 sq m Take Up H1: 119,300 sq m
Take Up H1: 83,700 sq m Availability: 335,650 sq m
Availability: 43,350 sq m Vacancy Rate: 7.9%
Vacancy Rate: 9.4% Under Construction: 65,985 sq m
Under Construction: 44,750 sq m Prime Rent: €110 sq m
Prime Rent: €70 sq m
Cork
Market Stock: 1.05 million sq m
Take Up H1: 44,950 sq m
Availability: 42,450 sq m
Vacancy Rate: 3.4%
Under Construction: 11,650 sq m
Prime Rent: €90 sq m
Source: Cushman and Wakefield 202017 Mid West Economic Insights September 2020
Tourism18 Mid West Economic Insights September 2020
Mid West Tourism in Numbers
Jan-Mar
Oct-Dec
18%
23%
73% When they
arrive..
Annual visitors increased from 1.5 million Apr-Jul
in 2012 to 2.6 million in 2018 28%
Jul-Sept
31%
Size of annual tourist market...
Tipperary Clare Limerick
€69m €244m €307m
Foreign vs Domestic Visitors (% of total visitors)...
Limerick
Clare
Tipperary
0 25 50 75 100
Healthy growth in tourist numbers and Limerick (50%) accounting for the majority.
Failte Ireland also noted in 2018 that each €1 million
prior to COVID-19 generated in tourist revenue will support 27 jobs, both
direct and indirect.
The Mid-West region has experienced substantial
growth in tourist numbers over the past decade, with a
73% increase in annual visitors since 2012. Failte
Ireland estimates that tourism contributes €620 million
in annual revenue to the region, with Clare (39%)19 Mid West Economic Insights September 2020
Table 3.1 Stock of Accommodation & Food Service Commercial Property 2020
Share of Total
Commercial Units in AFS Share of National AFS
Commercial Stock in
Sector Stock
Region/County
(%)
(%)
Dublin 4,442 12.0 19.7
Mid East 3,648 11.3 16.2
South East 2,201 13.6 9.8
Border 2,624 15.7 11.6
South West 3,903 15.8 17.3
West 2,963 16.7 13.2
Mid West 2,746 14.9 12.2
Limerick 898 12.6 4.0
Clare 1,020 20.5 4.5
Tipperary 828 13.0 3.7
National 22,527 13.8 100.0
Source: Authors’ calculations using data from GeoDirectory 2020
Clare commercial property is more & Food Services sector is slightly less than the
national average.
exposed to tourism downturn
The commercial sector in Clare seems particularly
The stock of commercial properties located within exposed to a downturn in tourist activity however, with
a region or area gives us an insight into the level one in five properties operating in the A&FS sector.
of economic activity.
Both Limerick and Tipperary’s proportion of
commercial stock that is in the Accommodation20 Mid West Economic Insights September 2020
Figure 3.1 Distribution of Urban Area Tourist Source
A resumption of domestic tourism
will benefit some regions more
than others
Figure 3.1 shows the distribution of foreign and
domestic tourism across the 4 main regional cities
outside of Dublin, along with the national average.
Limerick with its high dependency on foreign
tourism, coupled with its higher than average
dependency on North American tourism, needs
to brace itself for significant visitor and revenue
decline in 2020 and possibly beyond.
Source: Authors’ calculations using data from Failte Ireland
Table 3.2 Yearly Distribution of Tourism Revenue
County Annual Revenue Jan-Mar Apr–Jun Jul-Sep Oct-Dec
18% 28% 31% 23%
€m €m €m €m €m
Limerick 307 55 86 95 71
Clare 244 44 68 76 56
Tipperary 69 12 19 21 16
Total 620 112 174 192 143
Source: Authors’ calculations using data from Failte Ireland 2017/18.
Tourism Revenue losses for the year The OECD anticipates annual global tourism losses of
60-80%, which applied to the region would result in lost
could amount to half a billion euro revenue of between €372 and €496 million euro.
Using the most recent Failte Ireland Topline Regional The sector reopened for domestic tourism at the end of
Performance Report, Limerick Chamber has estimated June and there are hopes that ‘staycation’ growth
that the Mid-West faces losses of up to €174 million may contribute to a partial recovery.
for the second quarter of 2020.21 Mid West Economic Insights September 2020
Table 3.3 Airport Passenger Numbers Ireland
2013 2018 2019 2013-2019 2018-2019
% %
000's 000's 000's
National 24,681 36,521 38,053 54.2 4.2
Cork 2,253 (9.1%) 2,388 (6.5%) 2,586 (6.8%) 14.8 8.3
Dublin 20,149 (81.6%) 31,320 (85.8%) 32,677 (85.9%) 62.2 4.3
Kerry 306 (1.2%) 365 (1.0 %) 370 (1.0%) 20.8 1.2
Knock 666 (2.7%) 771 (2.1%) 805 (2.1%) 21.0 4.5
Shannon 1,308 (5.3%) 1,678 (4.6%) 1,616 (4.2%) 23.6 -3.7
*market share in parentheses
Source: CSO
Shannon Airport’s already challenging Despite overall growth of 23.6% in passenger
numbers between 2013 and 2019, it is important
economic position has been further to note that Shannon Airport’s market share
exacerbated by COVID-19 declined from 5.3% to 4.2% in the same period.
The impact of COVID-19 on the operations of
After several years of passenger growth following
Shannon Airport is of significant concern as the airport
separation from the DAA in 2012, Shannon Airport was
contributes €3.6 billion to the economy and supports
the only Irish Airport to report a drop in passenger
45,595 jobs (Copenhagen Economics, 2019).
numbers in 2019 (see table 3.3).22 Mid West Economic Insights September 2020
Business Sentiment23 Mid West Economic Insights September 2020
24 Mid West Economic Insights September 2020
Limerick Chamber      T: + 353 (0)61 415 180
96 O’Connell Street   E: info@limerickchamber.ie
Limerick              www.limerickchamber.ie
You can also read