Naive Bayes Method for Classification of Student Interest Based on Website Accessed
←
→
Page content transcription
If your browser does not render page correctly, please read the page content below

Journal of Physics: Conference Series

PAPER • OPEN ACCESS

Naive Bayes Method for Classification of Student Interest Based on
Website Accessed
To cite this article: Alwis Nazir et al 2020 J. Phys.: Conf. Ser. 1655 012104

View the article online for updates and enhancements.

 This content was downloaded from IP address 46.4.80.155 on 12/11/2020 at 15:55
URICSE 2020 IOP Publishing
Journal of Physics: Conference Series 1655 (2020) 012104 doi:10.1088/1742-6596/1655/1/012104

Naive Bayes Method for Classification of Student Interest
Based on Website Accessed

 Alwis Nazir, Amany Akhyar, Muhammad Ramadhani, Herlina
 Informatics Engineering Department, Faculty of Science and Technology
 Universitas Islam Negeri Sultan Syarif Kasim Riau
 Jl. HR. Soebrantas, Km. 15, Pekanbaru, 28293, Indonesia

 alwis.nazir@uin-suska.ac.id

 Abstract. Interest is a feeling of liking a thing or activity without any coercion. Students'
 interest in a certain subject will maintain students' learning abilities, thus they could master it
 and get good learning outcomes. Interest can be known from the website accessed. The aim of
 this study is to build a web-based application that could classify student interest using Naïve
 Bayes based on the website accessed. In this study, the data used are 17.265 student internet
 history data. The application was tested using Black Box and the method was tested using
 Confusion Matrix. The result from the application testing met the expectation, and the method
 (Naïve Bayes) reached 99,81% accuracy using 70:30 data percentage. The top five classes
 obtained are Social Networking, Educational Institution, Streaming Video, Search Engines,
 and Web-Based Mail. The “Develop” class was also found, thus the study group related to
 application development is recommended to be formed.

1. Introduction
Interest is a feeling of liking a thing or activity without any coercion. Researches show that there is a
relationship between learning interest and learning outcomes in various subjects [1–6]. Student interest
in a certain subject will maintain students' learning abilities, thus students could master the subject and
get good learning outcomes [7,8]. It’s also shown that if a student is interested in what they learn, the
results to be obtained will be satisfying.
 Interest can be determines and categorizes based on the user’s browsing history [9,10]. According
to Google and Facebook, interest-based advertising makes the ads displayed more targeted [11,12].
For example, ads that sell soccer equipment are displayed to users in sports interest categories, even if
they are on sites without soccer-specific content at that moment. It means, only users who interested in
sports (have ever accessed website about sports) would see soccer equipment ads. At the Islamic State
University of Sultan Syarif Kasim Riau, the student's browsing/internet history data has not used for
any purpose, thus the data stored is useless and consuming space of hard disk only.
 Based on the things mentioned above, the authors will classify student interests based on the
website accessed. The application which implements Naïve Bayes method would be developed to
classify the data (website accessed from the student’s internet history). From the classified data, we
could know what student really interest about. This could be a recommendation for university to form
the study group. Besides get to know what student really interest about, this study also would be
calculating the accuracy and error rate of Naïve Bayes in classifying student interest.

 Content from this work may be used under the terms of the Creative Commons Attribution 3.0 licence. Any further distribution
 of this work must maintain attribution to the author(s) and the title of the work, journal citation and DOI.
Published under licence by IOP Publishing Ltd 1
URICSE 2020 IOP Publishing
Journal of Physics: Conference Series 1655 (2020) 012104 doi:10.1088/1742-6596/1655/1/012104

2. Research Method
Workflows of this study can be seen in the following picture:

 PRE-PROCESSING
 NAÏVE BAYES CLASSIFICATION
 1. Subdomains and
 1. Class probability
 DATA COLLECTION website names
 2. Attribute probability
 separation
 3. Class determination
 2. Class formation

 INTERPRETATION
 EVALUATION
 Visualization
 Confusion Matrix
 (Graphics, Table)

 Figure 1. The details of the workflow

 The workflows start from data collection. The data used in this study obtained from several student
laptops and laboratory computers. The data collected then will be cleaned to obtain the subdomain and
website name, and then the classes will be formed. The classes will be formed based on the website
categorization, zvelo.com.
 The next step is to do classification with Naïve Bayes algorithm. Naïve Bayes will be used in this
study because of its simplicity, fast computing time, high accuracy [13–15], and it is also known as
one of the top 10 algorithms [16]. The Naïve Bayes method proved better than the K-Nearest
Neighbor method in classifying Indonesian journal articles [17] and movie reviews [18]. The Naïve
Bayes method also has better accuracy than the Support Vector Machine in classifying short story
categories [19].
 The percentage of training data and testing data used were 40:60, 50:50, 60:40, 70:30, and 80:20.
The classification is done by calculating the class probability, calculating the attribute probability, and
performing the class determination. The evaluation step was done by measuring the method
performance using the Confusion Matrix to calculate the accuracy and error rate. The application
testing was done by using the Black Box method. The last step is the interpretation which the student
interest would be displayed in the form of graphics and tables.

2.1. Data Collection
The data used in this study are internet history data collected from several student laptops and several
computers in the laboratory. This study only uses internet history data which is accessed from the
Science and Technology faculty building, assuming that students who access from one of the faculty’s
buildings are students of the faculty. The total data used is 17.265 data. Table 1 shows sample data.

 Table 1. Samples data
 URL
 https://yankesriau.wordpress.com/penyakit/fluburung/
 https://www2.facebook.com/repvblikan18?fref=nf&pnref=story
 http://www.developer.facebook.com
 https://www.youtube.com/watch?v=Zutnu5Dta3A

 2
URICSE 2020 IOP Publishing
Journal of Physics: Conference Series 1655 (2020) 012104 doi:10.1088/1742-6596/1655/1/012104

2.2. Pre-processing
The data will be cleaned by separating the protocol, subdomain, website name, and path from the
URL. The subdomain and website name would be used for further process. The following is the result
of cleaning data.
 Table 2. Samples data after cleaning process
 Subdomain Website Name
 Yankesriau Blogspot.com
 Facebook.com
 Developer Facebook.com
 Youtube.com

 Next, the class attributes are added to the data. Classes are obtained from zvelo.com by inputting
the data (subdomain and website name) into zvelo.com. The authors only input the 100 most accessed
websites, as shown in Table 3. Zvelo.com is a service provider of web categorization and also could
do web filtering, content categorization, and dangerous detection [20].
 This study will use 39 interest classes based on zvelo.com. The class would be formed manually if
zvelo.com cannot assign the class. These classes would later be used to describe students' interests.

 Table 3. 100 most accessed websites
 No. Website No. Website
 1 facebook.com 51 themeforest.net
 2 youtube.com 52 themes.loxdesign.net
 3 iraise.uin-suska.ac.id 53 statsmobi.com
 4 google.co.id 54 academia.edu
 5 mail.google.com 55 c.hwoxt.com
 6 google.com 56 mp3boo.me
 7 accounts.google.com 57 engine.4dsply.com
 8 file- 58 auindo.com
 manager.idhostinger.com
 9 developers.facebo ok.com 59 simak-ftk.uin- suska.ac.id
 10 cpanel.idhostinger.com 60 javascripting.com
 11 twitter.com 61 evoucher.co.id
 12 simak-fst.uin-suska.ac.id 62 elsfile.com
 13 oploverz.net 63 slideshare.net
 14 mediafire.com 64 tusfiles.net
 15 ganool.com 65 uk.zyro.com
 16 moviesovie.net 66 mylinkgen.com
 17 docs.google.com 67 solidfiles.com
 18 musicpleer.com 68 sortir.in
 19 developers.soundc 69 wisuda.uin- suska.ac.id
 loud.com
 20 gmail.com 70 link.safelinkconverter.com
 21 onclickads.net 71 Listerineindonesia.com
 22 how-old.net 72 bit.ly
 23 stackoverflow.com 73 error.hostinger.eu

 3
URICSE 2020 IOP Publishing
Journal of Physics: Conference Series 1655 (2020) 012104 doi:10.1088/1742-6596/1655/1/012104

 24 siasy.uin-suska.ac.id 74 u.kfcvisit.com
 25 kataloggrosir.com 75 demo.mapserver.org
 26 nowdownload.sx 76 bukalapak.com
 27 drive.google.com 77 id.savefrom.net

 Table 4. 100 most accessed websites
 No. Website No. Website
 28 soundcloud.com 78 esiontelracs.appspot.com
 29 8share.com 79 blogger.com
 30 games.co.id 80 scholar.google.com
 31 lazada.co.id 81 m.facebook.com
 32 subscene.com 82 wardhanime.net
 33 apps.facebook.com 83 accounts.youtube.com
 34 ad.directrev.com 84 feedburner.google.com
 35 my.myplaycity.com 85 sql11.idhostinger.com
 36 github.com 86 codeproject.com
 37 w3lessons.info 87 id.search.yahoo.com
 38 memecomicindon 88 codeigniter.com
 esia.com
 39 sireg.uin-suska.ac.id 89 edmodo.com
 40 idhostinger.com 90 members.phpmu.com
 41 ho.lazada.co.id 91 lp.ilividnewtab.c om
 42 tif.uin-suska.ac.id 92 mozilla.org
 43 demos.9lessons.info 93 goal.com
 44 l.facebook.com 94 adcash.com
 45 uin-suska.ac.id 95 mozilla.com
 46 searchpeack.com 96 idup.in
 47 scholar.google.co. id 97 indonesia- community.net
 48 goo.gl 98 animekompi.web.id
 49 safelinkreview.com 99 support.google.com
 50 adf.ly 100 otz5.com

 After the process at zvelo.com is complete, the class of data obtained as shown in the following
table.
 Table 5. Samples data with class
 No. Subdomain Website Name Class
 1 Facebook.com Social Networking
 2 Developers Facebook.com Social Networking
 3 Youtube.com Streaming Video
 4 Soundcloud.com Streaming Audio

2.3. Naïve Bayes Classification
Naive Bayes is one of the classification algorithms. The Naive Bayes algorithm (by British Scientist,
Thomas Bayes) utilizes probabilities and statistics to predict future probabilities based on the past

 4
URICSE 2020 IOP Publishing
Journal of Physics: Conference Series 1655 (2020) 012104 doi:10.1088/1742-6596/1655/1/012104

(known as the Bayes Theorem) [21,22]. Naive Bayes proved to have high accuracy and high speed
when applied to a large database [23]. The explanation of the Naive Bayes algorithm is as follows:

2.3.1. Class Probability
The prior class probability of this study was not known, thus each class will be assumed to have the
same value. Therefore, the class probability calculation was done using the following formula, with
is training data and , is the number of Ci training data classes on D.

 | , |
 ( ) = | |
 (1)

 The following are the results of probability calculations for each class that is obtained.

 Table 6. Probability of Each Class
 No. Class Probability P(Y)
 1 Computer Games 2/200 = 0,010
 2 Educational Institutions 37/200 = 0.185
 3 Educational Materials 1/200 = 0,005
 4 Finance 1/200 = 0,005
 5 Hobbies And Interest 1/200 = 0,005
 6 Marketing Services 1/200 = 0,005
 7 Movies 1/200 = 0,005
 8 News 1/200 = 0,005
 9 Online Ads 3/200 = 0,015
 10 Online Information Management 2/200 = 0,001
 11 Online Shopping 2/200 = 0,001
 12 Parked & For Sale Domains 2/200 = 0,001
 13 Personal Storage 3/200 = 0,015
 14 Piracy & Copyright Theft 1/200 = 0,005
 15 Redirect 1/200 = 0,005
 16 Search Engines 21/200 = 0,105
 17 Social Networking 47/200 = 0,235
 18 Streaming Audio 4/200 = 0,020
 19 Streaming Video 42/200 = 0,210
 20 Technology 3/200 = 0,015
 21 Web Hosting 12/200 = 0,060
 22 Web-Based Email 12/200 = 0,060

2.3.2. Attribute Probability
After the probability value of each class is obtained, the next step is to calculate the probability of each
attribute in each class.

 ( | ) = ∏ =1 ( | ) = ( 1| ) × ( 2| ) × … × ( 3| ) (2)

 Since all types of attributes are categorical, then ( | ) is the number of class data in D that
has an xk value for Ak (attribute), divided by | , |. Ak is attribute, while xk is Ak attribute value for
X data.

 5
URICSE 2020 IOP Publishing
Journal of Physics: Conference Series 1655 (2020) 012104 doi:10.1088/1742-6596/1655/1/012104

2.3.3. Class Determination
The final stage of the classification process is class determination. To determine the class label of X
data, it needs the highest ( | ) ( ), that is by taking the highest value from the multiplication
results of class probability ( ( )) and attributes probability ( ( | )).

2.4. Evaluation
Confusion matrix is a tool for analysing and measuring how well the classifier works [23–25]. Table 6
shows confusion matrix for two classes.

 Table 7. Confusion Matrix
 Predicted Class
 Yes No
 Yes TP FN
 Actual Class
 No FP TN

 The value of accuracy and error rate based on the confusion matrix can be calculated using the
following equations.
 ( + )
 = (3)
 ( + + + )

 ( + )
 = (4)
 ( + + + )

 The explanation about Table 6 and the formulas above are:
 ˗ TP (True Positive): the amount of correctly classified data (actual class (yes) =
 predicted class (yes))
 ˗ FN (False Negative): the amount of incorrectly classified data (actual class (yes) =
 predicted class (no))
 ˗ FP (False Positive): the amount of incorrectly classified data (actual class (no) =
 predicted class (yes))
 ˗ TN (True Negative): the amount of correctly classified data (actual class (no) =
 predicted class (no))

2.5. Interpretation
The interpretation step in this study is the process of visualizing and presenting information about
student interest based on the website accessed/internet history. The visualization itself is in the form of
graphics (bar charts) and tables to see the percentage of student interest classes. These graphics and
tables will be available in the application built. The application built is a web-based application. The
flowchart of an application built can be seen in the following figure.

 6
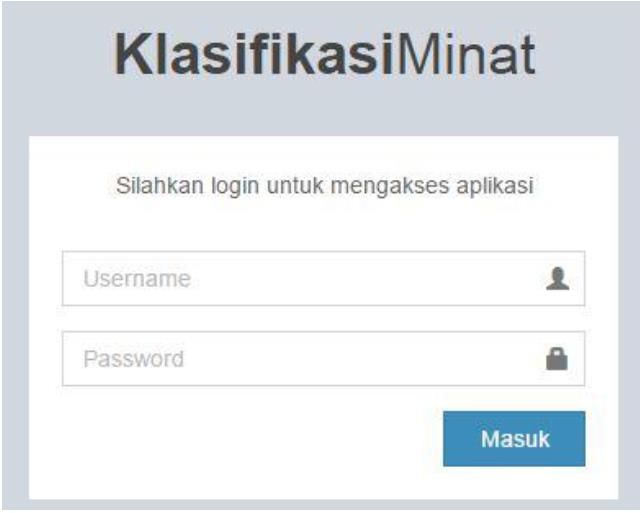
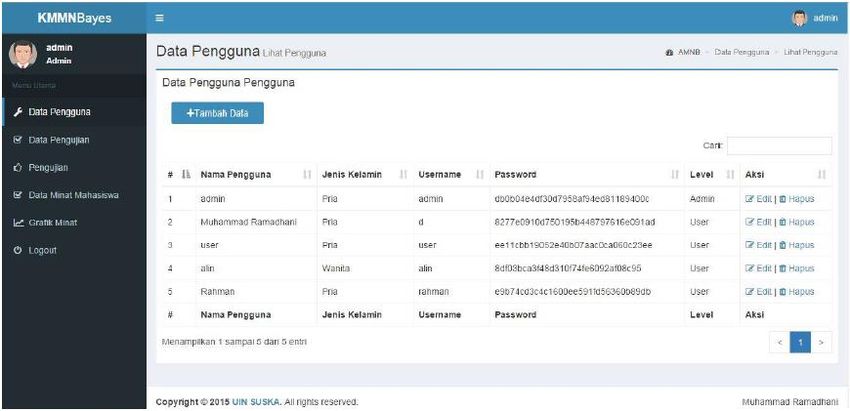
URICSE 2020 IOP Publishing
Journal of Physics: Conference Series 1655 (2020) 012104 doi:10.1088/1742-6596/1655/1/012104

 ADMINISTRATOR APPLICATION OPERATOR

 START
 START

 NO NO
 INPUT
 INPUT LOGIN
 LOGIN DATA
 DATA INPUT
 INPUT LOGIN
 LOGIN DATA
 DATA

 USERNAME
 USERNAME AND
 AND
 LOGIN
 LOGIN DATA
 DATA LOGIN
 LOGIN DATA
 DATA
 PASSWORD
 PASSWORD ARE
 ARE TRUE?
 TRUE?

 YES YES

 MANAGE
 MANAGE USER
 USER DATA
 DATA VIEW
 VIEW STUDENT
 STUDENT
 INTEREST
 INTEREST DATA
 DATA

 VIEW
 VIEW TESTING
 TESTING DATA
 DATA ADD
 ADD STUDENT
 STUDENT
 INTEREST
 INTEREST DATA
 DATA

 TESTING
 TESTING CLASSIFICATION
 CLASSIFICATION VIEW
 VIEW INTEREST
 INTEREST
 GRAPHIC
 GRAPHIC

 TESTING
 TESTING CALCULATE
 CALCULATE
 RESULT
 RESULT ACCURACY
 ACCURACY LOGOUT
 LOGOUT

 VIEW
 VIEW STUDENT
 STUDENT
 INTEREST
 INTEREST DATA
 DATA

 ADD
 ADD STUDENT
 STUDENT CLASSIFICATION
 CLASSIFICATION
 INTEREST
 INTEREST DATA
 DATA

 VIEW
 VIEW INTEREST
 INTEREST
 GRAPHIC
 GRAPHIC

 LOGOUT
 LOGOUT

 END
 END

 Figure 2. Flowchart of the application

3. Result and Analysis
The application which implements the Naïve Bayes method to classify student's interest based on
internet history has successfully built. Figure 3 is the login page of the application that has been built.
Figure 4 is the page that shows the users who have access rights to use the system. In this page, add
new users as well as edit the user data can also be done.

 7
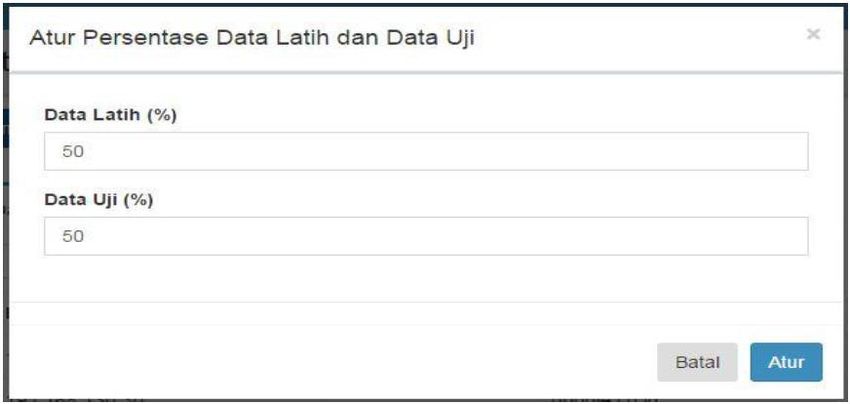
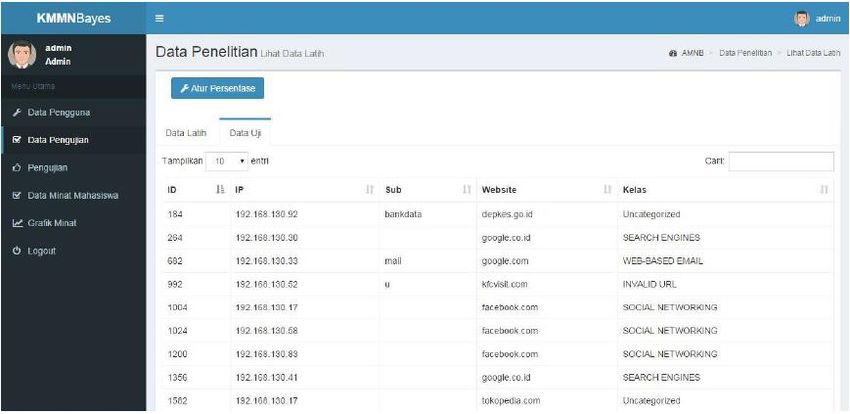
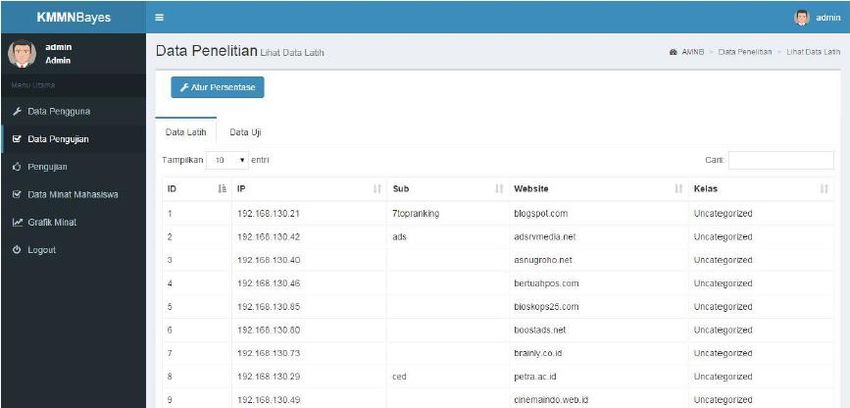
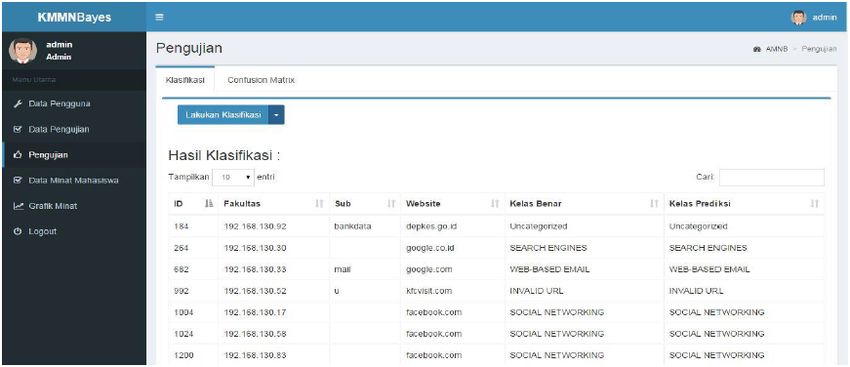
URICSE 2020 IOP Publishing
Journal of Physics: Conference Series 1655 (2020) 012104 doi:10.1088/1742-6596/1655/1/012104

 Figure 3. Login Page

 Figure 4. User Data Page

 Figure 5 shows the page to determine the percentage of training data and testing data for further
process (applying classifier). After the percentage was set, then it will show the training data page
(Figure 6) and testing data page (Figure 7). Training data page show the list of the training data, ang
testing data page show the list of the testing data. Both based on the percentage that have been set
before. Figure 8 shows the page of classification result (classification was done using Naïve Bayes
algorithm), based on the data that previously set.

 8
URICSE 2020 IOP Publishing
Journal of Physics: Conference Series 1655 (2020) 012104 doi:10.1088/1742-6596/1655/1/012104

 Figure 5. Data Percentage Settings Page

 Figure 6. Training Data Page

 Figure 7. Testing Data Page

 9
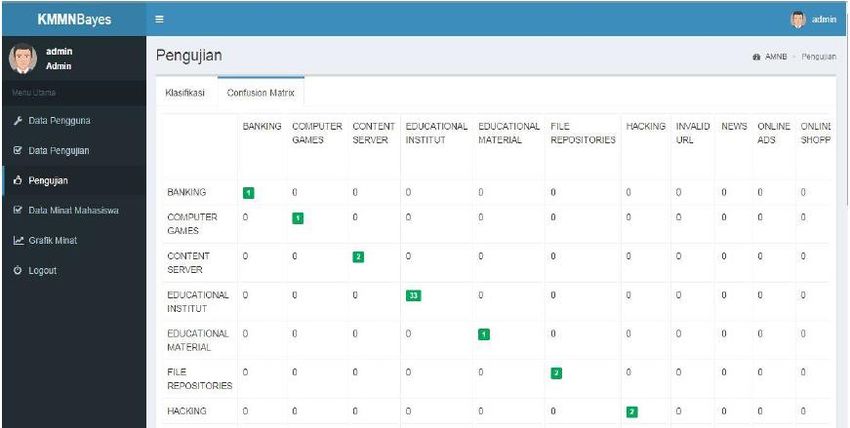
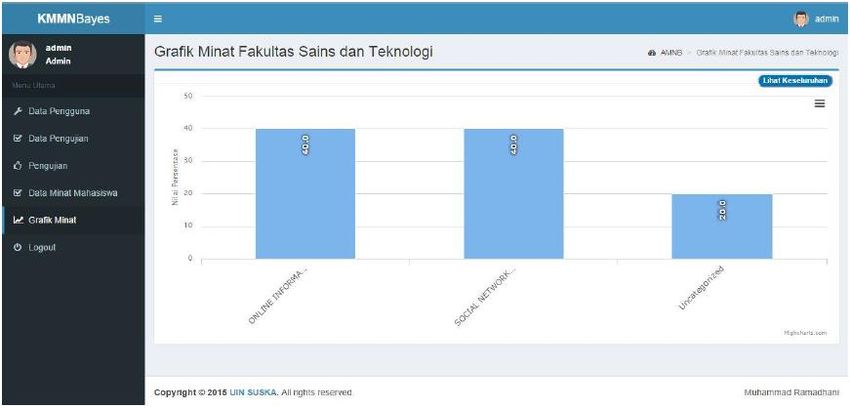
URICSE 2020 IOP Publishing
Journal of Physics: Conference Series 1655 (2020) 012104 doi:10.1088/1742-6596/1655/1/012104

 Figure 8. Testing Page (Classification Result)

 Figure 9 shows a confusion matrix based on the classification that has been done before. Figure 10
shows a graphic/bar chart of the interests’ classification that has been done.

 Figure 9. Testing Page (Confusion Matrix)

 10
URICSE 2020 IOP Publishing
Journal of Physics: Conference Series 1655 (2020) 012104 doi:10.1088/1742-6596/1655/1/012104

 Figure 10. Student Interest Graphic

 The application testing was performed using the Black Box method. Based on the application
testing, it can be concluded that the application runs as expected and all components/elements in this
system can be run well. Then, the method testing was performed using the Confusion Matrix. The
result of method testing using different percentages of training data and testing data can be seen in the
table below.
 Table 8. The Method Testing Result
 Data Percentage Result
 No.
 Training Data Testing Data Accuray Error Rate
 1 40 60 99,62% 0,38%
 2 50 50 99,65% 0,35%
 3 60 40 99,80% 0,20%
 4 70 30 99,81% 0,19%
 5 80 20 99,77% 0,23%

 Based on Table 7, the best results achieved are in the 70:30 percentage of training data and testing
data with 99.81% accuracy and 0.19% error rate.

4. Conclusion
Based on the workflows that has been done, the conclusions from this study are as follows:
 1. Naive Bayes can be used to classify student interests based on the websites they accessed
 (internet history).
 2. Based on the method testing using confusion matrix, the highest accuracy was found in the
 70:30 percentage of training data and testing data, with the 99.81% accuracy and 0.19% error
 rate.
 3. The top five interest classes are “Social Networking”, “Educational Institutions”, “Streaming
 Video”, “Search Engines”, and “Web-Based mail”.
 4. Numerous classes obtained from zvelo.com (web categorization service provider) cannot show
 the student’s interests. For example, “Search Engines” and “Educational Institutions”.

 11
URICSE 2020 IOP Publishing
Journal of Physics: Conference Series 1655 (2020) 012104 doi:10.1088/1742-6596/1655/1/012104

 5. The classification results show that there is a "Develop" student interest class. Thus, the study
 groups related to the application development should be formed to facilitate the interested
 students to more mastering that subject.

References
[1] Siagian R E F 2012 Pengaruh minat dan kebiasaan belajar siswa terhadap prestasi belajar
 matematika J Form J Ilm Pendidik MIPA 2(2) 122–31
[2] Sirait E D 2016 Pengaruh minat belajar terhadap prestasi belajar matematika J Form J Ilm
 Pendidik MIPA 6(1) 35–43
[3] Yusliyantoro S and Samidjo 2017 Hubungan minat belajar kejuruan dan prestasi belajar
 kewirausahaan dengan minat berwirausaha pada siswa kelas xi jurusan teknik pemesinan
 smk kristen 1 klaten tahun ajaran 2014/2015 J Taman Vokasi 5(1) 17–30
[4] Putri D T N and Isnani G 2015 Pengaruh minat dan motivasi terhadap hasil belajar pada mata
 pelajaran pengantar administrasi perkantoran J Pendidik Bisnis dan Manaj 1(2) 118–24
[5] Nurhasanah S and Sobandi A 2016 Minat belajar sebagai determinan hasil belajar siswa J
 Pendidik Manaj Perkantoran 1(1) 128–35
[6] Karina R M, Syafrina A and Habibah S 2017 Hubungan antara minat belajar dengan hasil
 belajar siswa dalam mata pelajaran ipa pada kelas v sd negeri garot geuceu aceh besar J Ilm
 Pendidik Guru Sekol Dasar FKIP Unsyiah 2(1) 61–77
[7] Ratiana R S, Pramudiyanti P and Yolida B 2014 Hubungan antara minat dan motivasi belajar
 dengan hasil belajar biologi J Bioterdidik 2(4)
[8] Linvill D 2019 Student interest and engagement in the classroom : relationships with student
 personality and developmental variables South Commun J 79(3) 201–14
[9] Abdallah W K, Asem A S and Senousy M B 2016 User intent discovery using analysis of
 browsing history Int J Adv Comput Sci Appl 7(10) 114–20
[10] Wang S, Liu Z, She L and Fu Y 2009 Algorithm research on user interests extracting via web
 log data. Int Conf Web Inf Syst Min 93–7
[11] Facebook 2015 Facebook business (core targeting)
 https://www.facebook.com/business/help/633474486707199#interests
[12] Google 2019 Google ads help (about audience targeting) https://support.google.com/google-
 ads/answer/2497941?hl=en
[13] Setiawan A, Astuti I F and Kridalaksana A H 2015 Klasifikasi dan pencarian buku referensi
 akademik menggunakan metode naïve bayes classifier (nbc) ( studi kasus : perpustakaan
 daerah provinsi kalimantan timur ) J Inform Mulawarman 10(1) 1–10
[14] Rizqiyani V, Mulwinda A and Putri R D M 2017 Klasifikasi judul buku dengan algoritma naive
 bayes dan pencarian buku pada perpustakaan jurusan teknik elektro J Tek Elektro 9(2) 60–5
[15] Wijaya A P and Santoso H A 2016 Naive bayes classification pada klasifikasi dokumen untuk
 identifikasi konten e-government J Appl Intell Syst 1(1) 48–55
[16] Wang S, Jiang L and Li C 2015 Adapting naive bayes tree for text classification Knowl Inf Syst
 44(1) 77–89
[17] Devita R N, Herwanto H W and Wibawa A P 2018 Perbandingan kinerja metode naive bayes
 dan k-nearest neighbor untuk klasifikasi artikel berbahasa indonesia J Teknol Inf dan Ilmu
 Komput 5(4) 427–34
[18] Dey L, Chakraborty S, Biswas A, Bose B and Tiwari S 2016 Sentiment analysis of review
 datasets using naïve bayes and k -nn classifier Int J Inf Eng Electron Bus 8(4) 54–62
[19] Somantri O 2017 Text mining untuk klasifikasi kategori cerita pendek menggunakan naïve
 bayes (nb) J Telemat 12(1)
[20] Zvelo 2019 About zvelo | we categorize the web https://zvelo.com/about/
[21] Zhang H, Kang Y, Zhu Y, Zhao K, Liang J and Ding L 2017 Novel naïve bayes classification
 models for predicting the chemical ames mutagenicity Toxicol Vitr
[22] Zhang H, Ding L, Zou Y and Huang S H H 2016 Predicting drug-induced liver injury in human

 12
URICSE 2020 IOP Publishing
Journal of Physics: Conference Series 1655 (2020) 012104 doi:10.1088/1742-6596/1655/1/012104

 with naıve bayes classifier approach J Comput Aided Mol Des
[23] Han J, Kamber M and Pei J 2012 Data mining concepts and techniques (Waltham: Elsevier)
[24] Tripathy A, Agrawal A, Rath S K 2016 Classification of sentiment reviews using n-gram
 machine learning approach Expert Syst Appl
[25] Dsouza K J, Ansari Z A 2018 Big data science in building medical data classifier using naïve
 bayes model IEEE Int Conf Cloud Comput Emerg Mark 76–80

 13
You can also read