CEF2 GIS DATA SUBMISSION - USER GUIDE
←
→
Page content transcription
If your browser does not render page correctly, please read the page content below
EUROPEAN CLIMATE, INFRASTRUCTURE AND
                                 ENVIRONMENT EXECUTIVE AGENCY (CINEA)

             CEF2 GIS DATA SUBMISSION

                                           USER GUIDE

                           Date:                             7 September 2021
                           Version:                          9

European Climate, Infrastructure and Environment Executive Agency (CINEA), B-1049 Brussels, BELGIUM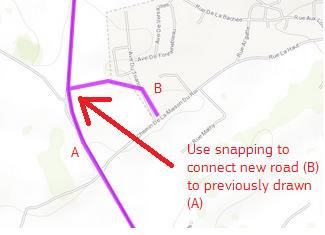
Table of Contents

1.     Introduction ....................................................................................................................................... 4

2.     Open the interactive map ................................................................................................................. 5
2.1.   Interactive map editor – overview of main map window .................................................................... 6
       2.1.1.     Toolbar – CEF Transport ................................................................................................... 6
       2.1.2.     Toolbar – CEF Energy ....................................................................................................... 6
       2.1.3.     Other window elements ..................................................................................................... 7

3.     Navigate to the location of your proposal ....................................................................................... 8
3.1.   Zoom using mouse scroll wheel.......................................................................................................... 8
3.2.   Zoom using map [+]/[-] buttons .......................................................................................................... 8
3.3.   Zoom using [+]/[-] keys on the keyboard ........................................................................................... 8
3.4.   Zoom to selected area ......................................................................................................................... 8
3.5.   Move the map using mouse (mouse panning) ..................................................................................... 8
3.6.   Move the map using keyboard keys (keyboard panning).................................................................... 8
3.7.   Find an address on the map ................................................................................................................. 9
3.8.   Zoom to an extent of all map features that you created ...................................................................... 9

4.     Select and visualise background map information. ..................................................................... 10
4.1.   How to change the basemap ............................................................................................................. 10
4.2.   Using CEF Transport reference data ................................................................................................. 11
       4.2.1.    How to show the TEN-T Network ................................................................................... 11
       4.2.2.    How to display the map legend ........................................................................................ 11
4.3.   Using CEF Energy reference data ..................................................................................................... 12
       4.3.1.    How to show the PCI network types ................................................................................ 12
       4.3.2.    How to display the map legend ........................................................................................ 12

5.     Creating CEF Transport application data ................................................................................... 13
5.1.   Select a tool to draw object(s) on the map ........................................................................................ 13
5.2.   How to draw an object ...................................................................................................................... 14
5.3.   How to draw an object "snapped" to other map objects .................................................................... 14
5.4.   How to add whole countries or NUTS regions ................................................................................. 15
5.5.   How to upload your GIS data ........................................................................................................... 16
5.6.   Modify an object which you drew earlier (if needed) ....................................................................... 18
       5.6.1.     How to modify the shape of the previously drawn object ................................................ 18
       5.6.2.     How to delete a point from a line or polygon................................................................... 19
       5.6.3.     How to delete a whole object ........................................................................................... 19
       5.6.4.     How to modify category of objects .................................................................................. 19
5.7.   Miscellaneous map operations .......................................................................................................... 20
       5.7.1.     How to work with a list of all map features which you created ....................................... 20
       5.7.2.     How to get information on the position or dimensions of objects.................................... 21
       5.7.3.     How to measure objects on map ...................................................................................... 22
       5.7.4.     How to print a map of the proposal .................................................................................. 22
       5.7.5.     How to export your data ................................................................................................... 22
       5.7.6.     Examples for CEF Transport ........................................................................................... 23

CEF2 GIS DATA SUBMISSION - USER GUIDE                                                                                                          Page 2 / 35
Document Version 9 dated 07/09/2021
6.     Creating CEF Energy application data......................................................................................... 24
6.1.   Select a tool to draw object(s) on the map ........................................................................................ 24
6.2.   How to draw an object ...................................................................................................................... 24
6.3.   How to draw an object "snapped" to other map objects .................................................................... 25
6.4.   How to add whole countries or NUTS regions ................................................................................. 26
6.5.   How to upload your GIS data ........................................................................................................... 27
6.6.   Modify an object which you drew earlier (if needed) ....................................................................... 28
       6.6.1.     How to modify the shape of the previously drawn object ................................................ 28
       6.6.2.     How to delete a point from a line or polygon................................................................... 29
       6.6.3.     How to delete a whole object ........................................................................................... 30
       6.6.4.     How to modify category of objects .................................................................................. 30
6.7.   Miscellaneous map operations .......................................................................................................... 30
       6.7.1.     How to work with a list of all map features which you created ....................................... 30
       6.7.2.     How to get information on the position or dimensions of objects.................................... 31
       6.7.3.     How to measure objects on map ...................................................................................... 32
       6.7.4.     How to print a map of the proposal .................................................................................. 32
       6.7.5.     How to export your data ................................................................................................... 33
6.8.   Examples for CEF Energy ................................................................................................................ 33

7.     Troubleshooting .............................................................................................................................. 34
7.1.   Application freezes ........................................................................................................................... 34
7.2.   Cannot see basemap selection box – use scroll bars ......................................................................... 34
7.3.   Cannot add many countries in one go using NUTS tool ................................................................... 34
7.4.   Cannot select a line with a double-click ........................................................................................... 34
7.5.   Cannot see basemap: canvas in zoom 5000 ...................................................................................... 34
7.6.   Interactive map hasn’t loaded for a very long time ........................................................................... 34
7.7.   No dialog opens when you click on the [Core Network Corridors], [Comprehensive
       Network], [Core Network] or [Electricity PCIs], [Gas PCIs] or [Smart Grids PCIs] buttons........... 34
7.8.   After deleting/adding an object on map and changing the map scale the object is
       visible/invisible. ................................................................................................................................ 34
7.9.   After selecting a layer from table of contents (e.g. Core Network Corridor, Electricity
       PCIs) it doesn't show up immediately on map. ................................................................................. 35

CEF2 GIS DATA SUBMISSION - USER GUIDE                                                                                                          Page 3 / 35
Document Version 9 dated 07/09/2021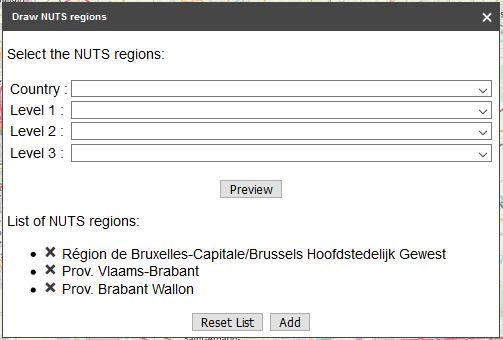
1. INTRODUCTION

Dear Applicant,
In the Electronic Submission of your CEF application you are also asked to provide a location
data of your proposal. To help you create such data we have developed the interactive GIS data
editor. All you need to do is to draw shapes (lines, points or polygons) which will represent
elements of infrastructure or areas affected by the proposed action. This manual will guide you
through the process of creating such a map.
In order to submit a map of your proposal you will have to:
(1)   Open the interactive map.
(2)   Navigate to the location of your proposal.
(3)   Select and visualise correct background map information.
(4)   Select a tool to draw object(s) on the map.
(5)   Modify an object, which you have drawn earlier (if needed).
Below you can find the detailed procedure for all of these points.
We strongly encourage you to prepare your map well ahead the submission deadline. Heavy
workload due to last moment submissions may make your work with interactive map difficult.
"A picture is worth a thousand words" - Correct geographic representation of your proposal may
contribute to its better understanding and easier evaluation. We encourage you to make a good
use of the interactive GIS data editor to make the best illustration of your proposal. You can
also use the interactive map to export images, which you can add to your proposal
documentation.

CEF2 GIS DATA SUBMISSION - USER GUIDE                                                  Page 4 / 35
Document Version 9 dated 07/09/2021
2. OPEN THE INTERACTIVE MAP
1 In the Portal Submission System, open your existing application or create a new one and open
  it for editing.
   Go to the submission wizard step “Proposal Forms”. In the section “Administrative forms”,
   click on the [Edit GIS data] button.

   The GIS data editor will open in a new browser tab. It may take several seconds to load.
   All users with full-access rights (from the coordinator and partners) can edit the GIS data.

   Please note that the GIS data is mandatory for the submission of the proposal.

   IMPORTANT NOTE: The GIS data is auto-saved, but – depending on your internet
   connection - it takes few moments to be synchronised with the submission system; please
   make sure you don’t leave it for the last minutes before call closure.

CEF2 GIS DATA SUBMISSION - USER GUIDE                                                      Page 5 / 35
Document Version 9 dated 07/09/2021
2.1. Interactive GIS data editor – overview of main map window

Please familiarize yourself with the tools in the main map window. The details on how to use
each tool will be provided later in the manual.

2.1.1. Toolbar – CEF Transport

                                    Open to draw your proposed objects on the map

                                    Open to upload existing GIS data

                                    Open to add countries/NUTS regions to your proposal

                                    Open to see a list of objects that you created

                                    Open to export the created GIS data to the Shapefile format

                                    Open to show Core Network Corridors on the map

                                    Open to show Core Network

                                    Open to show Comprehensive Network

2.1.2. Toolbar – CEF Energy

                                    Open to draw your proposed objects on the map

                                    Open to upload existing GIS data

                                    Open to add countries/NUTS regions to your proposal

                                    Open to see a list of objects that you created

                                    Open to export the created GIS data to the Shapefile format

                                    Open to show Electricity PCIs on the map
                                    Open to show Gas PCIs
                                        Open to show Smart Grid PCIs
                                    Open to show CO2 PCIs

CEF2 GIS DATA SUBMISSION - USER GUIDE                                                    Page 6 / 35
Document Version 9 dated 07/09/2021
2.1.3. Other window elements
Zoom in the map
Zoom out the map
Select a basemap
Zoom to extent of all geometries
created by an applicant
Open to measure distance, area or
get point coordinates
Open to locate an address on the map
Open to see map print preview
Click to open these guidelines
Current map scale
Scale bar
CEF2 GIS DATA SUBMISSION - USER GUIDE Page 7 / 35
Document Version 9 dated 07/09/20213. NAVIGATE TO THE LOCATION OF YOUR PROPOSAL
First, you need to find the area where the proposal is located. To do this use pan and zoom tools.
There are several methods for panning and zooming – you may use the one, which works best for
you. You can also use [Address locator] to find the address on the map.
3.1. Zoom using mouse scroll wheel
1 Move the cursor to a place to which you want to zoom
2 Roll the mouse scroll wheel to zoom in or out
3.2. Zoom using map [+]/[-] buttons
1 Click on either of the [+] an [-] buttons in the top left corner of the map window to zoom in
or out. Map will zoom around the center of the map
3.3. Zoom using [+]/[-] keys on the keyboard
1 Click on the [+] an [-] buttons on the numeric keyboard. Map will zoom around the center of
the map
3.4. Zoom to selected area
1 Press [SHIFT] button on the keyboard
2 Press and hold the left mouse button and draw a rectangle by dragging the cursor in the
desired direction, then release the mouse button (drag-and-drop). Map will zoom to that area
3.5. Move the map using mouse (mouse panning)
1 Put the cursor on the map and press the left mouse button
2 While keeping the left mouse button pressed move the map by dragging it in the desired
direction
3 Release the left mouse button
3.6. Move the map using keyboard keys (keyboard panning)
1 Use keyboard arrow keys to move the map around (up, down, left, right)
CEF2 GIS DATA SUBMISSION - USER GUIDE Page 8 / 35
Document Version 9 dated 07/09/20213.7. Find an address on the map
You can also locate proposals using addresses.
1
Click on the button from the menu on the top-right part of the application
2 Type the address – the application will suggest matching names as you type. You can select
one entry from the list by clicking it or continue typing
3 When you select an address it will be added to the list below the address window
4 Repeat the steps 2 and 3 to find more addresses
5 You can select addresses from the list by clicking on the checkbox next to it
6 Click on the [Zoom] button to zoom to the selected addresses
7 Click on the [Delete] button to delete the selected addresses
3.8. Zoom to an extent of all map features that you created
1
Click on the magnifier icon from the menu on top-right of the application. The map will
zoom and center automatically to the extent of your proposal data.
CEF2 GIS DATA SUBMISSION - USER GUIDE Page 9 / 35
Document Version 9 dated 07/09/20214. SELECT AND VISUALISE BACKGROUND MAP INFORMATION.
Once you have zoomed to the location of the proposal you may show on the map additional
information, which may be useful for your proposal. You can
display the Core Network Corridors or show the Core/Comprehensive network elements
on the map (CEF Transport proposals only).
display different PCI network types (Electricity, Gas, Smart Grids, CO2) on the map
(CEF Energy proposals only)
To help you correctly locate the proposal, a few additional background maps (basemaps) are
available in the editor. You may change the type of the basemap to one, which contains the most
useful information (e.g. topographic, street or satellite).
4.1. How to change the basemap
Select the basemap, which will provide the best reference for you to draw the proposal. You may
choose between different types: topographic, street map, satellite image and grey background.
E.g. if you want to draw a building, the "satellite" background may be most useful whereas grey
background is best for showing Core Network Corridors or Core TEN-T Network for larger areas
like regions or countries.
1 Click on the dropdown list from the top right corner of the map
2 Select a basemap, which you want to display by clicking on it.
CEF2 GIS DATA SUBMISSION - USER GUIDE Page 10 / 35
Document Version 9 dated 07/09/20214.2. Using CEF Transport reference data
This section applies to CEF Transport proposals only.
4.2.1. How to show the TEN-T Network
Buttons [Core Network Corridors], [Core Network] and [Comprehensive Network] open a popup
window with a hierarchical list of available data elements, which can be displayed/enabled on the
map by ticking a checkbox. Hierarchical means that an element can only be displayed if all
higher levels, it belongs to, are also enabled to display.
[Core Network Corridors]: location of Core Network Corridors. For each of the corridors
there is the possibility to enable the different transport modes individually;
[Core Network]: roads, railways, inland waterways and other elements of the Core Network
(more detailed than Core Network Corridors) – a distinction is made between EU and non-
EU Member States;
[Comprehensive Network]: roads, railways, inland waterways and other elements of the
comprehensive TEN-T Network (more detailed than Core Network) – a distinction is made
between EU and non-EU Member States.
How to display additional map layers
1 Click on [Core Network Corridors], [Core Network] or [Comprehensive Network] button
2 Browse through the groups of data elements by using expand [+] and collapse [-] buttons and
check the checkbox next to the name of the layer you want to display. Make sure that all
higher-level groups are also enabled. The desired layer will be displayed on the map (some
layers can show up slower than others due to a large number of objects, some layers may
only show when zoomed to a specific level)
How to hide additional map layers
1 Click on [Core Network Corridors], [Core Network] or [Comprehensive Network] button
2 Uncheck the checkbox next to the name of the layer, which you want to hide. The layer will
become invisible
4.2.2. How to display the map legend
Each of the windows used to select additional objects for CEF layers ([Core Network Corridors],
[Core Network] or [Comprehensive Network]) allows you to show the map legend explaining the
meaning of different symbols.
1 Click on [Core Network Corridors], [Core Network] or [Comprehensive Network] button
2 Click on the [Legend] bar at the bottom of the dialog window
3 If there are many layers and symbols use the mouse wheel to see the items at the bottom of
CEF2 GIS DATA SUBMISSION - USER GUIDE Page 11 / 35
Document Version 9 dated 07/09/2021the list
4.3. Using CEF Energy reference data
This section applies to CEF Energy proposals only.
4.3.1. How to show the PCI network types
Buttons [Electricity PCIs], [Gas PCIs], [Smart Grids PCIs] and [CO2 PCIs] open a popup
window with a list of available infrastructure elements, which can be displayed on the map by
ticking a checkbox:
[Electricity PCIs]: PCI Electricity infrastructure like storage, substations etc.;
[Gas PCIs]: PCI Gas infrastructure like terminals, compressor stations or pipelines etc;
[Smart Grids PCIs]: locations of Smart Grid PCIs;
[CO2 PCIs]: PCI CO2 infrastructure like terminal, injection etc
How to display additional map layers
1 Click on [Electricity PCIs], [Gas PCIs], [Smart Grids PCIs] or [CO2 PCIs] button
2 Check the checkbox next to the name of the infrastructure you want to display. The layer will
be displayed (some layers can show up slower than others due to a large number of objects)
How to hide additional map layers
1 Click on [Electricity PCIs], [Gas PCIs], [Smart Grids PCIs] or [CO2 PCIs] button
2 Uncheck on the checkbox next to the name of the infrastructure, which you want to hide.
Layer will become invisible.
4.3.2. How to display the map legend
Each of the windows used to select additional objects for PCI layers ([Electricity PCIs], [Gas
PCIs] or [Smart Grids PCIs]) allows you to show the map legend explaining the meaning of
different symbols.
1 Click on [Electricity PCIs], [Gas PCIs], [Smart Grids PCIs] or [CO2 PCIs] button
2 Click on the [Legend] bar at the bottom of the dialog window
3 If there are many layers and symbols use the mouse wheel to see the items at the bottom of
the list
CEF2 GIS DATA SUBMISSION - USER GUIDE Page 12 / 35
Document Version 9 dated 07/09/20215. CREATING CEF TRANSPORT APPLICATION DATA
This section applies to CEF Transport proposals only.
5.1. Select a tool to draw object(s) on the map
After locating the area of the proposal and checking the background information against Core
Network Corridors and Core Network you can start drawing the objects representing your
proposal.
Click on [Draw Proposal] button:
The editing menu will appear and you will be able to choose the type of proposal you wish to
draw:
Choose the tool, which will best reflect the type, scope and
other aspects of the proposal and click on it:
The type of an object drawn on the map can also be changed
later.
CEF2 GIS DATA SUBMISSION - USER GUIDE Page 13 / 35
Document Version 9 dated 07/09/20215.2. How to draw an object
1 Click on the [Draw Proposal] button
2 Click on the type of Proposal you want to draw
3 Move the cursor over the map
4 Left click on the map where you want to add a point or a starting point of a line or polygon
5 Continue drawing by left clicking on the locations of the remaining nodes of your line or
polygon
6 Double click to finish drawing your line or polygon
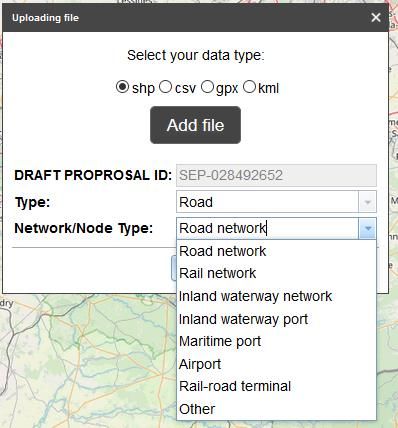
5.3. How to draw an object "snapped" to other map objects
Using this functionality is strongly encouraged if the object you draw is:
a part of a different object already existing on the map (e.g. section of an existing road,
railway or waterway of the "comprehensive network" only) or is physically linked to such
objects
or
is connected to another object which was drawn earlier (see the picture below)
1 Zoom to the area of your proposal to the scale bigger than 1/150 000 e.g. 1/100 000
2 Click on the [Comprehensive Network] button
3 Click on the [Roads], [Railways] or [Inland Waterways]. The layer(s) will be added to the
map
4 Click on the [Draw Action] button
5 Click on the type of Action you want to draw (point, line or polygon)
6 Move the cursor towards an existing line of [Roads], [Railways] or [Inland Waterways] or
another map object which you drew
7 Press and hold the [Alt] button. The red cross will appear on the existing line and will stay
CEF2 GIS DATA SUBMISSION - USER GUIDE Page 14 / 35
Document Version 9 dated 07/09/2021on the line if you move the cursor in its vicinity
8 Click on the spot where you want to add a point or a starting point of your line or polygon.
The point will be added where the cross is located. Release [Alt] button if you do not want
to "snap" to existing map objects.
9 Continue your drawing by clicking on the remaining nodes of your line or polygon
10 Double click to finish your drawing
5.4. How to add whole countries or NUTS regions
If you need to draw larger polygons like whole countries or NUTS regions, you don't need to
draw them by hand. Follow these steps to add them to the map:
1 Click on the [Draw Country/Region] button
2 [Draw NUTS regions] window will appear
3 Select country name and if needed names of lower level region(s)
4 Click on [Preview] to display and zoom onto the selected country/region
5 Click on [Add] to display the country/region on the map.
6 Repeat steps 3 - 5 to add other relevant regions
CEF2 GIS DATA SUBMISSION - USER GUIDE Page 15 / 35
Document Version 9 dated 07/09/20217 To remove a single region from the list click on the [x] symbol
8 To remove all regions from the list click on the [Reset List] button
9 Once you selected all the required regions, click on the [Add] button:
All the regions from the list will be added to the proposal.
Remark:
If the regions you are adding share a common border (e.g. two neighbouring countries) they
will be merged into a single polygon – this is an intended functionality.
5.5. How to upload your GIS data
If you already have GIS data for your proposal you can upload it and the map objects will be
created automatically. Be aware that the GIS data must have specific format to be loaded
correctly. The supported file formats are:
ESRI Shapefile (packed as a .ZIP file),
Comma separated CSV file,
GPS exchange format - GPX file,
KML file
The files should meet the requirements concerning the projection and structure.
Attention!
Shapefiles should be zipped (all files: .SHP, .SHX, .DBF, .PRJ, etc.) and submitted as a zip-file.
The Coordinate Reference System should be WGS 1984.
Comma separated files should have the following format (where X is longitude and Y is latitude):
CEF2 GIS DATA SUBMISSION - USER GUIDE Page 16 / 35
Document Version 9 dated 07/09/20211 Click on the [Upload File] button
2 Select the type of file which you want to upload
3 Click on the [Add file] button, select the file you want to upload and click [Open]
4 In the popup window define the Type of the uploaded proposal data and the type of
node/network they belong to:
Remark:
all data of the input file will be encoded with the Type and Network/Node type as selected.
If many Types and/or many Network/Node types should apply to the data, make sure that
you organise your input in separate file accordingly.
5 After loading you will receive a message stating if the data has been loaded successfully
CEF2 GIS DATA SUBMISSION - USER GUIDE Page 17 / 35
Document Version 9 dated 07/09/20215.6. Modify an object which you drew earlier (if needed)
5.6.1. How to modify the shape of the previously drawn object
1 Select an object by clicking on it
If you clicked on place where several objects overlap you will see the information about
number of objects and arrow buttons to change selection
2 Click on the [Edit Geometry] button
3 Click on the white and grey points, keep left mouse button pressed and move the cursor to
modify the shape
4 Double click anywhere on the map to save the changes
CEF2 GIS DATA SUBMISSION - USER GUIDE Page 18 / 35
Document Version 9 dated 07/09/20215.6.2. How to delete a point from a line or polygon
1 Select an object by clicking on it
2 Click on the [Edit Geometry] button
3 Click the right mouse button on the grey point you want to delete. The [Delete] button will
appear
4 Click on the [Delete] button. The selected point will be removed. Note that you cannot delete
a point from a polygon that exists out of only 3 points and a line of 2 points
5.6.3. How to delete a whole object
1 Select an object by clicking on it
2 Click on the [Edit Geometry] button
3 Click on the [Delete] button from the menu. The selected map feature will be deleted
5.6.4. How to modify category of objects
1 Select an object by clicking on it
CEF2 GIS DATA SUBMISSION - USER GUIDE Page 19 / 35
Document Version 9 dated 07/09/20212 Click on the [Edit Geometry] button
3 Select a value from the dropdown list e.g. [Rail]
4 Click on the [Save] button. The attribute will be changed
5.7. Miscellaneous map operations
5.7.1. How to work with a list of all map features which you created
1 Click on the [List of Proposal Geometries] button. A new panel with a list of map features
which you created will appear
CEF2 GIS DATA SUBMISSION - USER GUIDE Page 20 / 35
Document Version 9 dated 07/09/20212 Use button(s) [Polygons], [Lines] or [Points] to display list of polygons, lines and points
from your proposal
Click on a single row in a table to select a single map feature.
Once a row or rows are selected you can use:
- Magnifier glass button to zoom to selected map feature;
- Delete button to delete selected map feature(s).
Use a button with a tick mark to select all map features from a table.
Use a button with a cross to unselect all selected rows.
REMARK:
If a map feature has 0 area or 0 length it means that geometry has not been created for that
feature. This is usually due to an error in importing data. Such rows can be deleted using the
delete button.
5.7.2. How to get information on the position or dimensions of objects
1 Select an object by clicking on it
2 Click on the [Measure] button
3 The information about object area (for polygons), length (for lines) or coordinates (points)
will be displayed in a pop up window
4 Click on the [X] button to close the information window.
CEF2 GIS DATA SUBMISSION - USER GUIDE Page 21 / 35
Document Version 9 dated 07/09/20215.7.3. How to measure objects on map
Measure distances, areas or get point coordinates.
1 Click on the [Measure] button
2 Select the type of measurement
Area Length Coordinates
3 Select measurement units
4 Click on a map to draw a point, line or polygon. The result will be shown in the
measurement window
5 Click on the [x] icon to close the measurement window and remove measurement graphic
from the map
5.7.4. How to print a map of the proposal
Print a simple map with proposal features only (no other map layers can be shown on a printed
map)
1 Click on the [Print] button. Print preview page will open
2 Zoom and pan to the map extent which you want to print
3 Click on the [Print] button from the top of the print preview
4 Pan and zoom the map print preview if needed
5 Follow the steps for printing of the browser which you use
5.7.5. How to export your data
You can export your data to a downloadable GIS file.
CEF2 GIS DATA SUBMISSION - USER GUIDE Page 22 / 35
Document Version 9 dated 07/09/20211 Click on the [Export data] button
Click the [Create Shapefiles] button.
2 After the export is complete, a [Download Shapefiles] links will appear.
5.7.6. Examples for CEF Transport
Examples of actions and the tools, geometry types and categories you should use to draw them.
Proposal subject Tool Type of geometry
Construction of charging station(s) [Draw Proposal] Point –
Alternative fuels
for….
Construction or upgrade of a section [Draw Proposal] using Line – Road, Rail
of road, railway or inland waterway. snapping to existing roads, or Inland
railways, inland waterways waterway
from [Comprehensive
Network]
Construction or upgrade of a [Draw Proposal] Draw the Polygon –
terminal (port, airport, multimodal) outline of the area of upgraded Infrastructure area
or newly constructed
installations.
Ferry or locomotive refitted with a [Draw Proposal] Draw the Line - Rail
new equipment operating on route route
Ferry or locomotive refitted with a [Draw Proposal] Draw area or Polygon –
new equipment to operate in the use [Draw Country/Region] to Deployment area
specified area. create larger areas (regions,
countries)
A ship with new equipment [Draw Action]. Mark each port Point - ???
operating between a number of with a point.
ports
Implementing an information [Draw Action] Draw area or Polygon –
system in an area use [Draw NUTS] to create Deployment area
larger areas (regions, countries)
Implementing information system [Draw Action] using snapping Line
on a section of a route to existing roads, railways,
inland waterways from
[Comprehensive Network]
CEF2 GIS DATA SUBMISSION - USER GUIDE Page 23 / 35
Document Version 9 dated 07/09/20216. CREATING CEF ENERGY APPLICATION DATA
This section applies to CEF Energy proposals only.
6.1. Select a tool to draw object(s) on the map
After locating the area of the proposal and checking the background information against PCIs
you can start drawing the objects representing your proposal. Before you start you need to decide
to which type and category they belong. Available types are: points, lines and polygons.
Categories are: "Physical locations" and "Not physical locations". Categories are used to
determine if the object you want to draw represents a physical, fixed structure or rather a line or
area covered by an information system. Category can be later changed for an object drawn on the
map.
Below you will find more details to help you choose the right type and category.
Types:
Proposal – Point representation – use it for point objects like substations, compressor
stations to be constructed/modified in the proposal;
Proposal – Line representation – use it if the proposal refers to an existing or planned
pipeline or high-voltage line;
Proposal – Polygon representation – use it if your proposal concerns a construction of a
larger object like a terminal or a region, e.g. a region where a new information system will
be available or where a study will conducted. Please note that we have provided a tool that
allows you to select the name of a region or a country to draw automatically so that you do
not have to draw map objects covering administrative areas or countries by hand - see "How
to add whole countries or NUTS regions".
Categories:
Physical location – physical intervention done to an element of infrastructure. For example
an existing or planned substation, compressor station, pipeline, transmission line or a
terminal;
Not physical location – not a physical intervention. For example: an area covered by
research or a new information system.
6.2. How to draw an object
1 Click on the [Draw Proposal] button
2 Click on the type of Proposal you want to draw
CEF2 GIS DATA SUBMISSION - USER GUIDE Page 24 / 35
Document Version 9 dated 07/09/20213 Move the cursor over the map
4 Left click on the map where you want to add a point or a starting point of a line or polygon
5 Continue drawing by left clicking on the locations of the remaining nodes of your line or
polygon
6 Double click to finish drawing your line or polygon
6.3. How to draw an object "snapped" to other map objects
Using this functionality is strongly encouraged if the object you draw is connected to
another object, which you drew earlier (see the picture below)
CEF2 GIS DATA SUBMISSION - USER GUIDE Page 25 / 35
Document Version 9 dated 07/09/20211 Zoom to the area of your proposal to the scale bigger than 1/150 000 f.e. 1/100 000
4 Click on the [Draw Action] button
5 Click on the type of Action you want to draw
6 Move the cursor towards an existing map features which you have drawn before
7 Press and hold the [Alt] button. The red cross will appear on the existing line and will stay
on the line if you move the cursor in its vicinity.
8 Click on the spot where you want to add a point or a starting point of your line or polygon.
The point will be added where the cross is located. Release [Alt] button if you do not want
to "snap" to existing map objects.
9 Continue your drawing by clicking on the remaining nodes of your line or polygon
10 Double click to finish your drawing
6.4. How to add whole countries or NUTS regions
If you need to draw larger polygons like whole countries or NUTS regions, you don't need to
draw them by hand. Follow these steps to add them to the map:
1 Click on the [Draw Country/Region] button
2 [Draw NUTS regions] window will appear
3 Select country name and if needed names of lower level region(s)
4 Click on [Preview] to display and zoom onto the selected country/region
5 Click on [Add] to display the country/region on the map.
6 Repeat steps 3 - 5 to add other relevant regions
CEF2 GIS DATA SUBMISSION - USER GUIDE Page 26 / 35
Document Version 9 dated 07/09/20217 To remove a single region from the list click on the [x] symbol
8 To remove all regions from the list click on the [Reset List] button
9 Once you selected all the required regions, click on the [Add] button:
All the regions from the list will be added to the proposal.
Remark:
If the regions you are adding share a common border (e.g. two neighbouring countries)
they will be merged into a single polygon – this is an intended functionality.
6.5. How to upload your GIS data
If you already have GIS data for your proposal you can upload it and the map objects will be
created automatically. Be aware that the GIS data must have specific format to be loaded
correctly. The supported file formats are:
ESRI Shapefile (packed as a .ZIP file),
Comma separated CSV file,
GPS exchange format - GPX file,
KML file
The files should meet the requirements concerning the projection and structure.
Attention!
Shapefiles should be zipped (all files: .SHP, .SHX, .DBF, .PRJ, etc.) and submitted as a zip-file.
The Coordinate Reference System should be WGS 1984.
Comma separated files should have the following format (where X is longitude and Y is latitude):
CEF2 GIS DATA SUBMISSION - USER GUIDE Page 27 / 35
Document Version 9 dated 07/09/20211 Click on the [Upload File] button
2 Select the type of file which you want to upload
3 Click on the [Add file] button, select the file you want to upload and click [Open]
4 After loading you may receive warnings about automatic assignment of loaded objects e.g.:
6.6. Modify an object which you drew earlier (if needed)
6.6.1. How to modify the shape of the previously drawn object
1 Select an object by clicking on it
If you clicked on place where several objects overlap you will see the information about
number of objects and arrow buttons to change selection
CEF2 GIS DATA SUBMISSION - USER GUIDE Page 28 / 35
Document Version 9 dated 07/09/20212 Click on the [Edit Geometry] button
3 Click on the white and grey points, keep left mouse button pressed and move the cursor to
modify the shape
4 Double click anywhere on the map to save the changes
6.6.2. How to delete a point from a line or polygon
1 Select an object by clicking on it
2 Click on the [Edit Geometry] button
3 Click the right mouse button on the grey point you want to delete. The [Delete] button will
appear
4 Click on the [Delete] button. The selected point will be removed. Note that you cannot delete
CEF2 GIS DATA SUBMISSION - USER GUIDE Page 29 / 35
Document Version 9 dated 07/09/2021a point from a polygon that exists out of only 3 points and a line of 2 points 6.6.3. How to delete a whole object 1 Select an object by clicking on it 2 Click on the [Edit Geometry] button 3 Click on the [Delete] button from the menu. The selected map feature will be deleted 6.6.4. How to modify category of objects 1 Select an object by clicking on it 2 Click on the [Edit Geometry] button 3 Select a value from the dropdown list [PHYS LOCATION] 4 Click on the [Save] button. The attribute will be changed 6.7. Miscellaneous map operations 6.7.1. How to work with a list of all map features which you created 1 Click on the [List of Proposal Geometries] button. A new panel with a list of map features which you created will appear CEF2 GIS DATA SUBMISSION - USER GUIDE Page 30 / 35 Document Version 9 dated 07/09/2021
2 Use button(s) [Polygons], [Lines] or [Points] to display list of polygons, lines and points from
  your proposal
    Click on a single row in a table to select a single map feature.
    Once a row or rows are selected you can use:

    - Magnifier glass button        to zoom to selected map feature;

    - Delete button     to delete selected map feature(s).

    Use a button with a tick mark        to select all map features from a table.

    Use a button with a cross       to unselect all selected rows.
    REMARK:
    If a map feature has 0 area or 0 length it means that geometry has not been created for that
    feature. This is usually due to an error in importing data. Such rows can be deleted using
    the delete button.

6.7.2. How to get information on the position or dimensions of objects
1   Select an object by clicking on it
2   Click on the [Measure] button

CEF2 GIS DATA SUBMISSION - USER GUIDE                                                    Page 31 / 35
Document Version 9 dated 07/09/2021
3 The information about object area (for polygons), length (for lines) or coordinates (points)
will be displayed in a pop up window
4 Click on the [X] button to close the information window.
6.7.3. How to measure objects on map
Measure distances, areas or get point coordinates.
1 Click on the [Measure] button
2 Select the type of measurement
Area Length Coordinates
3 Select measurement units
4 Click on a map to draw a point, line or polygon. The result will be shown in the
measurement window
5 Click on the [x] icon to close the measurement window and remove measurement graphic
from the map
6.7.4. How to print a map of the proposal
Print a simple map with proposal features only (no other map layers can be shown on a printed
map)
1 Click on the [Print] button. Print preview page will open
2 Zoom and pan to the map extent which you want to print
CEF2 GIS DATA SUBMISSION - USER GUIDE Page 32 / 35
Document Version 9 dated 07/09/20213 Click on the [Print] button from the top of the print preview
4 Pan and zoom the map print preview if needed
5 Follow the steps for printing of the browser which you use
6.7.5. How to export your data
You can export your data to a downloadable GIS file.
1 Click on the [Export data] button
Click the [Create Shapefiles] button.
2 After the export is complete, a [Download Shapefiles] links will appear.
6.8. Examples for CEF Energy
Examples of actions and the tools, geometry types and categories you should use to draw them.
Proposal subject Tool Type of Physical
geometry location
Construction of a compressor [Draw Action] Point Yes
station
Analysis resulting in locations for [Draw Action] Point Yes
compressor stations.
Construction or upgrade of a section [Draw Action] Line Yes
of pipeline or transmission line.
Construction or upgrade of a [Draw Action] Draw the outline Polygon and point Yes
terminal of the area of upgraded or
newly constructed installations.
If there are several terminals
away from each other you can
add a point in the center of each
terminal so that it is visible in
smaller map scales too.
Implementing an information [Draw Action] Draw area or Polygon No
system in an area use [Draw NUTS] to create
larger areas (regions, countries)
Deployment of a software or [Draw Action] Draw a line Line No
electronic control equipment on a along the pipeline
section of pipeline
CEF2 GIS DATA SUBMISSION - USER GUIDE Page 33 / 35
Document Version 9 dated 07/09/20217. TROUBLESHOOTING
7.1. Application freezes
Sometimes problems with Internet connection or large number of requests sent to the server may
cause long reaction times. In such a situation, you may close and reopen the interactive map
window or even refresh browser window.
7.2. Cannot see basemap selection box – use scroll bars
The interactive map should display correctly on modern computer screens (wide screens). On
some, older screens some widgets from the interactive map may not be visible – use scrollbars on
the sides of the map window to show the needed widget (e.g. button menus or scale buttons).
7.3. Cannot add many countries in one go using NUTS tool
If you cannot add many countries in one go try adding it one by one.
7.4. Cannot select a line with a double-click
Sometimes the object you draw on the map can be difficult to select – attribute window doesn’t
show up after you click on the existing map object. Try panning map window or even reopening
the interactive map window.
7.5. Cannot see basemap: canvas in zoom 5000
Some of the basemaps are not available in large zooms. If you don't see a background map select
another one (e.g. satellite image) from the list of background maps.
7.6. Interactive map hasn’t loaded for a very long time
Server can be overloaded due to large number of concurrent users. Refresh browser window.
7.7. No dialog opens when you click on the [Core Network Corridors],
[Comprehensive Network], [Core Network] or [Electricity PCIs], [Gas
PCIs] or [Smart Grids PCIs] buttons.
The dialog may have opened outside the visible part of the screen. Use scrollbars to check.
7.8. After deleting/adding an object on map and changing the map scale the
object is visible/invisible.
In such situation map tiles have not been refreshed by the browser. Please clear your browser’s
cache.
CEF2 GIS DATA SUBMISSION - USER GUIDE Page 34 / 35
Document Version 9 dated 07/09/20217.9. After selecting a layer from table of contents (e.g. Core Network
Corridor, Electricity PCIs) it doesn't show up immediately on map.
Sometimes, especially in the beginning of your work re-establishing connections between
different data sources used by the application can take up to several minutes. Please wait until
data is displayed.
CEF2 GIS DATA SUBMISSION - USER GUIDE Page 35 / 35
Document Version 9 dated 07/09/2021You can also read