Indonesia Developers: Stronger Sales Won't Fix Everything - May 2021 Simon Wong Director, Southeast Asia Property, Consumer, Telecom, REITS
←
→
Page content transcription
If your browser does not render page correctly, please read the page content below

Simon Wong
                                 Director, Southeast Asia Property,
Indonesia Developers: Stronger   Consumer, Telecom, REITS

Sales Won’t Fix Everything       Fiona Chen
                                 Associate Director

                                 Christina Lim
May 2021                         Rating Analyst

                                             Copyright © 2021 by S&P Global.
                                                           All rights reserved.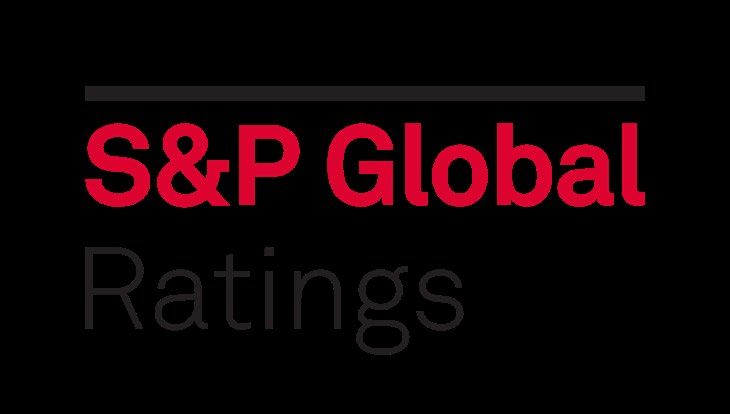
Key Takeaways

                Sales recovery backed by end-user demand and
                supportive regulatory measures

                Negative discretionary cash flows constrain liquidity
                improvement and deleveraging

                Credit quality unlikely will recover to pre-pandemic level
Sustained Sales Momentum Through 1Q2021
– Recovery since 2H2020 driven by pent-up demand and promotional activities
– Developers are shifting strategy to focus on affordable, landed residential projects to target end-users
– Demand for 2021 fueled by supportive regulatory measures

Sales Picked Up For Most Developers Since 2H2020
                       Alam Sutera                       Lippo*                           Jababeka                         Pakuwon
                       Bumi Serpong (Unrated)            Ciputra (Unrated)                Year-on-year change
           7,000                                                                                                                                          60
                                                                                                                                                          50
           6,000
                                                                                                                                                          40
           5,000
Bil. IDR

                                                                                                                                                          30
           4,000                                                                                                                                          20

                                                                                                                                                               %
           3,000                                                                                                                                          10
                                                                                                                                                          0
           2,000
                                                                                                                                                          (10)
           1,000
                                                                                                                                                          (20)
              0                                                                                                                                           (30)
                        1Q2020                       2Q2020                      3Q2020                       4Q2020                       1Q2021

*Lippo’s marketing sales represent sales generated at the holding company level. Bil.--Billion. IDR--Indonesian rupiah. Source: Company’s sales result.

                                                                                                                                                                 3
Rated Developers’ Sales Recovering Above 2019
Level
– Consolidated marketing sales to grow 24%-32% in 2021
– Varying sales performance depending on developers’ residential product offering and reliance on land
sales
Rated Developers’ Sales Forecast For 2021
Developer’s Our 2021 2021f 2020a
Marketing Sales, IDR billion 2021 target estimates vs 2020a 2020a vs 2019a 2019a
Alam Sutera 3,200 2,800-3,000 0% to 7% 2,794 -10% 3,112
Lippo Karawaci* 2,200 2,100-2,200 66% to 74% 1,263 143% 519
Jababeka 1,400 1,200-1,300 34% to 45% 898 -46% 1,663
Pakuwon 1,400 1,300-1,400 27% to 36% 1,026 -32% 1,503
Aggregate 8,200 7,400-7,900 24% to 32% 5,981 -12% 6,797
*Lippo’s marketing sales represent sales generated at the holding company level. Bil.--Billion. IDR--Indonesian rupiah. a--Actual. f—Forecast. Source: S&P’s estimate
and company’s sales result.
4Easing Regulatory Measures Support 2021 Sales
Supportive regulatory measures include:
– VAT reduction (March to August)
– Record low mortgage rate
– Accelerated mortgage disbursement to developers
– Reduced down-payment for mortgage loan (higher loan-to-value ratio)
Temporary VAT Reductions To Boost Sales Of Lippo And Pakuwon To Benefit The Most
Existing Inventory
Rated Value of ready-for-sale inventories priced below
Housing categories VAT reductions developers IDR5 billion
Below IDR2 billion per unit 100% Pakuwon Over IDR2 trillion
Between IDR2 billion-IDR5 billion per unit 50% Lippo Over IDR1.5 trillion
Alam Sutera Over IDR700 billion
Jababeka Not material
IDR--Indonesian rupiah. VAT--Value-added tax. Source: S&P Global Ratings’ Source: S&P Global Ratings’ estimates.
estimates.
5Higher Construction Costs Constrain Operating
Cash Flow Generation
Cash Flow From Operations Across Developers To Stay Muted Despite Higher Sales
2020a 2021e
2,000
1,500
1,000
500
Bil. IDR
0
(500)
(1,000)
(1,500)
(2,000)
(2,500)
(3,000)
Alam Sutera Lippo* Jababeka Pakuwon
Cash flow from operations include interests paid. * Lippo’s cash flow from operations exclude one-off Puri mall sale. Bil.--Billion. IDR--Indonesian rupiah. a--Actual. e--
Estimate. Source: S&P Global Ratings.
6Liquidity Remains Tight, Pressure Reduced From 2020
Discretionary Cash Flow To Stay Negative Across All Developers, Eroding Cash on Hand
Opening cash and cash equivalent 2021 discretionary cash flows
4,000
3,000
2,000
Bil. IDR
1,000
0
(1,000)
(2,000)
Alam Sutera Lippo* Jababeka§ Pakuwon
*Reflect Lippo's holding company performance. Lippo’s discretionary cash flow include one-off Puri mall sale, assuming net proceeds of IDR 1 trillion. §Jababeka's
cash balance excludes JV’s. Bil.--Billion. IDR--Indonesian rupiah. Source: S&P Global Ratings.
7Refinancing Risks Are Limited For Next 12-18
Months
Funding Environment Remains Selective And Challenging
Outstanding US$ bond maturities (mil. US$)
Alam Sutera Modernland* Jababeka Pakuwon§ Lippo
$251
$171
$47
$300
May ‘24 Nov. ‘25
$150* April ‘22
Oct. ‘23
$400
Aug. ‘21 $420
§
$417
Jan. ‘25 Apr ‘28
$240* Oct. ‘26
April ‘24
2021 2022 2023 2024 2025 2026 2027 2028
*Modernland is in the midst of discussion with bondholders on potential restructuring terms. §Pakuwon refinanced its 2024 note with US$400 million bond due in April
2028. Data as of May 17, 2021. Mil.--Million. Source: Bloomberg.
8Recovery Of Credit Ratios To Lag Behind Sales
– EBITDA in 2021 constrained by slow sales in 2020, construction delays, and change in accounting
standard
– Leverage to remain high across most developers while interest servicing remains thin
Alam Sutera’s Credit Ratios Jababeka’s Credit Ratios
Debt/EBITDA (left scale) Debt/EBITDA (left scale)
EBITDA interest coverage (right scale) EBITDA interest coverage (right scale)
35 10 35 10
9 9
30 30
8 8
25 7 25 7
6 6
Times
Times
Times
Times
20 20
5 5
15 15
4 4
10 3 10 3
2 2
5 5
1 1
0 0 0 0
2019a 2020a 2021f 2019a 2020a 2021f
a--Actual. f--Forecast. Source: S&P Global Ratings. a--Actual. f--Forecast. Source: S&P Global Ratings.
9Recovery Of Credit Ratios To Lag Behind Sales
(Cont’d)
Pakuwon’s Credit Ratios
Debt/EBITDA (left scale)
EBITDA interest coverage (right scale)
35 10
9
30
8
25 7
Times
Times
6
20
5
15
4
10 3
2
5
1
0 0
2019a 2020a 2021f
a--Actual. f--Forecast. Source: S&P Global Ratings.
10Rating Volatility Has Declined From A Year Ago
– Ratings have stabilized for ‘B’ rated developers
– Modernland’s debt restructuring ongoing
Rating History of Indonesia Property Developers
Alam Sutera Lippo Jababeka Modernland Pakuwon
BB
BB-
B+
B
B-
CCC+
CCC
CCC-
CC
C
SD
D
Source: S&P Global Ratings.
11PT Alam Sutera Realty Tbk. (CCC/Negative/--)
Key Rating Drivers Key S&P Assumptions
– Previously launched an exchange offer to address 2021 (IDR billion)
2021 and 2022 notes, which we viewed as a Marketing & land sales 2,800 to 3,000
distressed exchange (2020: 2,800)
– Continued weak liquidity over the next 12-18 months
Discretionary cash flow Negative 300 to
– Negative discretionary cash flow will reduce cash negative 400
available for debt repayment Cash and cash equiv. 625 (end Dec 2020)
Key Monitoring Events Downside Scenario
– Resolution of the outstanding US$47 million 2022 – If company does not fully address the maturities of
notes the residual 2022 notes by third quarter of 2021.
– If company undertakes capital market transactions
related to its 2022 notes that we assess as
constituting a distressed exchange, such as capital
market purchases below par.
Rating as of May. 17, 2021. IDR--Indonesian rupiah. Source: S&P Global Ratings.
12PT Lippo Karawaci Tbk. (B-/Stable/--)
Key Rating Drivers Key S&P Assumptions
– Cash burn to substantially ease in 2021 Holdco level 2021 (IDR billion)
– Improving sales visibility Marketing & land sales 2,100 to 2,200
(2020: 1,260)
– Reduced rental support to First REIT and
LMIRT Discretionary cash flow Negative 500 to
– Increase in dividends backed by higher stake negative 600
in LMIRT and distribution from Siloam Puri Mall sales proceed 1 trillion
– Lower construction costs from 2022 as legacy Cash on hand ~2,400 (end Dec 2020)
high-rise projects to complete by 2Q 2021
– No major debt maturity before 2025
Key Monitoring Events Downside Scenario
– Progress of marketing sales and take-up of new – Unsustainable cash flow that requires continued
launches for the rest of the year asset sales to sustain cash balance
– Execution of further non-core asset sales – Inadequate liquidity cushion to service more than a
year of fixed interest and rental charges
– Cash on hand (Hold Co.) plus annual operating
cash flow below IDR2 trillion
Rating as of May. 17, 2021. IDR--Indonesian rupiah. Source: S&P Global Ratings.
13PT Kawasan Industri Jababeka Tbk.
(B-/Stable/--)
Key Rating Drivers Key S&P Assumptions
– COVID-19 reduced land sales visibility 2021 (IDR billion)
– Thin interest servicing capability and negative free Marketing & land sales 1,200 to 1,300
operating cash flow (2020: 899)
– Recurring EBITDA covers 60%-70% annual Discretionary cash flow Negative 100 to
interest obligation negative 200
– Limited liquidity headroom at the consolidated
Cash and cash equiv. 680§ (end Dec 2020)
(excluding joint ventures) level
Key Monitoring Events Downside Scenario
– Pace of resumption in land sales to domestic and – Cash balance insufficient to cover annual interest
international buyers costs
– Outcome of next AGM – Liquidity sources decline materially below 1.0X of
uses
– Ongoing lawsuit and shareholder tussle affects
company’s liquidity or repayment schedule
* Marketing sales include that of Joint Ventures. §Cash balance at wholly owned consolidated level, excluding JVs. Rating as of May. 17, 2021. IDR--Indonesian
rupiah. Source: S&P Global Ratings.
14PT Pakuwon Jati Tbk. (BB/Stable/--)
Key Rating Drivers Key Assumptions
– Adequate financial and liquidity buffer to ride out the 2021 (IDR billion)
pandemic Marketing & land sales 1,300 to 1,400
– No refinancing risks for the next five years (2020: 1,026)
– High recurring EBITDA-to-interest ratio of over 3x Discretionary cash flow Negative 300 to
provides downside resilience negative 500
– Established brand in Jakarta and Surabaya but Cash and cash equiv. 2,886 (end Dec 2020)
limited scale constrains rating
– Risks in geographical and sector concentration
Key Monitoring Events Downside Scenario
– Recovery of marketing sales – Debt-to-EBITDA ratio consistently above 2.5x
– Retail mall traffic footfall and potential rental waivers – Departs from its cautious financial policies, resulting
from a steep rise in capital spending or sizable land
– Potential acquisitions
acquisitions
– Credit profile of Pakuwon’s parent company
deteriorates due to rising debt
Rating as of May. 17, 2021. IDR--Indonesian rupiah. Source: S&P Global Ratings.
15PT Modernland Realty Tbk. (D)
What Happened Key Monitoring Events
– Inability to convert land sales receivables to cash – Company in discussion with bondholders on
restructuring terms such as security coverage, for
– Weak marketing sales in 1H 2020
both US$ notes
– Depleted cash balance by June 2020
– Possible extension of moratorium beyond May
– Failed to repay domestic notes of IDR150 billion,
matured on July 7, 2020
– Failed to pay US$8 million coupon due on Aug. 30,
2020
– Failed to pay US$8.3 million due on Oct. 13, 2020
– Applied and extended the moratorium on the 2021
and 2024 notes
Rating as of May. 17, 2021. ICR--issuer credit rating. IDR--Indonesian rupiah. Source: S&P Global Ratings.
16Appendix – Indonesia Property Sector Indicators
Multi-Year Low Mortgage Rate To Stimulate Property Price Index Remains Stable In Key
Property Purchase Cities
Mortgage rate Indonesia residential property price index (quarterly)
Semarang Surbaya Jakarta
9.4 9.34 400
9.2 9.12 350
9.0 300
8.92
Property price index
8.85
250
8.8
%
8.63 200
8.6
8.55 150
8.4
100
8.2 50
8.0 0
Q1--First quarter. Q2--Second quarter. Q3--Third quarter. Q4--Fourth quarter. Q1--First quarter. Q2--Second quarter. Q3--Third quarter. Q4--Fourth quarter.
Source: Bank of Indonesia: Residential property survey. Source: Bank of Indonesia: Residential property survey.
17Copyright © 2021 by Standard & Poor’s Financial Services LLC. All rights reserved.
No content (including ratings, credit-related analyses and data, valuations, model, software or other application or output therefrom) or any part thereof (Content) may be modified, reverse
engineered, reproduced or distributed in any form by any means, or stored in a database or retrieval system, without the prior written permission of Standard & Poor's Financial Services
LLC or its affiliates (collectively, S&P). The Content shall not be used for any unlawful or unauthorized purposes. S&P and any third-party providers, as well as their directors, officers,
shareholders, employees or agents (collectively S&P Parties) do not guarantee the accuracy, completeness, timeliness or availability of the Content. S&P Parties are not responsible for
any errors or omissions (negligent or otherwise), regardless of the cause, for the results obtained from the use of the Content, or for the security or maintenance of any data input by the
user. The Content is provided on an "as is" basis. S&P PARTIES DISCLAIM ANY AND ALL EXPRESS OR IMPLIED WARRANTIES, INCLUDING, BUT NOT LIMITED TO, ANY
WARRANTIES OF MERCHANTABILITY OR FITNESS FOR A PARTICULAR PURPOSE OR USE, FREEDOM FROM BUGS, SOFTWARE ERRORS OR DEFECTS, THAT THE
CONTENT'S FUNCTIONING WILL BE UNINTERRUPTED, OR THAT THE CONTENT WILL OPERATE WITH ANY SOFTWARE OR HARDWARE CONFIGURATION. In no event shall
S&P Parties be liable to any party for any direct, indirect, incidental, exemplary, compensatory, punitive, special or consequential damages, costs, expenses, legal fees, or losses
(including, without limitation, lost income or lost profits and opportunity costs or losses caused by negligence) in connection with any use of the Content even if advised of the possibility of
such damages.
Credit-related and other analyses, including ratings, and statements in the Content are statements of opinion as of the date they are expressed and not statements of fact. S&P's opinions,
analyses, and rating acknowledgment decisions (described below) are not recommendations to purchase, hold, or sell any securities or to make any investment decisions, and do not
address the suitability of any security. S&P assumes no obligation to update the Content following publication in any form or format. The Content should not be relied on and is not a
substitute for the skill, judgment and experience of the user, its management, employees, advisors and/or clients when making investment and other business decisions. S&P does not act
as a fiduciary or an investment advisor except where registered as such. While S&P has obtained information from sources it believes to be reliable, S&P does not perform an audit and
undertakes no duty of due diligence or independent verification of any information it receives. Rating-related publications may be published for a variety of reasons that are not necessarily
dependent on action by rating committees, including, but not limited to, the publication of a periodic update on a credit rating and related analyses.
To the extent that regulatory authorities allow a rating agency to acknowledge in one jurisdiction a rating issued in another jurisdiction for certain regulatory purposes, S&P reserves the
right to assign, withdraw, or suspend such acknowledgement at any time and in its sole discretion. S&P Parties disclaim any duty whatsoever arising out of the assignment, withdrawal, or
suspension of an acknowledgment as well as any liability for any damage alleged to have been suffered on account thereof.
S&P keeps certain activities of its business units separate from each other in order to preserve the independence and objectivity of their respective activities. As a result, certain business
units of S&P may have information that is not available to other S&P business units. S&P has established policies and procedures to maintain the confidentiality of certain nonpublic
information received in connection with each analytical process.
S&P may receive compensation for its ratings and certain analyses, normally from issuers or underwriters of securities or from obligors. S&P reserves the right to disseminate its opinions
and analyses. S&P's public ratings and analyses are made available on its Web sites, www.standardandpoors.com (free of charge), and www.spcapitaliq.com (subscription) and may be
distributed through other means, including via S&P publications and third-party redistributors. Additional information about our ratings fees is available at
www.standardandpoors.com/usratingsfees.
Australia: S&P Global Ratings Australia Pty Ltd holds Australian financial services license number 337565 under the CorporationsAct 2001. S&P Global Ratings' credit ratings and related
research are not intended for and must not be distributed to any person in Australia other than a wholesale client (as defined in Chapter 7 of the Corporations Act).
STANDARD & POOR'S, S&P and RATINGSDIRECT are registered trademarks of Standard & Poor's Financial Services LLC.
spglobal.com/ratings
18You can also read