TV & Video consumption in the new normal - What audiences say and do - and how we respond - Amazon S3

Page created by Wade Cummings
 
CONTINUE READING
TV & Video consumption in the new normal - What audiences say and do - and how we respond - Amazon S3
TV & Video
consumption in
the new normal

What audiences say and do –
and how we respond

Wednesday 22nd April
TV & Video consumption in the new normal - What audiences say and do - and how we respond - Amazon S3
TV & Video consumption in the new normal

         What audiences say

         What audiences do

         How we respond

                                           2
TV & Video consumption in the new normal - What audiences say and do - and how we respond - Amazon S3
What
audiences
say
Jane Ostler
Global Head of Media, Insights Division
Kantar

Wednesday 22nd April
TV & Video consumption in the new normal - What audiences say and do - and how we respond - Amazon S3
Overall media consumption is increasing significantly in lockdown, with
 online media channels and TV providing new opportunities to reach audiences
                                                                     Total                                                    Some restrictions                                        Severe restrictions
                                                                                                    48                                                            48                                                           60
                      Internet surfing                                                         42                                                          41                                                         48
                                                                                                    46                                                      43                                                            51
                                   TV                                                      40                                                         37                                                             46
                                                                                                           56                                                         52                                                  51
                    Instant Messaging                                                               47                                                     41                                                   40
                                                                                                45                                                          44                                                        48
                       Social networks                                                    38                                                         36                                                         40
                                                                                                    46                                                     40                                                        46
                             Websites                                                     37                                                     32                                                         39
                                                                                           40                                                          39                                                        44
                        Online Videos                                                33                                                          33                                                        36

                               e-mail                                                                48                                                         46                                              41
                                                                                               43                                                      38                                              34

             TV on Demand/Streaming                                                       39                                                          37                                                        40
                                                                                     32                                                         29                                                    32

Listening to podcasts /streaming music                               12                                                        12                                                                22
                                                                       14                                                        15                                                         18

                                Radio                                   15                                                         16                                                 13
                                                                         17                                                         17                                                 15

               Online/Streaming radio                                           24                                                         24                                         12
                                                                              21                                                      19                                               13
                          Newspapers                           3                                                          5                                                     3
                                                                   10                                                         10                                                     11
                           Magazines                      -3                                                     -1                                                        -5
                                                               3                                                          4                                                     3
                              Cinema     -33                                                         -29                                             -35
                                               -24                                                         -21                                                  -25

                                                     Wave 1        Q10. In general, how has the coronavirus situation impacted your use of media? With reference to the last month, are you using the following
                                                                                                                                                                                                                                    4
                                                     Wave 2        media more or less compared to last month – net +ve/-ve scores. Kantar COVID-19 Barometer, Waves 1/2
TV & Video consumption in the new normal - What audiences say and do - and how we respond - Amazon S3
Online viewing changes are more pronounced among the younger audiences
across most media channels as markets enter severe restrictions

80
            66
                 63                                              62                                      60
60                                          56 58 54                                 55
                                   53 51                                                                                     51                  51
                                                                      50                  49
       48             46   46 48                            45                  46                            47        48
                                                       40                                           40                            40        39        40
40                                                                                                                                                                   37
                                                                                                                                       32
                                                                           28                  28                                                                         29
                                                                                                                                                           25                                       24
                                                                                                                   22
 20                                                                                                                                                                                15       16 17        16
                                                                                                                                                                12                                            13
                                                                                                                                                                               6        7
                                                                                                                                                                                                                   4   3 1 2 5    Magazine          Cinema
 0
      Internet               TV             Instant          Social             Websites              Online             E-mail                TV on              Listening             Radio         Online.           Newspapers -3
       surfing                             messaging        networks                                  videos                                Demand/                   to                             Streaming                          -5 -5 -5
                                                                                                                                            Streaming            podcasts/                              radio
-20                                                                                                                                                              streaming
                                                                                                                                                                    music
                                                                                                                                                                                                                                                     -29
                                                                                                                                                                                                                                                   -33
-40                                                                                                                                                                                                                                                    -37-38

-60

                                                                Total
                                                                Aged 18-34                     Q10. In general, how has the coronavirus situation impacted your use of media? With reference to the last month, are you using
                                                                Aged 35-54                     the following media more or less compared to last month – net +ve/-ve scores(Wave 2 Data, Severe Restrictions markets)
                                                                                                                                                                                                                                                                5
                                                                Aged 55+
TV & Video consumption in the new normal - What audiences say and do - and how we respond - Amazon S3
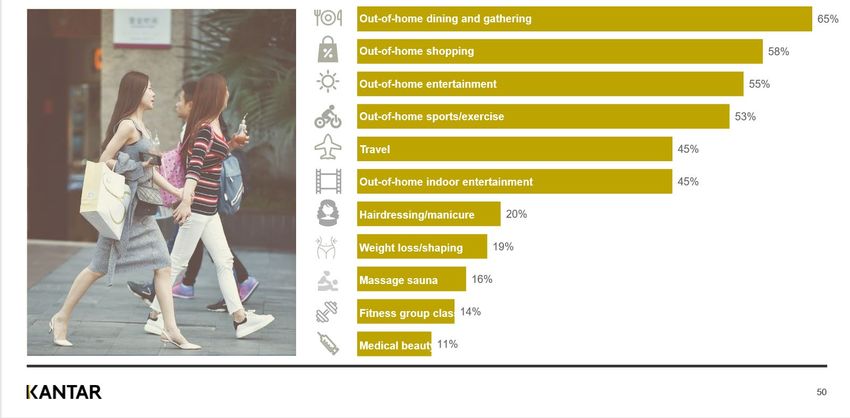
Improving understanding of heavier online viewers during the crisis
Gaining richer profiling insights from TGI

  Target Group
  Def. Agree: In the past few weeks, I’m watching more online video
                                                                        44%                                    136                          157                             116

                                                                                                  TGI INDEX
  and TV on demand (e.g. YouTube, iPlayer, Netflix)
  = 20% of All Adults 18+
                                                                      have children in                        Playschool               Primary School             Secondary School
                                                                        household                               Parents                    Parents                    Parents

                                                                         Agree: “I find it difficult to                             Def Agree: “Advertising helps me
                                                                      balance work, children and social                                   choose what I buy”
                                                                                     life”
                                                                                                                                                        Index: 245
                                                                                     Index: 158

                                                                         Def. Agree “I prefer to buy                                  Def Agree: “When I see a new
                                                                       products from companies who                                   brand I often buy it to see what
                                                                         sponsor TV programmes”                                                  it's like”
                                                                                     Index: 267                                                         Index: 230

                                                                           Source: TGI GB Q2 2020 | April Recontact of TGI Jan-Dec 2019 respondents | Base: All Adults GB            6
TV & Video consumption in the new normal - What audiences say and do - and how we respond - Amazon S3
What
audiences
do
Andy Brown
Global CEO & Chairman, Media Division
Kantar

Wednesday 22nd April
TV & Video consumption in the new normal - What audiences say and do - and how we respond - Amazon S3
KEY
 Snapshot: TV viewing uplifts across the world                                             COUNTRY
                                                                                       % Increase vs. 2019
 Our measurement fuels $86 billion of advertising spend decisions worldwide.           (WEEK #, # mins in 2020)

                                                                                     NORWAY
     UK
                                                                                      +35%
    +29%                                                                           (W14, 153 mins)
(W13, 226 mins)

                                                                                      TURKEY
   SPAIN
                                                                                       +28%
   +47%                                                                            (W13, 365 mins)
(W12, 365 mins)

                                                                                       CHINA
   PERU
                                                                                        +41%
   +55%                                                                             (W5, 190 mins)
(W12, 271 mins)

  BRAZIL                                                                         PHILIPPINES
   +25%                                                                             +15%
(W14, 297 mins)                                                                   (W12, 251 mins)

                                                                               Average Minutes Viewed per Day
                                                                                                                  8
TV & Video consumption in the new normal - What audiences say and do - and how we respond - Amazon S3
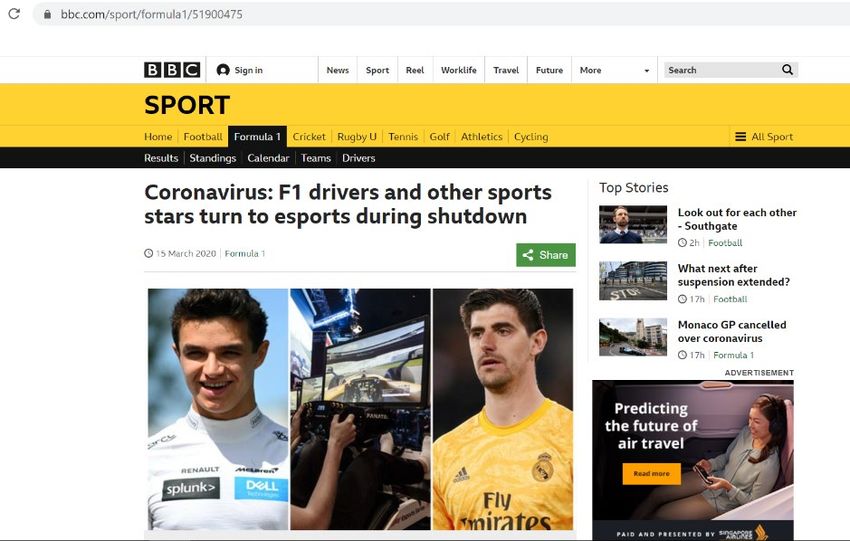
TV viewing levels soar as stay-at-home measures take hold
                                                                                                                                                                           2020
                                                                                                                                                                           2019

                                                                                                                  UK
                                               SPAIN
                                                                     250
        400

        350
                                                                     200
        300

        250
                                                                                          20th Mar – school
                                                                     150                closures across UK
        200       14th Mar – start of nationwide
                            lockdown measures
        150
                                                                     100
        100                                                                 1st Mar                                                                  11th Apr
              22nd Feb                                    4th Apr

                                             BRAZIL                                                       CHINA*
        400                                                         250

        350
                                                                    200                                                                                         … more to follow
        300
                                                                    150
        250
                                                                    100
        200       20th Mar – epidemic                                                        24th Jan –start of
                    declared in Brazil;                                                  nationwide lockdown
        150        partial lockdown in                               50               measures and extended
                                 place                                                 lunar new year holiday
        100                                                          0
              1st Mar                                  11th Apr            1st Jan                                                                  14th Feb

                                                                                                                            Average Minutes Viewed per Day (All Individuals 4+)
                                                                                                                                         *Data Provided by Kantar’s Partners CSM
                                                                      All viewing data based on whole day viewing on a TV set – All Individuals 4+ (Average Daily Minutes Viewed)
                                                                                                                                                                                    9
TV & Video consumption in the new normal - What audiences say and do - and how we respond - Amazon S3
Harnessing the strength
of news and information
COVID-19: A moment in UK television history

                                              Biggest UK live TV events, 1981-2020

                                                            Funeral of Diana, Princess of Wales
                                                            6 September 1997                    32.1 million

                                                            Prince Charles & Lady Diana Wedding
                                                            29 July 1981                 28.4 million

    28 million                                              COVID-19 Prime Ministers Statement
                                                            23 March 2020              28.2 million
    (overnights)

                                                            Summer Olympics Opening ceremony
    28.2 million                                            27 July 2012          24.5 million
    (consolidated)

 The Prime Minister’s Statement on COVID-19
                                                            Summer Olympics Closing ceremony
 23 March 2020,20.30-20.35                                  12 August 2012         24.2 million
 BBC1, ITV, CH 4, Ch 5, Sky News, BBC News

                                                             Source: BARB / TechEdge TV screen data based on timeslot 2030-2035. Ind 4+.
                                                                                                                                    11
COVID-19: A moment in UK television history

          COVID-19
          5 April 2020                                24.3 million           +256k additional audience on PCs, tablets and smartphones

          Death of the Queen Mother
          8 April 2002       10.8 million

          Diamond Jubilee
          5 June 2012     9.8 million

                             Source: BARB / TechEdge. Consolidated Live+ 7 Days. Covid 19 Address: BBC1, ITV, CH 4, Ch 5, Sky News, Sky 1, BBC News 20:00-20:04
                                                                                                                                                           12
Audiences thirst for TV news rises as part of COVID-19 routines

                                                                                          6PM
                                                                                          News
                                                                                                                                       Same period last year
        40                                                                      +28%
TVR %

                                                                                                                                       Last 3 weeks
        35                                               Government
                                                             Briefing

        30                                                               +36%

        25
                                      1PM
                                     News
        20
                                               +58%
        15

        10

         5

        0
             06:00   08:00   10:00     12:00          14:00      16:00      18:00            20:00         22:00         00:00          02:00          04:00

                                                                                Source: BARB / TechEdge Live + VOSDAL. 23rd March – 13th April 2020 vs same period last year
                                                                                                                                                                        13
TV viewing rises as COVID-19 breaks audience records for news channels

               In China*, news viewing has almost doubled so far in                                   In Argentina**, news viewing has increased 55%
               2020 (1,413 mins vs. 727 mins in 2019)                                                 since w/c 12th March (1,439 mins vs. 927 mins in 2019)

180                                                                                  450

160                                                                                  400

140                                                                                  350

120                                                                                  300

100                                                                                  250

80                                                                                   200

60                                                                                   150

40
                                                                                     100

 20
                                                                                      50

 0
      Week 1 Week Week Week Week Week Week Week Week Week Week Week Week Week Week    0
              2    3    4    5    6    7    8    9    10   11   12   13   14   15          *Week Week Week Week Week Week Week Week Week Week Week Week Week Week Week
                                                                                             1    2    3    4    5    6    7    8    9    10   11   12   13   14   15

                                                       2020                                     *Data Provided by Kantar’s Partners CSM; Total Weekly Minutes of all News Programming
                                                                                                                                                                                        14
                                                       2019                                    **Data Provided by Kantar IBOPE Media; Total Weekly Minutes across seven news channels
TV programmes are amongst the most trusted channels for news and information
DIMENSION 2020 – The trust gap

                    37
Trust gap                    32                31
                    25
                             22                                  26                                                                     Trust gap for TV programmes
                                               17                                  17
                                                                 11
Trust                                                                                                                                                            +26

                                                                                                                                                                 +35
Don’t Trust         12       10                14                15                33

                                                                                  -16                                                                            -2
    Newspapers

    TV programmes        Company
                         websites
    Radio                Social
    programmes           media

                                  Calculated taking the ‘Don’t Trust’ score away from the ‘Trust’ score in response to the question “To what extent do you trust each of the following media for news and information sharing?”
                                                                                                                                                                                                                           15
                                                                                                                                                        Base: Connected consumers 8,000 (all markets), 1,000 in each marketa
                                                                                                                                                                                         Source: Kantar DIMENSION study 2020
Who’s watching what,
where and when?
Households are watching TV together more
Rise in co-viewing (% of total TV audience)

              Spain                                     Russia                                        Turkey

     52%                   60%                 26%               30%                   74%                             79%

  Pre- lockdown           Lockdown           Pre lockdown       Lockdown            Pre lockdown                  Lockdown
(10 Feb – 8 March)   (16 March – 14 April)   (2–13 March)   (30 March-10 April)   (24 Feb – 8 March)         (16 March – 12 April)

                                                                                                     Spain: Kantar TAM panel, Individuals 4+
                                                                                          Russia: Mediascope TV Index, Russia, Individuals 4+
                                                                                                                                           17
                                                                                                  Turkey: TIAK Live + VOSDAL. Individuals 5+.
TV viewing is changing as Spanish children & young adults adjust to
their new stay-at-home and remote working environment.
                                      4-12 years old                                                  18-30 years old
1,600                                                            2,500

                                                                                 Lunchtime and
1,400                                                                            evening bulletins
                Children getting up                                              seeing biggest rise as
                                                                 2,000
                later and watching                                               many 18-30s work
1,200                                                                            from home
                more television
                throughout the day
1,000
                                                                 1,500

 800

                                                                 1,000
 600

 400
                                                                  500

 200

   0                                                                 0
        02.00                                          26.00             02.00                                                                   26.00

                                                                                                                            Average Audience (000s)
                                                         Lockdown Viewing (After 16th Mar)                                4-12 years: 1.226 individuals
                                                                                                                                                          18
                                                         Pre-Lockdown (10 Feb – 8 Mar)                                  18-30 years: 1.838 individuals
Changes in viewing behaviour across the day by men & women
                                   % Change in TVR (Last 3 Weeks vs. Same Period Last Year)

                                                                                                                                                            +177%
       Larger increase
                                                                  Men       Women
70%       among men
        watching late
       morning shows
60%

                                                                                                                                                            Male audience of ITV’s “This
50%
                                                                                                                                                            Morning” has increased by huge
                                                                                                                                                            factor – now representing 29% of
40%
                                                                                                                                                            all viewers, up from 19%
                                                                                        Smaller increases
                                                                                      among both genders                More men staying
30%                                                                                      for ‘prime time’                   up late-night

                                                                                                                                                                         19%
20%                                                                                                                                                                                                     29%
                                                                                                                                                                    2019                       Last 3
                                                                                                                                                                   (Same                        Wks
10%                                                                                                                                                                Period)
                                                                                                                                                                                         71%
                                                                                                                                                                81%
 0%

-10%
                         Getting
                         up later…
-20%
       06:00 07:00 08:00 09:00 10:00 11:00 12:00 13:00 14:00 15:00 16:00 17:00 18:00 19:00 20:00 21:00 22:00 23:00 00:00 01:00 02:00 03:00 04:00 05:00

                                                                                                                 Source: BARB / TechEdge Live + VOSDAL. 23rd March – 12th April 2020 vs same period last year.
                                                                                                                                                                                     Men 16+ and Women 19 16+
Changes in viewing behaviour across the day by men & women
                                    % Change in TVR (Last 3 Weeks vs. Same Period Last Year)

                                                                                                                                                                      +180%
                                                             Male 18+         Female 18+
 110

              Larger increase among
              men watching day time
 90                              TV
                                                                                                                                                                      Male audience of ATV’s afternoon
                                                                                                                             Similar increase
                                                                                                                                among both                            talk show ESRA EROL'DA has
                                                                                                                           genders in staying                         increased by huge factor – now
 70                                                                                                                            up late-night
                                                                                                                                                                      representing 42% of all viewers, up
                                                                                             Smaller increases                                                        from 37%
                                                                                           among both genders
 50                                                                                           for ‘prime time’

                                                                                                                                                                                         37%
                                                                                                                                                                               2019                             Last 3    42%
                                                                                                                                                                              (Same                              Wks
 30                                                                                                                                                                           Period)                  58%
                                                                                                                                                                       63%

       Getting
       up later…
 10

 -10
        06:00 07:00 08:00 09:00 10:00 11:00 12:00 13:00 14:00 15:00 16:00 17:00 18:00 19:00 20:00 21:00 22:00 23:00 00:00 01:00 02:00 03:00 04:00 05:00

                                                                                                                     Source: TIAK Live + VOSDAL. 23rd March – 12th April 2020 vs same period last year. Men 18+ and Women 18+
                                                                                                                                                                                                                            20
TV & Video viewing out of home during the holiday period falls as the
impact of stay at home measures take hold

   2020
   (4-13                                   148.9                                                                             16.7                10% OOH
   April)

   2019
   (13-22                           83.6                         31.4                                                                            27% OOH
   April)

            In home   Out of home

                                                   Out of home incorporates all viewing outside the main home: second homes, other private homes, public places, workplaces etc.
                                                                                                                          Daily viewing minutes In Home - All individuals 2-79y
                                                                                                                                                                             21
                                                                                                                                                   Source: Kantar TVOV Norway
Norwegian audiences are using all screens to consume more content
Average daily time spent (TV & Video)

                                                             113.8
                TV                                                                              +30%
                                                                                        148.3

                      2.3
           PC / Mac
                                                                                                +83%
                        4.2

                      1.3
             Tablet                                                                             +77%
                      2.3

                      1.2
         Smartphone                                                                             +75%
                      2.1

                      2019    2020

                                            Increase in daily viewing minutes week 12-15 2020 vs week 12-15 2019
                                            - All individuals 2-79 years                                      22
                                            Source: Kantar TVOV Norway
All content platforms enjoy an uplift as Norwegians
embrace the ‘new normal’

                                                           107.2
     Linear TV                                                                                               +25%
                                                                                          134.1

                      11.5
        BVOD                                                                                                 +99%
                                 22.9

                    9.6
       Netflix                                                                                               +68%
                          16.1

                          15.0
     YouTube                                                                                                 +105%
                                        30.7

                 2019 weeks 12-15       2020 weeks 12-15

                                                             Increase in daily viewing minutes week 12-15 2020 vs week 12-15 2019
                                                                                                                                23
                                                                                                         All individuals 2-79 years
                                                                                                    Source: Kantar TVOV Norway
Norwegian households with a Netflix subscription increase their
viewing on YouTube & broadcaster players more than Netflix
Average daily viewing minutes for households with a Netflix subscription

                                                                      75.8
       Linear TV                                                                                           +18%
                                                                                            89.3

                                13.3
          BVOD                                                                                              +81%
                                                24.1

                                 14.2
         Netflix
                                              21.9                                                          +54%

                                       17.8
       YouTube
                                                          38.1                                             +114%
                   2019 weeks 12-15    2020 weeks 12-15

                                                                                  Increase in daily viewing minutes week 12-15 2020 vs week 12-15 2019
                                                                                                                                                    24
                                                                      All individuals 2-79 years / Netflix households make up 62% of the total universe
                                                                                                                         Source: Kantar TVOV Norway
Repeats are helping Brazilians to get their football fix

Suspension of Brazilian soccer championship has
seen an 87% decrease in soccer viewing…
                                                                                          … but a repeat broadcast of Brazil’s victorious
                              People Reached Weekly                                       FIFA World Cup win from 2002, reached

                                                                                           40% of households
                 44.5           (Soccer Matches)
  40.8

                                                                                          in the country, equivalent viewing levels of a
                                                                                          live local soccer game.
                                  25.0

                                                6.7            7.3
                                                                              5.2

01/03/2020 -   08/03/2020 -   15/03/2020 -   22/03/2020 -   29/03/2020 -   05/04/2020 -
07/03/2020     14/03/2020     21/03/2020     28/03/2020     04/04/2020     11/04/2020

                                                                                                                        Globo / All individuals 4+ / metropolitan areas
                                                                                                                                                                    25
                                                                                                                                           Source: Kantar IBOPE Media
Swedish radio habits have shifted as listeners transition to                                                                                                   2020

staying at home and working remotely.                                                                                                                          2019

       In-home radio listening increases                            Out of home radio listening falls as
                                                                                                                                              Overall radio listening has
      as government implements stay at                               car usage falls during the stay at
                                                                                                                                                  increased (mins)
               home measures                                   70
                                                                             home measures
 70
                                                                                                                                 110

 65                                                            65                                                                100

                                                                                                                                 90
 60                                                            60

                                                                                                                                 80
 55                                                            55

                                                                                                                                 70
 50                                                            50
                                                                                                                                 60

 45                                                            45
                                                                                                                                 50

 40                                                            40
      Week Week Week Week Week Week Week Week Week Week Week                                                                     40
                                                                    Week Week 5 Week Week 7 Week Week Week Week Week Week Week
       4    5    6    7    8    9    10   11   12   13   14          4           6           8    9    10   11   12   13   14          Week Week Week Week Week Week Week Week Week Week Week
                                                                                                                                        4    5    6    7    8    9    10   11   12   13   14

                                                                                                                                                                      Average listening (minutes)
                                                                                                                                                                                   1500 panellists.
                                                                                                                                                                      Source: Swedish RAM panel 26
TV Viewing in China has started to stabilise
Are we heading “back to normal”?
                                                                                                  2020
                                                                                                  2019

     250

     200

     150

     100
                            24th Jan –start of
                        nationwide lockdown
                     measures and extended
                      lunar new year holiday
      50

      0

           1st Jan                                                                                19th Apr

                                                                        Daily Average Mins, A4+
                                                 Data source and copyright: CSM Media Research               27
What have we
learnt?
How do we
respond?

Implications &
Considerations
China: rebound potential for most sectors

                                            29
China: looking forward to ‘returning’ to the new normal

                                                          Kantar COVID-19 Barometer
                                                                                 30
And while

only 8%
…of consumers believe
that companies should
stop advertising, we
know budgets are
under increasing
pressure.

                        Kantar COVID-19 Barometer
                                               31
But advertising should be useful, positive and consistent with your values -
don’t just drive your usual messages

Advertising…
                                             78%                       75%                      72%                      65%         50%           67%
Most importantly,
people don’t want       Should               Show how                  Inform                   Use a                    Should      Should talk   Should offer
brands to exploit the                        they can be               about their              reassuring               communica   about         a positive
situation                                    helpful in                efforts to               tone                     te brand    brands like   perspective
                                             the new                   face the                                          values      they have
Our numbers suggest                          everyday life             situation                                                     always
that people do want                                                                                                                  done
acknowledgement
that things are
different right now,
                        Should not
                                             74%
even if advertising                          exploit
does not need to                             coronavirus
overtly address the                          to promote
                                             a brand
crisis.

                              Q12. And in this situation, how should brands advertise? Advertisements today … - top2 (wave 2 data)                            32
What happens to brand health measures if you stop advertising on TV?
Net effects on brand measures 6 months after stopping TV advertising

                             TBCA         Total            Buy           Buy most         First            Key         Total brand    Trial
                                         Mentions        nowadays          often         mention          image        awareness

                                                                                                                                       -3
                                                                                                                             -5
                                                                                                             -8
               Net change*

                                                                                             -9
                                                                              -11
                                                             -13

                                             -21

                             -39

    BASE: No of. brands      (632)          (836)           (376)           (501)          (627)           (232)          (840)      (744)

                                     *Net Change: Percent of brands increasing – percent of brands decreasing – 2018 Kantar data              33
What happens if you decrease your adspend?
Simulation for a real beer brand to March 2021

                        Kantar simulations, March 2020   34
What does this mean for media plans?
Cinema advertising:
•   Closing of cinemas at lockdown, releases postponed,
    productions delayed
Out of Home:
•   Outdoor advertising in new hotspots – e.g. closer to
    supermarkets and pharmacies, or donating OOH space – e.g.
    United Airlines
Sponsorship:
•   Cancellation or postponement of live events (e.g. live sports
    events, concerts) - where contracts allow, sponsorship moved
    to virtual or esports events
Global media investment predicted to fall by 23% in H1 2020,
disproportionately affecting ‘traditional’ media

                               Source: WFA/Ebiquity                 35
Back to basics: multimedia campaigns are more impactful

                  Index of overall campaign contributions across all brand KPIs
     350%                                                                                                            332%

     300%

     250%                                                                                           236%

     200%
                                                         174%

      150%

               100%
     100%

      50%

       0%
              1 channel                              2 channels                                   3 channels   4 or more channels

                          Source: global Kantar CrossMedia database, 1,041 campaigns since 2015                                     36
TV and online video benefit most from integration and customisation
Channel level contribution by campaign type

         Not well integrated with the rest of the channels                                                                                            502
                                                                                                                                                                                                    478
         Integrated but not adapted/customised to the channel
                                                                                                                                                                                         372
         Integrated and adapted/customised - content tailored to the channel                                                               335
                                                                                             299        306

                                                                         219
                                                                   198
           149    137                        151
   100                         100    113                    100                 100                                           100                                          100

          Print                   Outdoor                Online Display                  Radio                                 Online Video                                              TV

                                                                                                                                         Data Source: Kantar global CrossMedia studies, 2015-2017, (223 studies).
                                                                                                       Categories: Food & Bev, Household, Retail, Travel, Personal care, financial services, technology, automobiles
                                                                                                                                                                                                               37
                                                                               Channel level contribution is a measure of channel impact on a combination of all brand KPIs (awareness, associations, motivation)
We’ve seen before that strong brands recovered NINE TIMES faster following
the financial crisis of 2008

                                                                                                                   +317%
                                                                                                                   BrandZ Top 10
                                                                                                                   Powerful Brands

                                                                                                                   +196%
                                                                                                                   BrandZ Strong
                                                                                                                   Brands Portfolio

                                                                                                                   +128%
                                                                                                                   S&P 500

                                                                                                                   +59%
                                                                                                                   MSCI Word Index

 2006   2007   2008   2009   2010   2011   2012   2013       2014          2015        2016   2017   2018   2019

                                                         Source: BrandZ Global, 2019                                              38
Implications for measurement

More choice                 More competition     Everything is measurable!

                                                 1   Do we need more investment in
More TV & Video content     The Streaming wars           ‒ cross-platform measurement?
                            are accelerating             ‒ streaming measurement?
      =

                                                 2   Without a total view of TV & Video consumption how
More choice for audiences
                                                     can content providers shape and monetise their
                                                     future audience offering?

                                                 3   Might economic circumstance accelerate the
                                                     advancement of cross screen measurement?

                                                                                                    39
Thank You

Materials will be available to download
via kantar.com tomorrow

Please complete our short pulse survey
You can also read