#LYS The next low cost long haul base in Europe ? - Routesonline
←
→
Page content transcription
If your browser does not render page correctly, please read the page content below
#LYS
           The next low cost
           long haul base in
               Europe ?

Septembre 2016

September 2017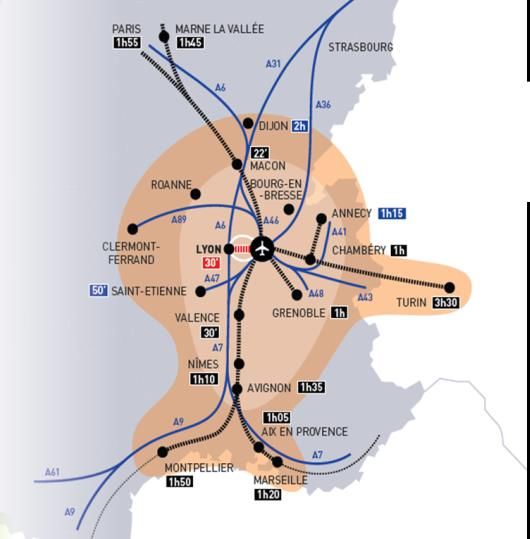
Why LYS is the perfect market for a low cost long haul
airline ?
France, an underserved market for long haul
o Despite the direct services offered by XL Airways to the French overseas
territories (Guadeloupe, Martinique and Réunion), let’s count the number of
cities with a direct service to the US : 2 (Paris & Nice), to Asia : 1 only (Paris)
or to South America : 1 only (Paris). France, with the capacity being
centralised in Paris and despite the strong O&D demand, is clearly an
underserved market for long haul, especially compared to its European
neighbourgs such as the United Kingdom, Spain, Germany or Ireland ;
LYS & Lyon, increasing awarenes globally
o With 3 UNESCO sites, the Alps just at a foot step, the vineyards…, LYS’
region is also a prime destination for inbound tourism. Tthe inbound traffic to
LYS is booming : 2.8 million passengers travelled inbound to LYS in 2016,
which was a +21% growth compared to 2015;
LYS, the largest unserved French city
o LYS is ranked number 1 in France in terms of O&D potential to most long haul
destinations, even without considering the leakages mainly directed to
Geneva (GVA) or to Paris (CDG and ORY) that represent about 60% of our
overall international potential according to a Skyscanner survey ;
o Bangkok, New York City, Fort-de-France …are just some examples of
unserved markets with a strong O&D demand evaluated to more than 100
one-way passengers each day, without taking into account the stimulation
effect that would be generated by new long haul services ;
LYS, a competitive airport in Europe
o LYS’ airport charges and taxes are 28% lower than Paris-CDG (CDG) or
169% when compared to Manchester (MAN), without taking any additional
incentive scheme into account. An airline opening an unserved destination
from LYS would benefit from LYS’ new route incentive scheme, which are
discounted passenger & landing fee for two years, but also from a dedicated
marketing plan to build the airline brand and the destination in LYS’ catchment
area.
Septembre 2016
September 2017
Why France is an opportunity for the low cost long haul
      airlines ?
      In Europe, France ranks number 3 in terms of population after Germany and the United
      Kingdom1. It also ranks number 3 in terms of GDP2, behind the same countries.

      As a consequence, the air traffic demand is important in France and the country presents
      one of the largest O&D potentials in Europe to most international destinations, as shown in
      the table below :

                              O&D passenger traffic (One-way passengers – Year 2016)

                                     Asia Sub-                         Far East            North          Southeast
                                                      Caribbean
                                     continent                           Asia             America           Asia
                                                       Cuba,
                                      India, Sri                         China,        Canada &          Indonesia,
          Including (examples) :                     Dominican
                                        Lanka                            Japan          the US           Cambodia
                                                       Rep.
           UNITED KINGDOM            2,329,000        931,000          2,122,000       8,321,000          1,849,000
                 GERMANY              785,000          665,000         1,956,000       3,908,000          1,497,000
                 FRANCE               731,000         1,394,000        1,440,000       3,674,000          1,107,000
                  ITALY               594,000          279,000         1,487,000       3,103,000           600,000
             SWITZERLAND              250,000          115,000          437,000        1,166,000           482,000
             Rank of France               3                1               4                3                 3
                                                                                   Source : Sabre Market Intelligence

      However and despite this strong traffic demand, France has an extreme low development of
      the capacity outside Paris. Paris is in fact in most cases (except for Delta’s seasonal service
      from New York to Nice and some leisure long haul services by XL Airways from some French
      airports), the only French city addressing the demand :

                           Benchmark among the Western European countries (2017)

                                      # of cities linked   # of cities linked # of cities linked      Population
                        Country
                                         to the US              to Asia       to South America          (2015)
             1         Germany                 7                    5                  1              81,174,000
             2            France              2                   1                   1               66,326,000
             3      United Kingdom            9                   3                   1               64,767,000
             4             Italy              5                   2                   2               60,796,000
             5            Spain               3                   2                   2               46,440,000
                                                                                                Source : OAG, Eurostat

      1   Source : Eurostat
      2   Source : Eurostat

Septembre 2016

September 2017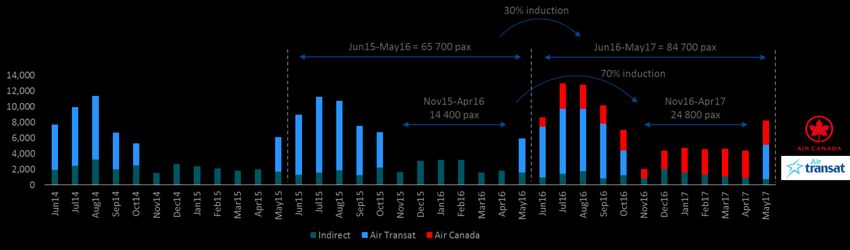
France appears more and more as an exception at a time when non-capital cities become
      more and more important in airlines’ network development strategy : Barcelona for Level and
      Cologne for Eurowings…

      As an example, out of the 20 new destinations opened from New York during the last 5
      years, 11 concerned non-capital cities. None in France…

      To the contrary, in France, Norwegian decided to open a base in Paris, where 7 airlines
      already operate scheduled direct flights to New York City (American Airlines, Air France,
      Delta, La Compagnie, Open Skies, United and XL Airways).

      New routes opened during the last 5 years between New York city and European cities

                              2012-17 %
         Destination city   Average annual
                              growth rate
           Newcastle            28,5%
         Leeds Bradford         28,5%
            Palermo             27,2%
             Athens             21,2%
           Edinburgh            18,6%
            Reykjavik           17,5%
           Nottingham           14,9%
             Lisbon             12,2%
                 Dublin         10,3%
             Malaga             9,9%
           Manchester           9,1%
                 Berlin         9,0%
           Dusseldorf           7,9%
             Vienna             7,1%
            Glasgow             6,8%
                 Milan          6,8%
             Warsaw             5,8%
                 Kiev           5,1%
           Copenhagen           4,4%
            Shannon             3,8%
                                                                                     Source : OAG

Septembre 2016

September 2017
And this centralisation has of course a direct impact on the overall air services to France :
1. First, the dynamic of the overall market in France is naturally restrained by this lack of
air services outside Paris, as shown on the graph below.
Evolution of the O&D market to the US from France, Ireland and the United
Kingdom (2010 base index)
IRELAND UNITED KINGDOM FRANCE
150
140
130
120
110
100
90
2010 2011 2012 2013 2014 2015 2016
Source : Sabre Market Intelligence
While the O&D traffic between the US and Ireland and the United Kingdom increased by
an average of +6.2% and +3.7% per year, the growth remained more steady in France
with a +2.1% on average each year.
2. Second, because of the traffic leakages to airports located in other countries. We, for
instance, evaluate that 1.2 million passengers each year living in LYS’ catchment
area and departing from Geneva (GVA) in Switzerland travel to long haul destinations
especially to North America, the Carribean and Asia. This is of course a tremendous
loss of traffic and GDP for both LYS and France ;
As a consequcence, France currently drops behind the other European countries both in
terms of market dynamic and of territorial development outside the capital. But it also mean
that it would represent an even more obvious opportunity for an airline looking for a strong
O&D demand in an open competitive environment, compared to main or capital airports.
Septembre 2016
September 2017Why LYS is an opportunity for low cost long haul airlines ?
We already talked a lot in the previous white papers of the main assets of LYS’ catchment
area. But it is always good to review the basics :
LYS’ region, called the Auvergne-Rhône-Alpes, has a country sized economy. With
7.9million inhabitants and a GDP of more than 240 b€, the region is larger than
Finland (5.7million inhabitants and a GDP of 214 b€ ). If we keep on with
comparisons, we can also say that LYS’ region is richer than Portugal (GDP of
185b€) and more populated than Ireland (4.7million inhabitants), Ireland where for
instance has 3 cities which are directly linked to New York : Dublin the capital of
course, but also Shannon and Cork ;
LYS has clearly the strongest catchment area in France in terms of population, GDP,
average income…but also in terms of tourism, as shown below :
Comparison between LYS and BOD, MRS/NCE and TLS’s regions on a different
set of macro indicators
Source : INSEE (French Bureau of Statistics)
LYS’ region is also a prime destination for inbound tourism. And it appears more and
more through both the airport and Only Lyon tourism board statistics. As an
illustration, 30% of our passengers were travelling inbound to LYS in 2016 3. This
means that 260,000 return passengers travelled inbound to LYS’ region in 2016 ; it is
a +10% growth compared to the previous year.
3 Source : LYS Passengers Survey
Septembre 2016
September 2017The demand for air travel is very important in LYS’ region. LYS is without surprise ranked
number 1 in France in terms of O&D potential to most of the long haul destinations.
Compared O&D traffic from a set of unserved French airports
(without considering the leakages – one-way passengers)
One could say that Nice (NCE) can also sustain the comparison, especially to North
America…but it would be without considering that :
1. The seasonality : Nice (NCE) is a leisure / summer orientated airport. As an example,
in LYS, July is 29% busier than February. As a comparison, in NCE, there is 50% less
traffic in January than in July. More globally, the traffic is less volatile over the year in
LYS than from any other French regional airports.
2. The leakages, LYS’ hidden potential. According to a survey led on the online
searches made on Skyscanner4 by users living in LYS’ region, airlines overlook 60%
of LYS’ opportunity when just looking at the MIDT data, as shown in the graph
hereafter. Out of 10 searches led on Skyscanner by users living in LYS’ catchment
area5, 6 are made from a departure airport that is not LYS (GVA, CDG…).
4 Skyscanner is a travel fare aggregator website and online travel search engine. The website is owned by Ctrip
since November 2016, the largest travel company in China. The site is available in over 30 languages and is used
by 60 million people per month (source : Skyscanner)
5 Defined here as the former Rhône-Alps region
Septembre 2016
September 2017LYS’ share among Skyscanner searches in 2016
Source : Skyscanner
LYS’ situation towards leakages is indeed very unique in France. We indeed cannot deny
that leakages are to be considered also from the other benchmarked airports. But the ratio
are very different from what we observe in LYS. As an illustration, we use the same
Skyscanner data for users living in the French Riviera (Provence-Alpes-Côte-d’Azur) which is
MRS and NCE’s greater region.
MRS and NCE’s share among Skyscanner searches in 2016
Source : Skyscanner
Out of 10 searches on Skyscanner by users living in MRS and NCE’s catchment area6, 3 are
made from a different origin airport.
Let’s compare again then the O&D potential from LYS and from NCE, considering this
average 60% / 30% leakage factor.
6 Defined here as the Provence-Alpes-Côte-d’Azur (French Riviera)
Septembre 2016
September 2017Compared O&D traffic from a set of French airports
(leakages included – one-way passengers)
LYS including NCE including LYS vs NCE
Destination LYS O&D NCE
leakages leakages %
NYC 52,980 84,770 112,870 146,730 - 42%
RUN 45,500 72,800 6,940 9,020 707%
BKK 37,910 60,660 42,250 54,930 10%
PTP 31,390 50,220 8,710 11,320 344%
FDF 26,710 42,740 7,280 9,460 352%
SFO 24,160 38,660 19,490 25,340 53%
LAX 22,680 36,290 35,120 45,660 -21%
HAV 17,510 28,020 6,790 8,830 217%
MIA / FLL 17,690 28,300 31,240 40,610 -30%
PUJ / SDQ 13,640 21,820 4,790 6,230 250%
GIG / SSA 8,710 13,940 8,820 11,470 22%
Source : Sabre market intelligence, Skyscanner
The conclusion is then clearly obvious on the opportunity LYS would represent for airlines.
In addition, a low cost long haul airline would clearly attract passengers from a larger
catchment area, especially thanks to the direct high-speed trains (TGV) and low cost high-
speed trains (Ouigo) that connect Marseille and Montpellier to LYS train station.
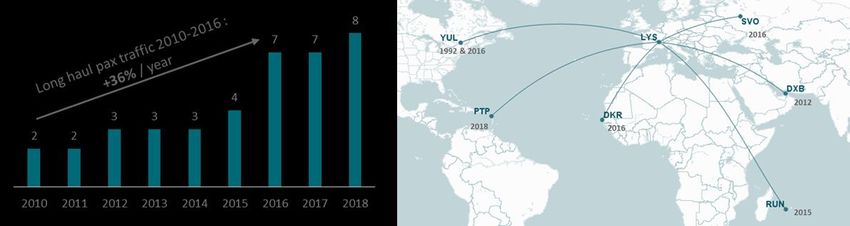
Direct high-speed train network from LYS train station
A new long haul service would also capture a share
of MRS and MPL’s O&D potential as already
observed for Emirates : 11% of Emirates outbound
passengers in LYS live in MRS and MPL’s regions.
LYS is currently in the spotlight. The traffic grew by
+10% in 2016 compared to 2015 and the positive
trend is confirmed for this year. LYS will surpass the
10 million threshold for the first time.
Septembre 2016
September 2017LYS’ traffic evolution since 2000
Source : Aéroports de Lyon
The traffic growth is coming from the long haul market that was clearly under-dimensionned
in LYS up until now.
In 2016, for instance, 3 new long haul services were launched from LYS :
Aigle Azur, the French Airlinechose LYS to launch its first long haul outside Paris to
Dakar (DKR) ;
Air Canada started in June 2016 to Montreal (YUL). Operated 5 times a week in
Summer and 4 times a week in Winter, it is LYS’ only year-round transatlantic service
and Air Canada’ssecond direct city in France ;
Aeroflot
started in June 2016 a direct service to Moscow-Sheremetyevo (SVO). The Russian
carrier started to operate 4 times a week before increasing to a daily service.
Evolution of the number of long haul services from LYS since 2010
Source : Aéroports de Lyon
Septembre 2016
September 2017As shown above, the number of passengers travelling from LYS to long haul destinations
(see the map) increased by +36% in average each year since 2010! The dynamic continues
as XL Airways will operate a new LYS-Point-à-Pitre (PTP in Guadeloupe), which will start
from January 2018.
The new capacity offered undoubtlesly leads to additional traffic. When an airline dares to
take its chance on LYS, it obviously fills the aircrafts both by capturing both the pre-existing
O&D potential and some of the leakages and of course by stimulating the demand. See the
two examples below :
Montreal (YUL) – LYS O&D traffic evolution since 2014
Source : Sabre Market Intelligence
Since Air Canada launched the LYS-Montreal (YUL) direct service in June 2016 and even if
the destination was already operated during summer only by Air Transat, the O&D traffic has
grown by +30% in one year. The stimulation is even more obvious in winter when no direct
service existed : +70% on the O&D traffic.
Moscow (MOW) – LYS O&D traffic evolution since 2014
Source : Sabre Market Intelligence
Another example with Aeroflot below that started its 4/7 service in June 2016 and later
increased to a daily since January 2017.
Septembre 2016
September 2017As shown on the graph above, we observe a +78% stimulation factor on the LYS-Moscow
O&D demand.
Both Air Canada and Aeroflot then experienced high induction factors in LYS by launching a
new year round service. Let’s then imagine what the market stimulation could be for a low
cost long haul airline !
A competitive airport for low cost long haul carriers
LYS presents :
The strongest economic and demographic region in France after Paris
The highest existing (undeveloped) O&D potential to a large set of long haul
destinations
But LYS is also a competitive airport for low cost long haul airlines in terms of fees and
charges.
The table below presents the fees per passenger calculated on a large set of European
airports based on a A330-300 (with a MTOW of 233t) and a 90% average load factor on
international destinations.
Benchmark of public airport fees & charges (including taxes) for a set of European
airports
BCN LYS MXP CDG FCO STN MAN LGW BHX
Landing 7.82 € 4.13 € 5.88 € 3.27 € 3.05 € 2.12 € 5.95 € 5.48 € 9.35 €
PSC 19.79 € 14.15 € 17.44 € 22.60 € 28.41 € 12.85 € 7.06 € 16.28 € 13.90 €
PRM 0.59 € 0.74 € 1.15 € 0.70 € 0.86 € 0.26 € 0.53 € 0.32 € 0.41 €
Security 3.63 € 7.75 € 3.25 € 11.50 € 3.34 € 6.40 €
Sec. Sur-
1.24 € 1.25 € 1.25 € 2.27 €
tax
CAA tax 8.00 € 8.00 €
Solidarity
4.51 € 4.51 €
tax
Other
15.50 € 17.50 € 1.65 € 0.65 € 0.82 €
taxes
APD 87.30 € 87.30 € 87.30 € 87.30 €
TOTAL € /
33.1 € 40.5 € 43.2 € 51.8 € 55.4 € 102.5 € 108.9 € 110.0 € 111.8 €
dep pax
% vs LYS -18% 7% 28% 37% 153% 169% 172% 176%
Septembre 2016
September 2017LYS ranks then number 2 out of this benchmark. It is for instance 28% cheaper than Paris-
CDG (CDG) or 169% than Manchester (MAN).
This is even without accounting for the public incentives. LYS indeed offers a special
incentive scheme for airlines opening new destinations that are not currently served from
LYS. The prerequisites to be eligible are as follows :
The route must be operated at least for 16 consecutive weeks ;
The route must be operated twice a week for short / middle haul routes (< 3,400 km)
and once a week for long haul routes.
If the conditions are all fulfilled, the airline is eligible to a special discount off the passenger
and landing fee for this route :
-75% during the first year;
-50% for the second year.
LYS fees & charges – 2017 / 2018
€ / dep pax Year 1 Year 2 Year 3
Landing fee 4.13€ 4.13€ 4.13€
Parking fee 0.83€ 0.83€ 0.83€
PSC fee 14.15€ 14.15€ 14.15€
RMP 0.74€ 0.74€ 0.74€
400 Hz & bridges 1.11€ 1.11€ 1.11€
TOTAL 20.96€ 20.96€ 20.96€
New Route Incentive
Discount off landing fee -75% -50% 0%
Discount off PSC -75% -50% 0%
TOTAL € / dep pax 7.45€ 11.95€ 20.96€
And this is even without taking account the performance bonus incentive scheme (loyalty
program) that the airline would benefit from in LYS, starting from year 3 or any dedicated
marketing support program that LYS would implement to promote the airline and the
destination(s).
Septembre 2016
September 2017Main long haul opportunities from LYS
2016 and 2017 are turning points for LYS, LYS is now on a dynamic growth curve. However,
LYS remains a star with many opportunities still available for airlines.
There remains high-potential markets unserved today. You will then find below a list of
opportunities identified thanks to Sabre GDD data.
We evaluate here the outbound leakages using Sabre Point of Sale (POS) data processed
through Beontra B route development 7. Nevertheless, this methodology (actually the only
one we have) still underestimates the actual number of passengers leaking from our airport
because:
The POS data only accounts for the bookings made on GDS and airline online
bookings are not included in the evaluation ;
The information included in the data set are also under-evaluated because of the fact
that leading travel agencies in the French market, are mainly based (and issue the
tickets) outside LYS catchment area, like Carlson Wagonlit (CWT – in Paris,
Clermont-Ferrand…), American Express (in Paris), BCD Travel (in Paris, Lille and
Montpellier)… It is even truer with the major Online Travel Agencies (OTA): OPODO,
Lastminute.com, Odigeo (Opodo, eDreams, Go Voyages…).
This means a passenger who lives in our catchment area and buys their ticket from Paris
(PAR) to New York (NYC) through an OTA, a Business Travel Agency or directly through an
airline website (one global airline told us +40% of their French sales are issued by their
website), are not considered as part of our outbound leakages.
From the figures evaluated for the outbound traffic and knowing that 31% of LYS non-
connecting passengers travel inbound to LYS8 (this is an average, we are indeed able to
evaluate this ratio per destination airport, city or country), we estimate the inbound leakages,
ie the number of passengers travelling to our catchment area without using LYS as
destination airport.
Please send us your comments on what we should write for our next White Paper.
Contact LYS network development team to get further information:
NetworkDevelopmentTeam-LyonAirports@lyonaeroports.com.
7 LYS catchement area is defined as the following French « départements » : 01 (Bourg-en-Bresse), 07 (Privas),
26 (Valence), 38 (Grenoble), 42 (Saint-Etienne), 43 (Le Puy-en-Velay), 69 (Lyon), 71 (Châlons-sur-Saone), 73
(Chambéry) and 74 (Annecy)
8 Source : LYS Passengers survey – Year : 2016
Septembre 2016
September 2017Main long haul unserved / underserved markets from LYS
Leakages PPDEW
Destination Leakages
O&D traffic outbound from TOTAL Potential WITHOUT
code inbound to LYS
LYS STIMULATION
NYC 52,980 58,540 10,050 121,570 167
RUN 45,500 85,830 19,780 151,110 207
BKK 37,910 53,810 0 91,720 126
PTP 31,390 94,940 0 126,330 173
FDF 26,710 82,020 0 108,730 149
SFO 24,160 12,730 2,450 39,340 54
LAX 22,680 27,170 4,020 53,870 74
HAV 17,510 13,210 0 30,720 42
MIA / FLL 17,690 11,520 1,850 31,060 43
PUJ / SDQ 15,060 24,050 0 39,110 54
GIG / SSA 8,710 6,240 0 14,950 20
DPS 8,000 27,150 0 35,150 48
Source : Sabre Market Intelligence, Beontra B route development, LYS Passengers survey
Septembre 2016
September 2017You can also read