Latrobe Municipality Local climate profile
←
→
Page content transcription
If your browser does not render page correctly, please read the page content below
Local climate profile
Latrobe Municipality
Past and current climate:
The Latrobe municipality experiences a mainly temperate,
maritime climate and relatively small seasonal variations (an
average daily maximum temperature of around 22 °C in
February, 13 °C in July).
The average annual rainfall across the municipality is around
800-1000 mm per year with a strong seasonal cycle (e.g. East
Sassafras receives 900 mm, minimum of 40 mm in February
and a maximum of 114 mm in August).
Rainfall in the Latrobe municipality can come from the regular westerly frontal rain systems that
cross Tasmania, however an important fraction of the rainfall comes from episodic systems from
the north and east, including cutoff lows.
Year-to-year rainfall variability in this area shows a correlation with the El Niño Southern
Oscillation in winter and autumn (where El Niño winters are generally drier than average, La Niña
winters are generally wetter than average), and some correlation with the Indian Ocean Dipole in
winter and spring.
Average temperatures have risen in the decades since the 1950s, at a rate similar to the rest of
Tasmania (up to 0.15 °C per decade). Daily minimum temperatures have risen slightly more than
daily maximum temperatures.
There has been a decline in average rainfall and a lack of very wet years in the Latrobe
municipality since the mid 1970s, and this decline has been strongest in autumn. This decline
was exacerbated by the ‘big dry’ drought of 1995-2009. The recent two years have seen above
average rainfalls.
Future scenarios - from the Climate Futures for Tasmania project
Fine-scale model projections of Tasmanian climate were made for two hypothetical but plausible
scenarios of human emissions for the 21st Century (taken from the special report on emissions
scenarios (SRES) from the Intergovernmental Panel on Climate Change (IPCC)). The scenarios are
of ongoing high emissions, A2, and one where emissions plateau and fall, B1. The climate response
under the two scenarios is similar through the first half of the century, but the changes under the
higher emissions scenario become much stronger than the lower scenario in the later half of the 21st
Century.
1. Temperature
Under the higher emissions scenario (A2), the Latrobe municipality is projected to experience a
rise in average temperatures of 2.6 to 3.3 °C over the entire 21st Century. The rise in daily
minimum temperature is expected to be slightly greater than daily maximum temperature, and
fairly similar in the different seasons. Under the lower emissions scenario (B1), the projected
change over the entire century is 1.3 to 2.0 °C. A time series of projected mean Tasmanian
temperature is shown in Figure 1.
Produced by Michael Grose, Antarctic Climate and Ecosystems Cooperative Research Centre,
using material from the technical reports of the Climate Futures for Tasmania project
1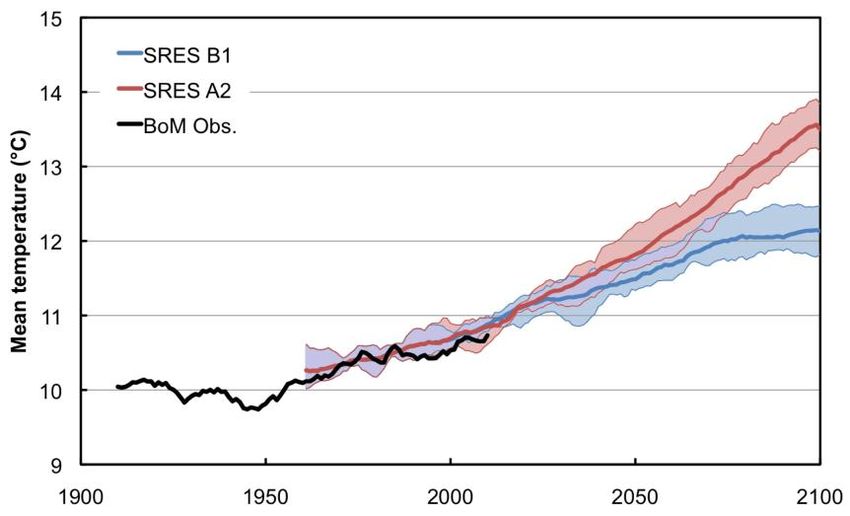
The projected change in average temperatures is similar to the rest of Tasmania, but less than
the global average and significantly less than northern Australia and many regions around the
world, especially the large northern hemisphere continents and the Arctic.
Figure 1. Tasmanian average temperature in observations (black) and model projections for the A2
scenario (red) and the B1 scenario (blue), all series are smoothed (11-year running average),
shading shows the range of model projections. Changes under the higher scenario by the very end of
the century are discussed in the examples below.
The projected change in average temperature is accompanied by a change in the frequency,
intensity and duration of hot and cold extremes of temperature. For Port Sorell under the A2
(higher) scenario by the end of the century the projections indicate:
o The number of Summer Days (>25 °C) increases from around 10 days per year to more
than 30 days per year, with nighttime temperatures over 20 °C occurring regularly.
o The temperature of very hot days increases more than the change in average
temperature (by 3 to 4 °C in some locations in some seasons).
o A reduction in frost-risk days from around 6 per year, to approximately 1 per year.
o Warm spells (days in a row where temperatures are in the top 5% of baseline levels)
currently last around 6 days, are projected to last 19 days longer.
Produced by Michael Grose, Antarctic Climate and Ecosystems Cooperative Research Centre,
using material from the technical reports of the Climate Futures for Tasmania project
22. Rainfall, runoff and rivers
The projected pattern of change to rainfall and runoff is similar in nature between the two
scenarios, but stronger by the end of the century under the A2 scenario. The general long-term
influence of climate warming by the end of the century is for a slight increase in annual average
rainfall in the Latrobe municipality.
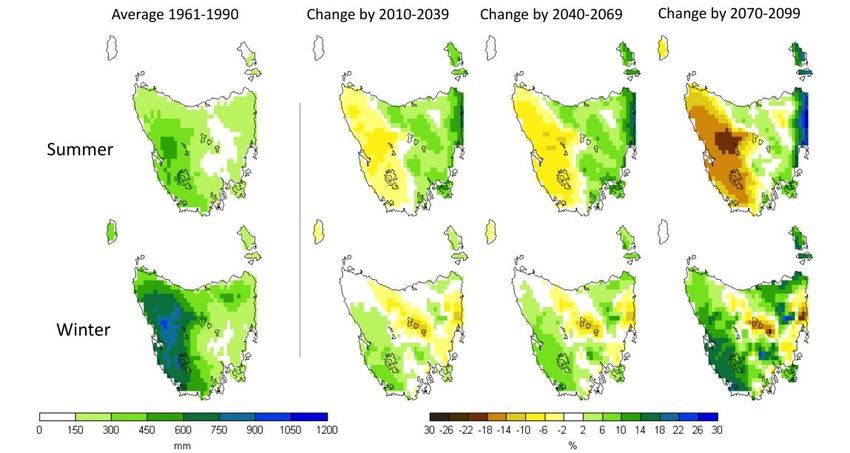
Figure 2. Average rainfall in summer and winter – the left hand side plots show the average
rainfall in the baseline period (1961-1990), the plots to the right show the proportional change (%)
from that amount in various periods in the 21st century in the average of six climate model
projections under the A2 (higher) emissions scenario.
The model mean projection is that annual average rainfall is projected to increase under the A2
scenario by the end of the century (model mean is for 0 to 5%). Most models agree with this
change. The tendency is for little change under the B1 scenario.
The model mean shows that rainfall is projected to slightly increase in winter, spring and summer,
with little change in autumn (see Fig. 2 for summer and winter).
The long-term effect of greenhouse warming is on top of the usual cycles of rainfall, including
droughts, termed ‘natural variability’. The model projections indicate that the recent dry conditions
of the ‘big dry’ drought is not a new ongoing climate average state. These projections indicate
that in the long term, drought frequency and severity in the area may actually reduce slightly due
to the increase in average rainfall.
The projected increase in rainfall is driven by changes to the average circulation of the region and
the incidence of the main rain-bearing weather systems from the east and north, including a
change in atmospheric blocking and cutoff lows.
Produced by Michael Grose, Antarctic Climate and Ecosystems Cooperative Research Centre,
using material from the technical reports of the Climate Futures for Tasmania project
3 A major influence of greenhouse warming on rainfall is the tendency for heavier rainfalls
interspersed by longer dry periods, and for greater extremes. For Latrobe under the A2 (higher)
scenario by the end of the century there is projected to be:
o Around 7 fewer rain days with >1 mm per year on average, but significantly more rain per
rain day (>10% increase).
o Up to 4 more very wet days each year (where rainfall exceeds the baseline 95th
percentile), including 2 more days of >20 mm rainfall each year.
o An increase in the maximum instantaneous rainfall rate of over 30% in some seasons,
around 20% more rainfall on the wettest day of the year.
o An increase in rainfall brought by rare extreme events: a 200-year average recurrence
interval (ARI) event for daily rainfall is projected to increase by more than 35 mm (an
increase of more than 35%). Other ARI events (ARI-10, ARI-50) are projected to increase
by a similar proportion.
Pan evaporation is projected to increase, by up to 19% under the A2 scenario by the end of the
century, driven by the increases in temperature but also changes to relative humidity, wind
speeds, cloudiness and radiation.
Changes to rainfall and evaporation lead to changes in water runoff and river flows. This in turn
has impacts on the inflows into dams and water storages. Under the A2 scenario by the end of
the century:
o Average runoff is projected to increase slightly in all seasons.
o Proportional (%) increases in average runoff are larger than the change to rainfall, with
increases of over 10% possible in some seasons.
o High daily runoff amounts are projected to increase, including those that may lead to
erosion or flooding, daily runoff amounts during low flows are projected to stay much the
same.
o There is a range of projected trends in river flows in this region between the different
models, but the central estimate is for little change to average flows by the end of the
century in the major river, the Mersey (central estimate is around -1%), but with some
increase in the Rubicon River (+12%), with changes to the seasonality of flows and the
incidence of high flows.
o Inflows into Cascade Reservoir are projected to stay much the same, or increase slightly
towards the end of the century.
3. Agricultural impacts
Frosts are projected to decrease significantly with a warming climate. At the coast, frosts are
projected to become very infrequent, and at Sassafras, frost-risk days are projected to fall from
around 35 days per year, to less than 10 days per year by thee end of the century under the
higher emissions scenario. Damaging Spring frost may still occur.
Chilling affects the growth and flowering of berries, fruits and nuts. Accumulated chill hours are
projected to decrease significantly in a warming climate, except in high-altitude sites where
chilling will in fact increase (areas that are currently too cold). Chill hours in the Spreyton area in
the season May-September are projected to fall from around 2200 hours in the baseline period to
around 1200 by the end of the century under the higher emissions scenario.
Produced by Michael Grose, Antarctic Climate and Ecosystems Cooperative Research Centre,
using material from the technical reports of the Climate Futures for Tasmania project
4 There is a projected increase in Growing Degree Days (a measure of the heat to grow and ripen
crops). This may reduce the time to harvest of many crops, or affect other aspects of crop choice
and management.
Because of the increase in rainfall and heavy rains, there is projected to be a slight decrease in
the time in severe drought in the region by the end of the century, measured as the proportion of
time when the standardized precipitation index (SPI) is less than minus two. For example, at
Merseylea this proportion is projected to fall from 2.3% to 1.8% by the end of the century under
the higher emissions scenario.
Projections show that the growth of grass for dairying will be strongly affected under the higher
emissions scenario. Simulations of growing conditions at Merseylea indicate that the annual cut
yield of dryland ryegrass could increase by up to 50% and then plateau, with the majority of the
increase in spring growth. The increase is caused mainly by a reduction in temperature limitation
and then the plateau is due to water limitation. Projected yields of irrigated ryegrass show a
moderate increase to the middle of the century, then a decline due to an increase in days over
the upper threshold for growth (28 °C). Switching to other cultivars (such as Kikuyu) may give
higher yields, and increasing carbon dioxide concentrations can lead to greater water use
efficiency.
4. Extreme sea level events
High water events causing coastal inundation comes from a combination of sea level, tide, storm
surge and wind waves. Sea level has been rising at a rate of 3.3 ±0.4 mm/year in the recent period,
and is expected to continue rising with further climate warming. The last IPCC assessment report
gave a central estimate of a rise of 0.82 m global average sea level by 2100 under a high emissions
scenario. The sea level rise varies in different locations, and for the coast of Tasmania the sea level
rise for this scenario is close to the global average.
On the north coast of Tasmania, the very high tide heights contribute more to coastal inundation
events than the relatively modest very storm surge heights – the current 100-year storm tide event is
around 1.9 to 2.0 m above average sea level. Changes to storm surges by the end of the century will
not be as large as sea level rise. Accounting for all effects, the current 100-year event in George
Town will be exceeded every 10 to 30 years by 2030, and more frequently than once every 4 years in
2090 under the high emissions scenario. Similar changes can be expected for the coastal regions in
the Latrobe municipality (e.g. Port Sorell).
5. River floods – Mersey River
Changes to design flood hydrographs were calculated for the 1:10, 1:50, 1:100 and 1:200 annual
exceedance probability events for future periods using the climate model outputs and flood hydraulic
models by partners at Entura consulting. Short duration events are projected to become more
intense, so catchments with a critical duration of less than 72 hours will experience high flood levels
and faster response times.
The Mersey River has a critical duration of less than 72 hours, so the peak flood discharge is
projected to increase significantly through the 21st Century. For Latrobe, increased flooding events
can be expected through both increased sea level, changes to storm surge and through increased
river floods. Please see the full Entura report and accompanying maps for more details.
Produced by Michael Grose, Antarctic Climate and Ecosystems Cooperative Research Centre,
using material from the technical reports of the Climate Futures for Tasmania project
5equations and a 10 °C threshold to calculate
Appendix – details of climate projections
Growing Degree Days.
Greenhouse gas emissions have an influence on the
Earth’s climate system, along with other human All information is drawn from the Climate Futures for
activities such as the emission of ozone-depleting Tasmania Technical reports please see these reports
substances, emission of aerosol (particles) and for more details, and to cite in other written work.
changing the land cover (e.g. deforestation).
Sophisticated model simulations can be used to Reference list
project the likely effect of these influences into the Bennett JC, Ling FLN, Graham B, Grose MR, Corney SP, White
future given our current state of knowledge. It is CJ, Holz GK, Post DA, Gaynor SM & Bindoff NL 2010,
Climate Futures for Tasmania: water and catchments
impossible to predict exactly what future human technical report, Antarctic Climate and Ecosystems
emissions will be, so models are run under a set of Cooperative Research Centre, Hobart, Tasmania
plausible hypothetical emissions scenarios. A model
Corney SP, Katzfey JJ, McGregor JL, Grose MR, Bennett JC,
simulation shows the likely effect if we follow that White CJ, Holz GK, Gaynor SM & Bindoff NL 2011,
scenario, so it is not a single ‘prediction’ of the future. Climate Futures for Tasmania: climate modeling
The simulation can’t include the effect of things that technical report, Antarctic Climate and Ecosystems
are impossible to predict (such as major volcanic Cooperative Research Centre, Hobart, Tasmania
eruptions). Entura Consulting, 2010, Climate Futures for Tasmania Flood
inundation mapping, Entura Consulting Technical
The Climate Futures for Tasmania project produced a
report, 23 Dec 2010
set of climate projections at the regional scale for
Tasmania. Two emissions scenarios were considered Grose MR, Barnes-Keoghan I, Corney SP, White CJ, Holz GK,
– one of ongoing high emissions (SRES A2), and one Bennett JC, Gaynor SM & Bindoff NL 2010, Climate
Futures for Tasmania: general climate impacts
where emissions plateau and fall (SRES B1). The technical report, Antarctic Climate and Ecosystems
climate response under the two scenarios is similar Cooperative Research Centre, Hobart, Tasmania
through the first half of the century, but the changes
Holz GK, Grose MR, Bennett JC, Corney SP, White CJ, Phelan
under the higher emissions scenario become much
D, Potter K, Kriticos D, Rawnsley R, Parsons D, Lisson
stronger than the lower scenario in the latter half of S, Gaynor SM & Bindoff NL 2010, Climate Futures for
the 21st Century. Tasmania: impacts on agriculture technical report,
Antarctic Climate and Ecosystems Cooperative
Climate warming causes many complex changes to Research Centre, Hobart, Tasmania
the earth’s climate system. These changes include
alterations to ocean currents, average atmospheric McInnes KL, O’Grady JG, Hemer M, Macadam I, Abbs DJ,
White CJ, Bennett JC, Corney SP, Holz GK, Grose
circulation and ocean-atmosphere cycles such as the MR, Gaynor SM & Bindoff NL In Press, Climate
El Niño Southern Oscillation. Projected effects that Futures for Tasmania: extreme tide and sea level
are relevant to Tasmania include a continued events technical report, Antarctic Climate and
extension of the East Australia Current bringing Ecosystems Cooperative Research Centre, Hobart,
warmer waters off the east and northeast coast of Tasmania
Tasmania, a pole-ward shift of the subtropical ridge of White CJ, Sanabria LA, Grose MR, Corney SP, Bennett JC,
high pressure and shifts in the mid-latitude westerlies Holz GK, McInnes KL, Cechet RP, Gaynor SM &
(the ‘Roaring 40s’), and a change in remote climate Bindoff NL 2011, Climate Futures for Tasmania:
extreme events technical report, Antarctic Climate and
drivers such as atmospheric blocking, the El Niño
Ecosystems Cooperative Research Centre, Hobart,
Southern Oscillation and the Southern Annular Mode. Tasmania
The position of Tasmania adjacent to the Southern
Ocean means that the effect of climate warming is not The material in this report is based on computer modelling
projections for climate change scenarios and, as such, there are
as severe as other more continental regions. inherent uncertainties involved. While every effort has been
The results presented in this report were made using made to ensure the material in this report is accurate, Antarctic
Climate & Ecosystems Cooperative Research Centre (ACE)
established methods, including: provides no warranty, guarantee or representation that material
is accurate, complete, up to date, non-infringing or fit for a
Extreme value distribution fitting in a generalized
particular purpose. The use of the material is entirely at the risk
Pareto distribution to calculate the average of a user. The user must independently verify the suitability of
recurrence intervals (ARIs). the material for its own use.
To the maximum extent permitted by law, ACE, its participating
Hydrology runoff models developed and organisations and their officers, employees, contractors and
calibrated for the Tasmanian Sustainable Yields agents exclude liability for any loss, damage, costs or expenses
project to estimate the runoff, river flows and whether direct, indirect, consequential including loss of profits,
inflows to storages. opportunity and third party claims that may be caused through
the use of, reliance upon, or interpretation of the material in this
Standard agricultural indices such as the Utah report.
model to calculate chill hours and standard
Produced by Michael Grose, Antarctic Climate and Ecosystems Cooperative Research Centre,
using material from the technical reports of the Climate Futures for Tasmania project
6You can also read