Monthly Climate Bulletin - February 2021 - ISSN: 2617-3565 Photo Credit: Tropical Cyclone Ana in FijiFiji National Disaster Management Office - SPREP
←
→
Page content transcription
If your browser does not render page correctly, please read the page content below
Monthly Climate Bulletin
February 2021

                                                                            ISSN: 2617-3565
           Photo Credit: Tropical Cyclone Ana in FijiFiji National Disaster Management Office
CONTENTS

Summary                        2
El Niño–Southern Oscillation   3
Madden–Julian Oscillation      4
Wind                           5
Cloud and Rainfall             6
Oceanic Conditions             9
Mean Sea Level Pressure        13
Model Outlooks                 14
Cyclones                       17
Further Information            18

1 | Monthly Climate Bulletin
SUMMARY
Issued 09 March 2021

•     The 2020-21 La Niña has passed its peak and is now weakening.
•     The Madden-Julian Oscillation (MJO) is currently weak and indiscernible. Climate
      models indicate a pulse of the MJO is expected to develop and move east over trop-
      ical Americas and Africa in the coming fortnight.
•     The OLR total and anomaly maps suggest the Intertropical Convergence Zone (ITCZ)
      was less active than normal. The South Pacific Convergence Zone (SPCZ) on the oth-
      er hand, was active and shifted to the southwest of normal.
•     The February Rainfall image shows active convection over the Maritime Continent,
      northern Australia, and the southwestward-shifted SPCZ.
•     February Mean Sea Level Pressure (MSLP) anomaly map shows negative anomalies
      over New Caledonia, Vanuatu, Fiji and east of about 170° in the tropical Pacific.
•     Coral bleaching was on Alert Level 1 and 2 just east of PNG and parts of southern
      Solomon Islands, Vanuatu, and Cook Islands with watch and warning alerts for re-
      mainder of the countries.
•     A significant marine heatwave event is persisting to the south of Cook Islands.
•     For March to May 2021, the dynamical models (as well as SCOPIC) agree on above
      normal rainfall for Palau, FSM, central to northern Marshall Islands, areas in South-
      ern Regions of PNG, New Caledonia, Vanuatu, Fiji, Tonga, southern Cook Islands
      and southern French Polynesia. The models also agree on below normal rainfall for
      northern PNG, Nauru, Kiribati, Tuvalu, Tokelau, northern Cook Islands and central
      and northern French Polynesia..

    © SPREP 2021
    This copyright statement protects our work from commercial exploitation, while ensuring that the information can be freely used for scien-
    tific, educational or research purposes, provided SPREP and the source document are acknowledged.

    2 | Monthly Climate Bulletin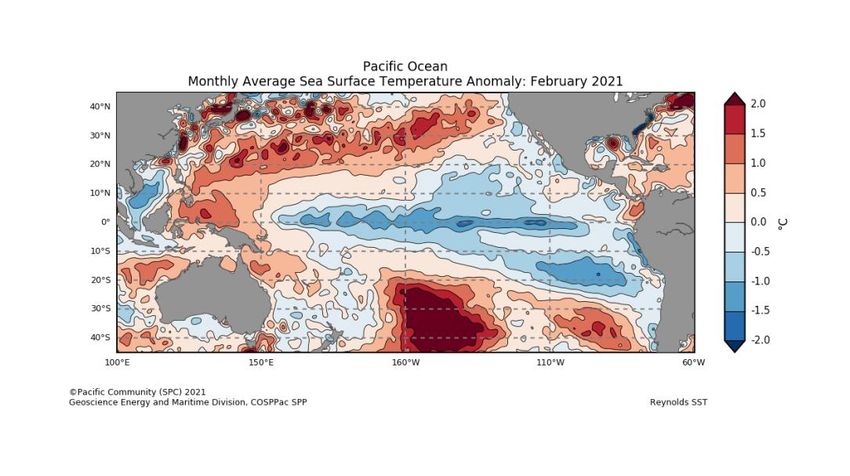
EL NIÑO–SOUTHERN OSCILLATION
La Niña weakens, but influence likely to continue into autumn

Click link to access    Climate Driver Update issued on 2 March 2021

The 2020-21 La Niña is likely to have peaked with respect to atmospheric and oceanic patterns
in the tropical Pacific. However, impacts associated with La Niña such as above-average rainfall,
are expected to persist in the western pacific into early March.

Over the past fortnight the sea surface temperatures across Pacific Ocean basin have warmed
by 0.2° C. The 90-day Southern Oscillation Index (SOI) has decreased slightly but continues to
remain well above the La Niña threshold of +7, and trade winds have returned to near-average
strength in the central tropical Pacific.

Model outlooks indicate a return to neutral conditions (neither El Niño nor La Niña) during Febru-
ary or early March.

The 30-day Southern Oscillation Index (SOI) for the 30 days ending 31 January was +16.5. The
90-day SOI value was +14.8.

 3 | Monthly Climate Bulletin
EL NIÑO–SOUTHERN OSCILLATION
 La Niña weakens, but influence likely to continue into autumn

 Click link to access             Climate Driver Update issued on 2 March 2021

Bureau of Meteorology NINO3.4 ENSO Model Outlooks for March, May and July

                 Bureau of Meteorology NINO3.4 International Model Outlooks

 Bureau of Meteorology summary of international model outlooks for NINO3.4: http://www.bom.gov.au/climate/model-summary/#tabs=Pacific-Ocean

   4 | Monthly Climate Bulletin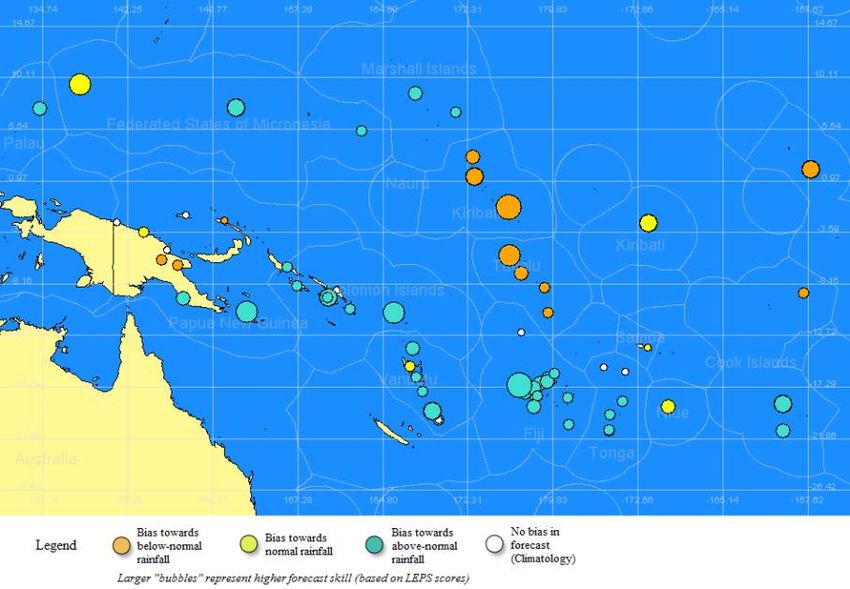
MADDEN–JULIAN OSCILLATION
Click link to access            Weekly Tropical Note [Issued on Tuesday 02 March 2021

The Madden-Julian Oscillation (MJO) is currently
weak and indiscernible. Equatorial Rossby (ER)
wave activity remains the dominant type of tropical
atmospheric wave in the Australian region. An ER
wave tracked westwards across Australian longi-
tudes last week, contributing to significant tropical
low and rainfall activity across the region, and
providing conditions favourable for the formation of
tropical cyclone Marian. The focus of ER wave ac-
tivity this week is currently around western Pacific
Ocean longitudes, but is expected to track further
west in the coming days before weakening. Climate
models indicate a pulse of the MJO is expected to
develop and move east over the tropical Americas
and Africa in the coming fortnight. At this time of the
year, an MJO pulse in these regions is typically as-
sociated with below-average rainfall across north-
ern Australia and the Maritime Continent.

This is an abbreviated version of the Weekly Tropi-
cal Note. Click on the Weekly Tropical for more in-
formation

 5 | Monthly Climate Bulletin
WIND
Click link to access            Wind plots link

The trade-winds were averaged over February, but were stronger than normal across the equa-
torial Pacific, especially around the Date Line.
During La Niña events, there is a sustained strengthening of the trade winds across much of
the tropical Pacific, while during El Niño events there is a sustained weakening, or even rever-
sal, of the trade winds.

 6 | Monthly Climate Bulletin
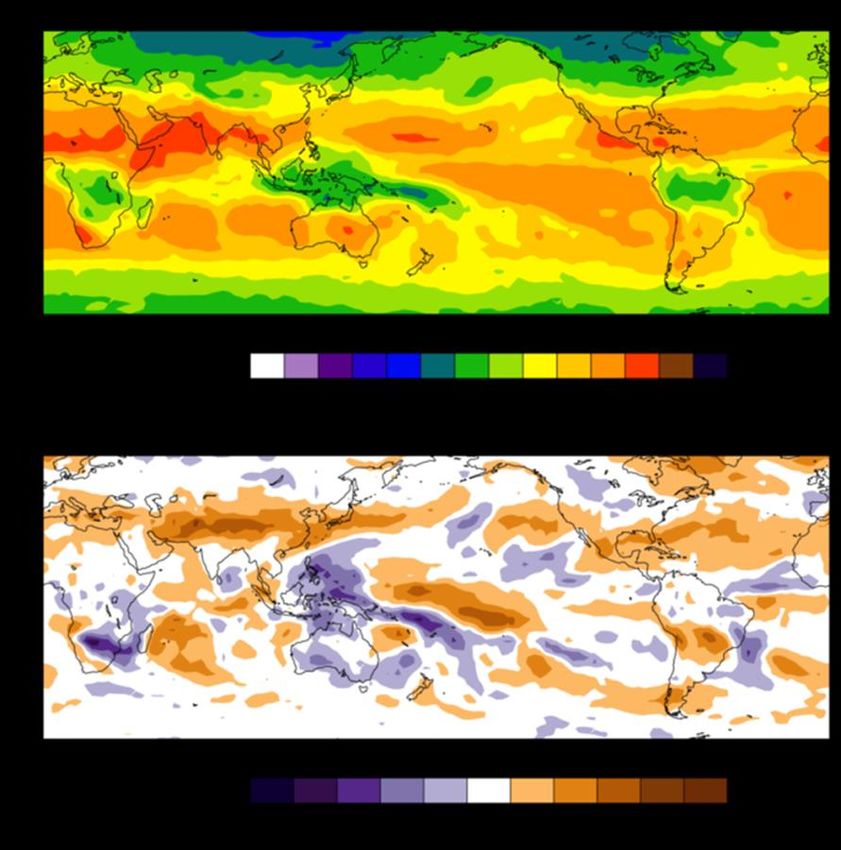
CLOUD AND RAINFALL
Click link to access            OLR

The February 30-day OLR total and anomaly maps suggest the Intertropical Convergence Zone
(ITCZ) was less active than normal. The South Pacific Convergence Zone (SPCZ) on the other
hand, was active and shifted southeastwards over Fiji, Samoa, Tonga and Niue.

Note: Global maps of OLR below highlight regions experiencing increased or decreased cloudi-
ness. The top panel is the total OLR in Watts per square metre (W/m 2) and the bottom panel is
the anomaly (current minus the 1979-1998 climate average), in W/m2. In the bottom panel, neg-
ative values (blue shading) represent above normal cloudiness while positive values (brown
shading) represent below normal cloudiness.

                    OLR Total and Anomalies, 30 Day OLR

 7 | Monthly Climate Bulletin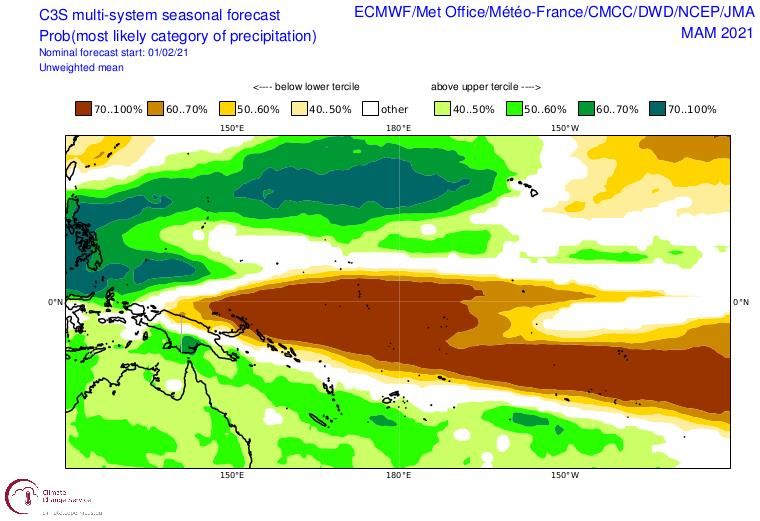
OLR Total and Anomalies, 7 Day OLR

8 | Monthly Climate Bulletin
30-Day Rainfall Anomalies

NOAA Climate Prediction Centre - NCEP CMAP precipitation:
https://ww.cpc.ncep.noaa.gov/products/Global_Monsoons/Global-Monsoon.shtml

9 | Monthly Climate Bulletin
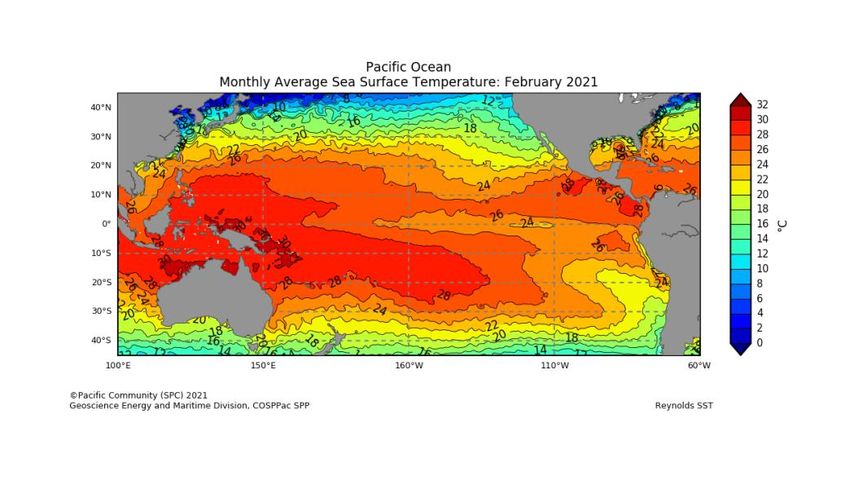
OCEAN CONDITIONS
SEA SURFACE TEMPERATURE
Click link to access Pacific Community COSPPac Ocean Portal
The SST anomaly pattern in February continued to show the classic La Niña shape, with below
average temperatures prevailing along the equator up to the north of PNG. The usual boomer-
ang shape of above average temperatures surrounding the cool equatorial anomalies had a sec-
tion that now showed cooler than average anomalies centred around Fiji due to the cyclone and
storm activity seen in this region in recent weeks. Highest anomalies were experienced by
southern Cook Islands which saw an increase of temperature by 2 degrees from a marine heat-
wave persisting to the south. Similarly, southern Vanuatu, PNG and countries in the west Pacific
namely FSM and Palau experienced warmer conditions with anomalies of 1.0 to 1.5 degrees.
Kiribati group continued to experience cooler anomalies getting as low as 1.0 to 1.5 degree be-
low normal.
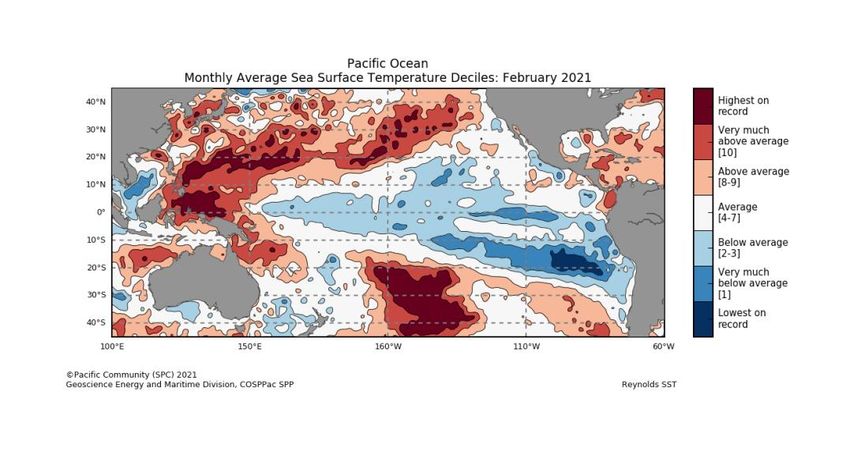
In terms of the deciles, regions of Highest-on-Record for February occurred in much of Palau,
FSM, PNG,and some parts of Cook Islands, with very low much below average at Solomon Is-
lands and Vanuatu. Regions of above average to very much above average (deciles 8-10) SSTs
spanned RMI, Tonga and Niue. In contrast, below average to very much below average (decile
1-3) SSTs were observed in Nauru, Kiribati, and Fiji-particularly around Vanua Levu where re-
gion of lowest on record is persisting.
Mean Sea Surface Temperature
10 | Monthly Climate BulletinOCEAN CONDITIONS
Click link to access SEA SURFACE TEMPERATURE
Anomalous Sea Surface Temperature
Sea Surface Temperatures Deciles
11 | Monthly Climate BulletinOCEAN CONDITIONS
SUB SURFACE
The four-month sequence of equatorial Pacific sub-surface temperature anomalies (to 05
March) shows cooler than average water extending across the top 150 m of the sub-surface of
the equatorial Pacific east of around 160°E. The strength and spatial extent of cooler than aver-
age water has remained similarly strong in February and January, but now shows signs of
weakening. Warm anomalies persist across large parts of the column depth west of the Date
Line, however these also look to be weakening from the previous month.
Weekly Temperatures Mean and Anomalies Monthly Temperatures Anomalies
Bureau of Meteorology Sea Temperature Analy-
sis: http://www.bom.gov.au/marine/sst.shtml
TAO/TRITON Data Display: http://www.pmel.noaa.gov/tao/jsdisplay/
12 | Monthly Climate BulletinOCEAN CONDITIONS
CORAL BLEACHING
The daily Coral Bleaching Alert for 05 March 2021 shows 'Watch' for much of the COSPPac partner coun-
tries, peaking at Alert Level 1 and 2 just east of PNG and parts of southern Solomon Islands, Vanuatu, Fiji
and Cook Islands. The four weeks Coral Bleaching Outlook to 29th March shows the 'Watch' alert continu-
ing for most of the countries in the region with PNG, Solomon Islands, Vanuatu and Cook Islands on alert
level 1 and 2.
Daily Coral Bleaching Alert
(Source: Pacific Community COSPPac Ocean Porta Coral Bleaching)
4-Weeks Coral Bleaching Outlook
(Source: Pacific Community COSPPac Ocean Portal)
13 | Monthly Climate BulletinOCEAN CONDITIONS
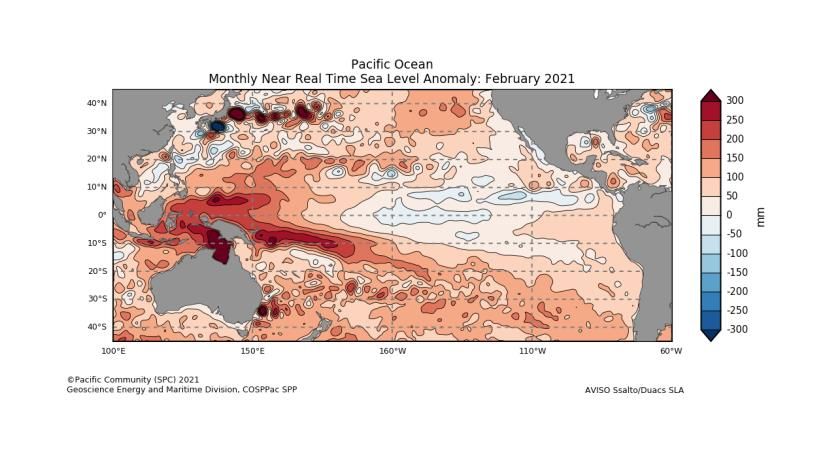
OCEAN SURFACE CURRENTS AND SEA LEVEL
OCEAN SURFACE CURRENTS AND SEA LEVEL
Sea level was above normal for most of the western Pacific region. The distinct boomerang shape was still
present with highest anomalies above 200mm above average spanning from Palau and FSM, across PNG,
through Solomon Islands, Tuvalu, and Samoa. Marshall Islands, Nauru, and Cook Islands were also above
average from 100 mm to 200 mm.
Ocean Surface Current (Last 7-Days)
Monthly Sea Level Anomalies
Source: Pacific Community COSPPac Ocean Portal
14 | Monthly Climate BulletinMEAN SEA LEVEL PRESSURE
The February mean sea level pressure (MSLP) anomaly map shows negative anomalies over
New Caledonia, Vanuatu, Fiji and east of about 170° in the tropical Pacific.
Areas of above (below) average MSLP usually coincide with areas of suppressed (enhanced) con-
vection and rain throughout the month.
Mean
Anomalous
Bureau of Meteorology South Pacific Circulation Patterns: http://www.bom.gov.au/cgi-bin/
climate/cmb.cgi?variable=mslp&area=spac&map=anomaly&time=latest
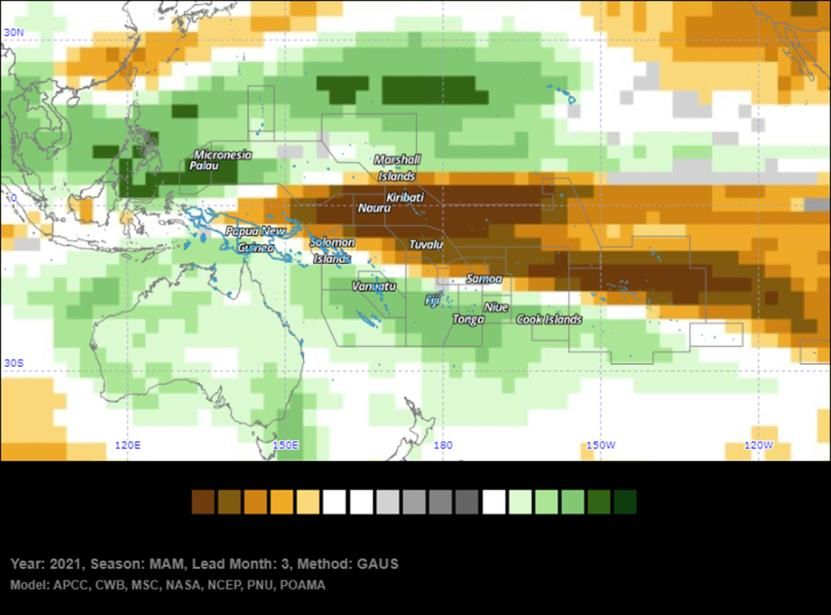
15 | Monthly Climate BulletinSEASONAL RAINFALL OUTLOOK
March—May 2021
The ACCESS-S model forecast for March 2021 strongly favours below normal rainfall for northern PNG, most of Sol-
omon Islands, Nauru, Kiribati, Tuvalu, Tokelau, northern Tonga, Samoa, Niue, the northern Cook Islands and parts
of northern French Polynesia. Above normal rainfall is favoured in Palau, FSM, northern and central Marshall Is-
lands, New Caledonia, central and southern Vanuatu and parts of southern French Polynesia. The three-month rain-
fall outlook (March-May) is very similar to the March pattern: it shows a strong dry signal along the equator, sur-
rounded by bands of increased chance wetter in both hemispheres. Note the very strong gradient in probabilities as
you transition from drier to wetter in both hemispheres especially the northern. Above normal maximum and mini-
mum temperatures are favoured for many COSPPac countries, except for areas close to the equator east of 160°E,
namely Nauru, Kiribati, northern Tuvalu, Tokelau, northern Cook Islands and northern and central French Polynesia
where near-normal to below normal temperatures are favoured.
Monthly ACCESS-S Maps
The Copernicus multi-model outlook for March to May favours below normal rainfall for northern PNG, Solomon Is-
lands, Nauru, Kiribati, Tuvalu, Tokelau, Samoa, northern and central Cook Islands, and northern and central French
Polynesia. Above normal rainfall is favoured for Palau, southern PNG, New Caledonia, Vanuatu, southern parts of
Fiji, southern Tonga, Niue and southern Cook Islands.
The SCOPIC statistical model for March to May favours below normal rainfall for northern PNG, west and east Kiri-
bati, Tuvalu, and northern Cook Islands. Above normal rainfall is favoured for Palau, central and eastern FSM, Mar-
shall Islands, the southern region of PNG, Solomon Islands, Vanuatu, Fiji, central and southern Tonga, and southern
Cook Islands.
The APEC Climate Centre multi-model for March to May favours below normal rainfall for eastern FSM, far southern
Marshall Islands, northern PNG, western and eastern Solomon Islands, Nauru, Tuvalu, Kiribati, Tokelau, Samoa,
northern Cook Islands and French Polynesia. Above normal rainfall is favoured for Palau, western and central FSM,
southern PNG, central Solomon Islands, New Caledonia, Vanuatu, Fiji, Tonga, Niue, central and southern Cook Is-
lands and parts of southern French Polynesia.
For March to May 2021, the dynamical models (as well as SCOPIC) agree on above normal rainfall for Palau, FSM,
central to northern Marshall Islands, areas in Southern Regions of PNG, New Caledonia, Vanuatu, Fiji, Tonga,
southern Cook Islands and southern French Polynesia. The models also agree on below normal rainfall for northern
PNG, Nauru, Kiribati, Tuvalu, Tokelau, northern Cook Islands and central and northern French Polynesia.
16 | Monthly Climate BulletinSEASONAL TEMPERATURE OUTLOOK
March—May 2021
Monthly ACCESS-S Maps
17 | Monthly Climate BulletinSEASONAL RAINFALL OUTLOOK
March—May 2021
Seasonal ACCESS-S maps
SCOPIC
‘About SCOPIC’ www.pacificmet.net/project/climate-
and-ocean-support-program-pacific-cosppac
18 | Monthly Climate BulletinSEASONAL RAINFALL OUTLOOK
March—May 2021
Copernicus (C3S multi-system)-Rainfall
Copernicus Rainfall:https://climate.copernicus.eu/charts/
APEC Climate Information Toolkit for the Pacific: http://clikp.sprep.org/
19 | Monthly Climate BulletinTROPICAL CYCLONE
2020/2021 Season
There were eight (8) Tropical Depression (TD) where 5 TD's The tropical cyclone season outlook for 2020-21
intensified into Tropical Cyclone (TC's) namely TC Yasa is available via: http://www.bom.gov.au/
(Category 5), TC Zasu (Category 2), TC Ana (Category 2), TC
climate/cyclones/south-pacific/
Bina (Category 1) and TC Lucas (Category 2). ACCESS-S Weekly Forecasts –Northwest Pacific
The weekly tropical cyclone forecast from ACCESS-S model
shows low risk in the week ending 19 March 2021 for the
southwest Pacific; especially areas in between Vanuatu and
the Coral Sea region. Low tropical cyclone risk for the north-
west Pacific.
The tropical cyclone season outlook for 2020-21 is available
via: http://www.bom.gov.au/climate/cyclones/south-pacific/
ACCESS-S Weekly Forecasts –Southwest Pacific
Individual Model Links
UKMO Global long-range model probability maps: http://
www.metoffice.gov.uk/research/climate/seasonal-to-decadal/gpc-outlooks/
glob-seas-prob
ECMWF Rain (Public charts) - Long range forecast: http://www.ecmwf.int/en/
forecasts/charts/seasonal/rain-public-charts-long-range-forecast
POAMA Pacific Seasonal Prediction Portal: http://poama.bom.gov.au/
experimental/pasap/index.shtml
APEC Climate Center (APCC): http://www.apcc21.org/eng/service/6mon/ps/
japcc030703.jsp
NASA GMAO GEOS-5:http://gmao.gsfc.nasa.gov/research/ocean/
NOAA CFSv2:http://www.cpc.ncep.noaa.gov/products/CFSv2/
CFSv2seasonal.shtml
IRI for Climate and Society: http://iri.columbia.edu/our-expertise/climate/
forecasts/seasonal-climate-forecasts/
20 | Monthly Climate BulletinOTHER INFORMATION
Southern Oscillation Index
The Southern Oscillation Index, or SOI, gives an indication of the development and intensity of El Niño and
La Niña events across the Pacific Basin. The SOI is calculated using the difference in air pressure between
Tahiti and Darwin. Sustained negative values of the SOI below −7 often indicate El Niño episodes. These
negative values are usually accompanied by sustained warming of the central and/or eastern tropical Pacific
Ocean, and a decrease in the strength of the Pacific Trade Winds. Sustained positive values of the SOI
greater than +7 are typical of La Niña episodes. They are associated with stronger Pacific Trade Winds and
sustained cooling of the central and eastern tropical Pacific Ocean. In contrast, ocean temperatures to the
north of Australia usually become warmer than normal.
Multivariate ENSO Index (MEI)
The Climate Diagnostics Center Multivariate ENSO Index (MEI) is derived from a number of parameters
typically associated with El Niño and La Niña. Sustained negative values indicate La Niña, and sustained
positive values indicate El Niño.
20 degrees Celsius Isotherm Depth
The 20°C Isotherm Depth is the depth at which the water temperature is 20°C. This measurement is im-
portant, as the 20°C isotherm usually occurs close to the thermocline, the region of most rapid change of
temperature with depth, or the division between the mixed surface layer and deep ocean. A deeper than
normal 20°C isotherm (positive anomaly) implies a greater heat content in the upper ocean, whilst a shal-
lower 20°C isotherm (negative anomaly) implies a lower than normal heat content in the upper ocean.
Regions
SST measurements may refer to the NINO1, 2, 1+2, 3, 3.4 or 4 regions. These descriptions simply
refer to the spatially averaged SST for the region described. The NINO regions (shown in the figure
below) cover the following areas:
Region Latitude Longitude
NINO1 5-10°S 80-90°W
NINO2 0-5°S 80-90°W
NINO3 5°N to 5°S 150-90°W
NINO3.4 5°N to 5°S 120-170°W
NINO4 5°N to 5°S 160°E to 150°W
NOTE: NINO1+2 is the combined areas 1 and 2
21 | Monthly Climate BulletinYou can also read