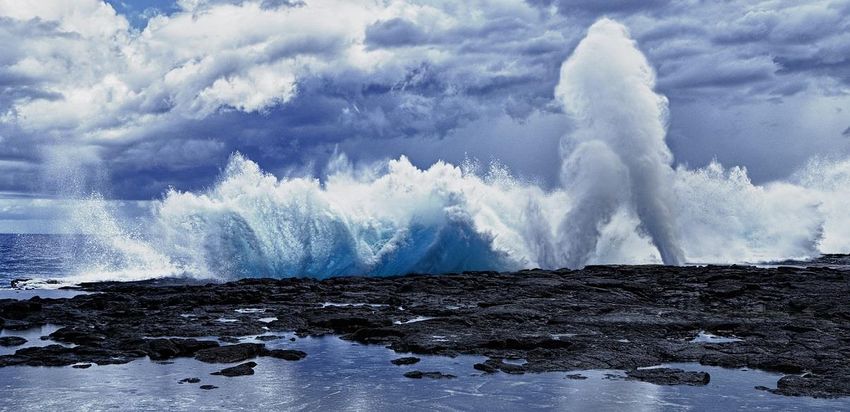
Monthly Climate Bulletin - October 2020 - ISSN: 2617-3565 Photo Credit: S. Chape (Savaii, Samoa Blowholes) - Sprep
←
→
Page content transcription
If your browser does not render page correctly, please read the page content below
Monthly Climate Bulletin
October 2020

                                              ISSN: 2617-3565
               Photo Credit: S. Chape (Savaii, Samoa Blowholes)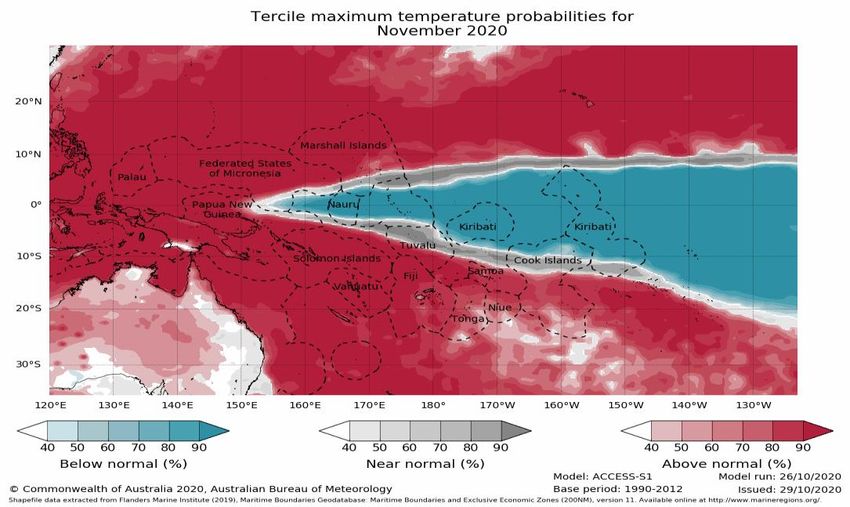
CONTENTS

Summary                        2
El Niño–Southern Oscillation   3
Madden–Julian Oscillation      4
Wind                           5
Cloud and Rainfall             6
Oceanic Conditions             9
Mean Sea Level Pressure        13
Model Outlooks                 14
Cyclones                       17
Further Information            18

1 | Monthly Climate Bulletin
SUMMARY
Issued 06 November 2020

•     La Niña continues in the tropical Pacific. Australian and international climate mod-
      els suggest it is likely to continue at least into February 2021.
•     The Intertropical Convergence Zone (ITCZ) was shifted to the north, while the
      South Pacific Convergence Zone (SPCZ) was more active east of Fiji.
•     A weakening pulse of the Madden-Julian Oscillation (MJO) is currently located over
      the tropical central Pacific Ocean with most climate models suggest it will weaken
      in strength while moving eastwards towards the tropical Americas in the coming
      week.
•     Sea level in October was higher than normal for most countries in the region, with
      positive anomalies (15-25cm) situated around Palau, FSM, RMI, and the far north of
      eastern Kiribati, while smaller patches of +15 to +20cm anomalies occurred
      around the northern PNG, Solomon Islands, Vanuatu, Fiji and Tonga. Sea level in
      the central to eastern equatorial Pacific was lower in October than September.
•     Coral Bleaching Alert is on Alert Level 2 in the western and central part of FSM
      while areas of Alert Level 1 exist around FSM and eastern Palau. The Coral Bleach-
      ing Outlook shows the region of Alert Level 2 remaining similar over FSM, with
      Alert 1 expanding in Palau, the northern PNG coast and parts of the far northwest
      Solomon Islands. The rest of northern PNG, the Solomon Islands, central and south-
      ern RMI, Tuvalu, northern Fiji and Samoa are on Warning and Watch alert, while re-
      maining south-west Pacific countries are rated as 'no stress'.
•     For November 2020 to January 2021, the dynamical models (as well as SCOPIC)
      agree on above normal rainfall for Palau, southern Marshall Islands, most parts of
      PNG, Solomon Islands, New Caledonia, Vanuatu, Fiji, Tonga, Samoa, Niue, southern
      Cook Islands and southern French Polynesia. The models also agree on below nor-
      mal rainfall for northern Marshall Islands, northern PNG, Nauru, Kiribati, Tuvalu,
      northern Cook Islands and central and northern French Polynesia.

    © SPREP 2020
    This copyright statement protects our work from commercial exploitation, while ensuring that the information can be freely used for scien-
    tific, educational or research purposes, provided SPREP and the source document are acknowledged.

    2 | Monthly Climate Bulletin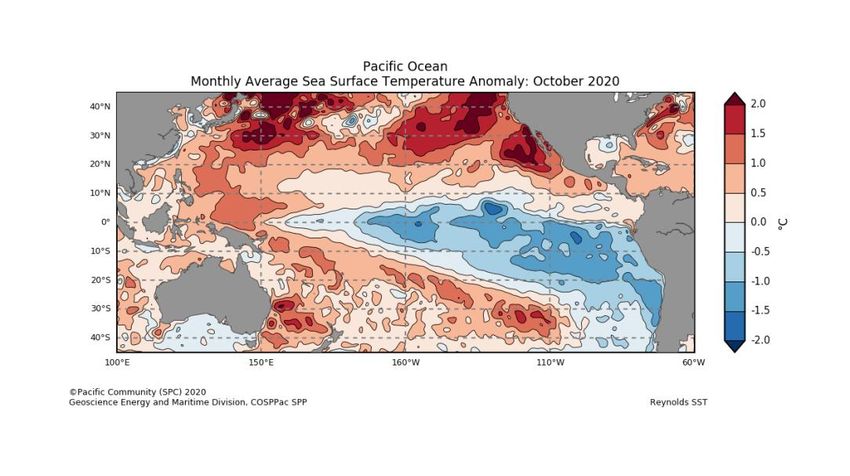
EL NIÑO–SOUTHERN OSCILLATION
La Niña likely to continue until at least the end of summer 2020-21

Click link to access    Climate Driver Update issued on 27 October 2020

La Niña continues in the tropical Pacific. Australian and international climate models suggest it is
likely to continue at least into February 2021.
Central and eastern tropical Pacific Ocean sea surface temperatures remain at La Niña levels, as
do most atmospheric indicators, including trade winds and cloudiness. The Southern Oscillation
Index (SOI) has moved back into neutral values, most likely due to the influence of a passing
MJO event. The SOI is expected to return to La Niña levels in the coming weeks.
La Niña typically increases the chance of above average rainfall across much of western Pacific
countries during summer. Current climate outlooks indicate rainfall during November 2020 to
January 2021 is likely to be above average for off-equatorial Western Pacific countries from Pa-
lau east to central RMI and from central and southern Papua New Guinea southeast through the
Solomon Islands, New Caledonia, Vanuatu, Fiji, Tonga, Niue, southern Cook Islands to the Tubai
Islands in French Polynesia.
Most models suggest La Niña will peak in December, with around half the models anticipating a
strong event. While there is some possibility that the peak strength could reach levels similar to
2010-12 there are some differences. La Niña became established much earlier in 2010, was long
lived (over two years), and impacts were enhanced by a negative Indian Ocean Dipole and warm
ocean temperatures around Australia.
In contrast, the Indian Ocean Dipole (IOD) is currently neutral, and most models suggest it will
remain neutral for the rest of 2020.
The Madden-Julian Oscillation (MJO) is currently in the western Pacific and is expected to re-
main moderately strong as it moves across the Pacific basin, then decrease in strength as it ap-
proaches Africa.
The 30-day Southern-Oscillation Index (SOI) for the 30 days ending 25 October was +5.4. The
90-day value is also above La Niña threshold at +7.4.

 3 | Monthly Climate Bulletin
EL NIÑO–SOUTHERN OSCILLATION
 La Niña likely to continue until at least the end of summer 2020-21

 Click link to access             Climate Driver Update issued on 27 October 2020

Bureau of Meteorology NINO3.4 ENSO Model Outlooks for November, January and March

                 Bureau of Meteorology NINO3.4 International Model Outlooks

 Bureau of Meteorology summary of international model outlooks for NINO3.4: http://www.bom.gov.au/climate/model-summary/#tabs=Pacific-Ocean

   4 | Monthly Climate Bulletin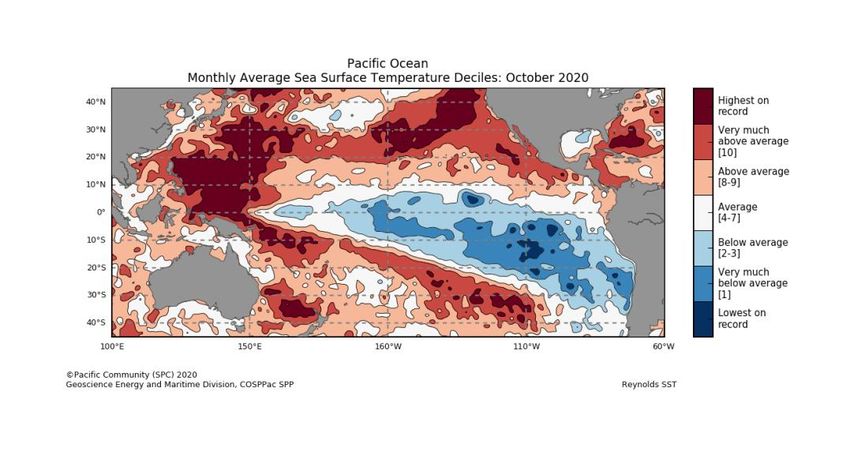
MADDEN–JULIAN OSCILLATION
Click link to access            Weekly Tropical Note [Issued on Tuesday 03 November 2020

A weakening pulse of the Madden-Julian Oscillation
(MJO) is currently located over the tropical central
Pacific Ocean, east of the Date Line. This pulse is
moderately strong but most climate models suggest
it will weaken in strength while moving eastwards
towards the tropical Americas in the coming week.
An MJO pulse in the central Pacific region would
typically enhance rainfall across parts of western
Pacific at this time of the year. The influence of the
MJO on western Pacific countries reduces consid-
erably as it moves further east towards the Ameri-
cas.

This is an abbreviated version of the Weekly Tropi-
cal Note. Click on the Weekly Tropical for more in-
formation

 5 | Monthly Climate Bulletin
WIND
Click link to access            Wind plots link

The equatorial trade winds in the 5-day snapshot ending 01 November shows strengthened
trade winds across the western to central equatorial Pacific and near-normal trade winds further
east. For October, the TAO/TRITON data show slightly enhanced trade winds across the cen-
tral and western equatorial Pacific
During La Niña events, there is a sustained strengthening of the trade winds across much of
the tropical Pacific, while during El Niño events there is a sustained weakening, or even rever-
sal, of the trade winds.

 6 | Monthly Climate Bulletin
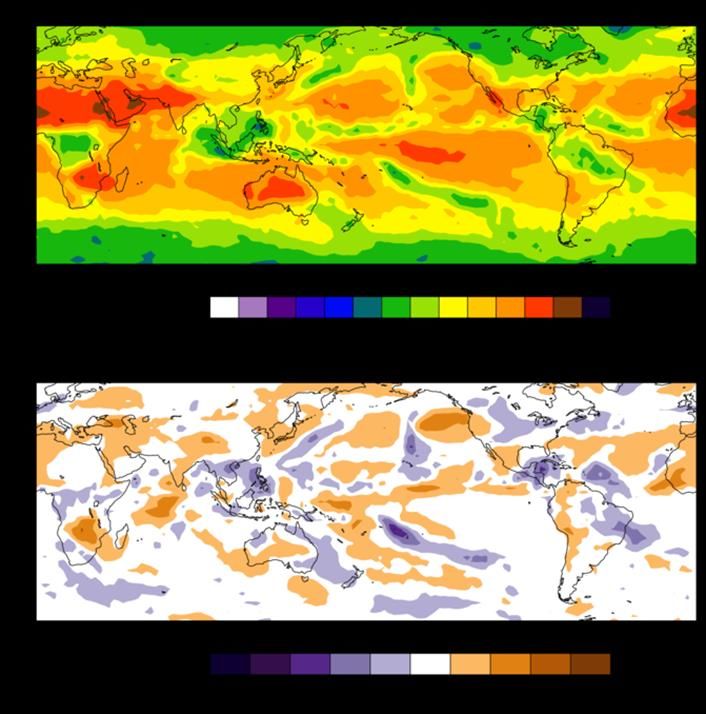
CLOUD AND RAINFALL
Click link to access            OLR

The October 30-day OLR total and anomaly maps suggest the Intertropical Convergence Zone
(ITCZ) was stronger than normal and shifted north in the western Pacific. However, the South
Pacific Convergence Zone (SPCZ) was not active over PNG and Solomon Islands, while a por-
tion of the SPCZ was active over Fiji, Tonga, Samoa, Niue and southern Cook Islands which
may result in higher rainfall over these countries.
 Note: Global maps of OLR below highlight regions experiencing increased or decreased cloudi-
ness. The top panel is the total OLR in Watts per square metre (W/m 2) and the bottom panel is
the anomaly (current minus the 1979-1998 climate average), in W/m2. In the bottom panel, neg-
ative values (blue shading) represent above normal cloudiness while positive values (brown
shading) represent below normal cloudiness.

                    OLR Total and Anomalies, 30 Day OLR

 7 | Monthly Climate Bulletin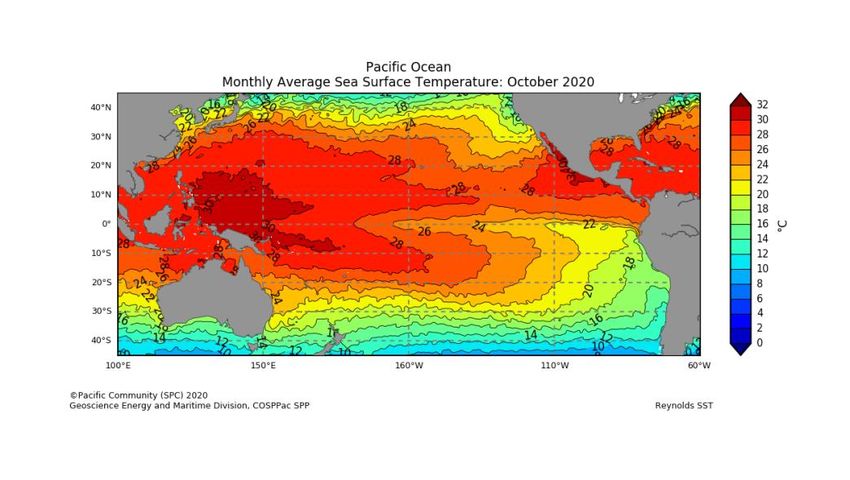
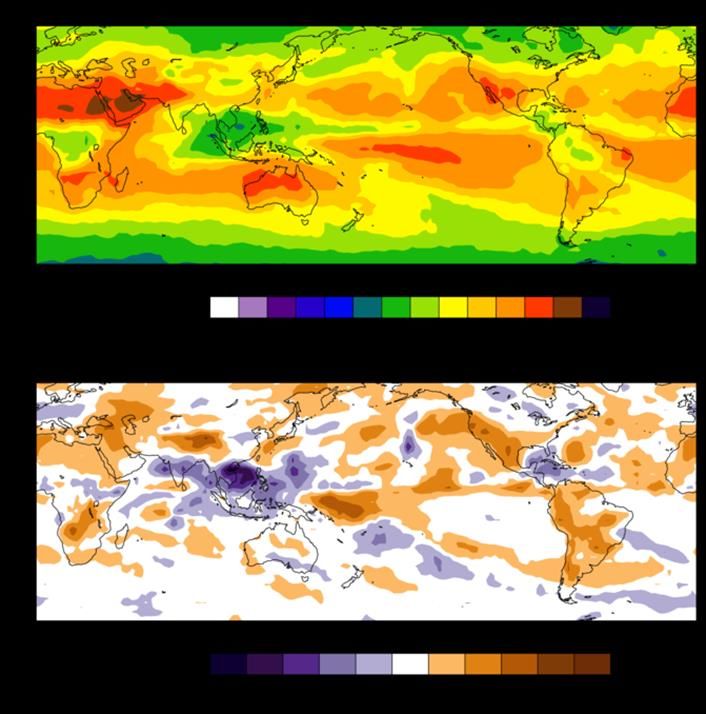
OLR Total and Anomalies, 7 Day OLR

8 | Monthly Climate Bulletin
30-Day Rainfall Anomalies

NOAA Climate Prediction Centre - NCEP CMAP precipitation:
https://ww.cpc.ncep.noaa.gov/products/Global_Monsoons/Global-Monsoon.shtml

9 | Monthly Climate Bulletin
OCEAN CONDITIONS
SEA SURFACE TEMPERATURE
Click link to access            Pacific Community COSPPac Ocean Portal

Sea surface temperatures (SSTs) for October show a cooling trend in the central and western
tropical Pacific Ocean compared with September, consistent with the evolving La Niña. Cool
SST anomalies were observed near the equator from 170°E eastwards to South America. Cool
anomalies also covered most of the southern tropics east of about 130°W, but in the northern
hemisphere they only reached about 10° north. In COSPPac countries, the Line Islands of the
Kiribati group experienced the strongest negative anomalies of about 1.5 degree. Nauru and
parts of PNG, New Caledonia, Fiji, Tonga, Niue, Cook Islands and northern French Polynesia
also experienced below average ocean temperatures.

SSTs were 0.5 to 1.5 degrees above normal across remaining COSPPac countries, especially in
the north-western Pacific around Palau, FSM, northern PNG, Solomon Islands, Vanuatu, Fiji and
French Polynesia. In terms of the deciles, regions of Highest-on-Record for October occurred in
much of Palau, FSM, and in parts of PNG, Solomon Islands, Vanuatu, northern Fiji, Samoa,
Cook Islands and French Polynesia EEZs. Regions of above average to very much above aver-
age (deciles 8-10) SSTs also spanned across the same countries, as well as RMI, south and
central Tuvalu, Tonga and Niue. In contrast, below average (decile 2-3) SSTs were observed in
Nauru and Kiribati, particularly the east where a small region of decile 1 to lowest on record was
analysed. Deciles 2 and 3 also occurred in the north of the Cook Islands EEZ.

                            Mean Sea Surface Temperature

10 | Monthly Climate Bulletin
OCEAN CONDITIONS
Click link to access SEA SURFACE TEMPERATURE
Anomalous Sea Surface Temperature
Sea Surface Temperatures Deciles
11 | Monthly Climate BulletinOCEAN CONDITIONS
SUB SURFACE
The Bureau of Meteorology's four-month sequence of equatorial sub-surface temperature
anomalies to (29 October), shows cool anomalies extending across the top 200 m of the sub-
surface of the equatorial Pacific from around the Date Line eastward across the basin. The
strength and extent of cool anomalies have increased month-on-month since July. Weak warm
anomalies persist across large parts of the column depth in the far western equatorial Pacific.
Weekly Temperatures Mean and Anomalies Monthly Temperatures Anomalies
Bureau of Meteorology Sea Temperature Analy-
sis: http://www.bom.gov.au/marine/sst.shtml
TAO/TRITON Data Display: http://www.pmel.noaa.gov/tao/jsdisplay/
12 | Monthly Climate BulletinOCEAN CONDITIONS
CORAL BLEACHING
The daily Coral Bleaching Alert for 01 November 2020 shows Alert Level 2 in the western and central part
of FSM while areas of Alert Level 1 exist around FSM and eastern Palau. Parts of Palau and northern PNG
are on Warning while other parts of PNG, RMI, Solomon Islands, Nauru, Tuvalu, parts of Kiribati and Toke-
lau are on Watch. The remainder of Pacific Island countries are in 'no stress'. The four weeks Coral Bleach-
ing Outlook to 22 November shows the region of Alert Level 2 remaining similar over FSM, with Alert 1 ex-
panding in Palau, the northern PNG coast and parts of the far northwest Solomon Islands. The rest of
northern PNG, the Solomon Islands, central and southern RMI, Tuvalu, northern Fiji and Samoa are on
Warning and Watch alert, while remaining south-west Pacific countries are rated as 'no stress'.
Daily Coral Bleaching Alert
(Source: Pacific Community COSPPac Ocean Porta Coral Bleaching)
4-Weeks Coral Bleaching Outlook
(Source: Pacific Community COSPPac Ocean Portal)
13 | Monthly Climate BulletinOCEAN CONDITIONS
OCEAN SURFACE CURRENTS AND SEA LEVEL
OCEAN SURFACE CURRENTS AND SEA LEVEL
The most recent 7-day ocean surface currents plot shows a stronger-than-normal westward-flowing Equato-
rial Current in the equatorial Pacific, with clear divergence along the equator, especially east of about 140°
W. The plot also shows an anomalous eddy field exists between 145°W and 135°W.
Sea level in October was higher than normal for most countries in the region, with positive anomalies (15-
25cm) situated around Palau, FSM, RMI, and the far north of eastern Kiribati, while smaller patches of +15
to +20cm anomalies occurred around the northern PNG, Solomon Islands, Vanuatu, Fiji and Tonga. Sea
level in the central to eastern equatorial Pacific was lower in October than September. Continued develop-
ment of the La Niña should see a further fall in equatorial sea-level anomalies.
Ocean Surface Current (Last 7-Days)
Monthly Sea Level Anomalies
Source: Pacific Community COSPPac Ocean Portal
14 | Monthly Climate BulletinMEAN SEA LEVEL PRESSURE
The October mean sea level pressure (MSLP) anomaly map shows negative anomalies east of
about 180° in the tropical Pacific. Positive anomalies were present in the southern sub-tropical Pa-
cific south of 20°S.
Areas of above (below) average MSLP usually coincide with areas of suppressed (enhanced) con-
vection and rain throughout the month.
Mean
Anomalous
Bureau of Meteorology South Pacific Circulation Patterns: http://www.bom.gov.au/cgi-bin/
climate/cmb.cgi?variable=mslp&area=spac&map=anomaly&time=latest
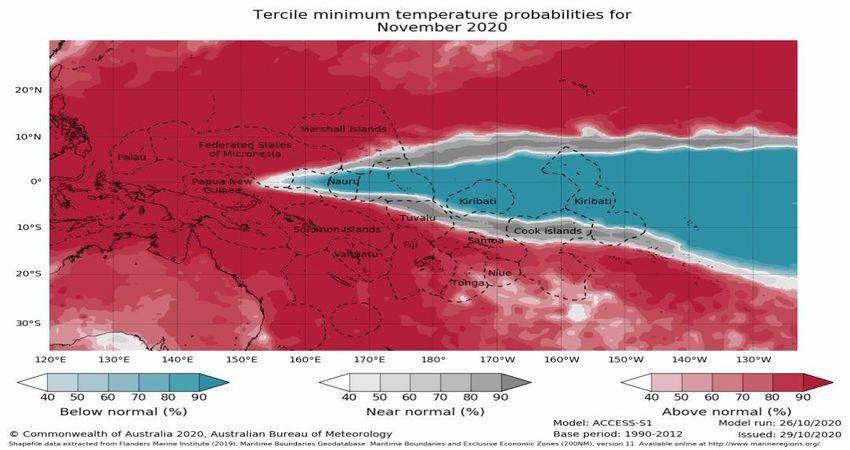
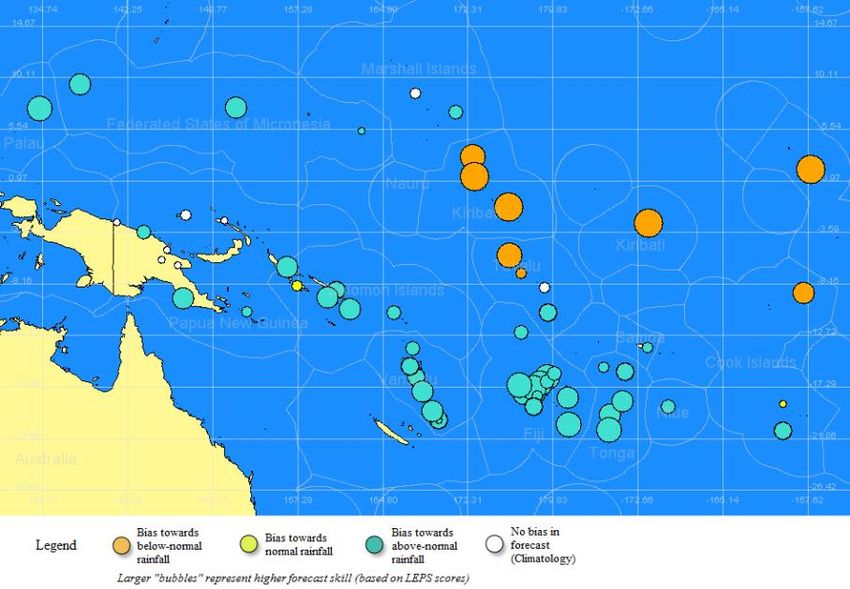
15 | Monthly Climate BulletinSEASONAL RAINFALL OUTLOOK
November 2020—January 2021
For November, the ACCESS-S model strongly favours below normal rainfall in a large wedge centred on the equator,
affecting Nauru, Kiribati, north and central Tuvalu, Tokelau, the northern Cook Islands and parts of central and north-
ern French Polynesia, while also extending as far west as the northernmost part of PNG. A small region more weakly
favouring below normal rainfall is evident in the northwestern Marshall Islands. Above normal rainfall is favoured in a
boomerang-shaped zone wrapping around the below normal wedge. Countries affected include Palau, FSM, central
Marshall Islands, most parts of PNG, Solomon Islands, New Caledonia, Vanuatu, Fiji, Tonga, Samoa, Niue and
southern Cook Islands. The three-month outlook (November-January) is similar outlook to that for November, except
for above normal rainfall extending over the southern half of RMI and below normal rainfall extending to the New
Guinea Islands and Samoa. The overall pattern is typical of La Niña. Above normal maximum and minimum tempera-
tures are favoured for all COSPPac countries, except for areas close to the equator east of 155°E, namely the far
southern Marshall Islands, Nauru, Kiribati, northern Tuvalu, Tokelau, northern Cook Islands and northern and central
French Polynesia where near-normal to below normal temperatures are favoured.
Monthly ACCESS-S Maps
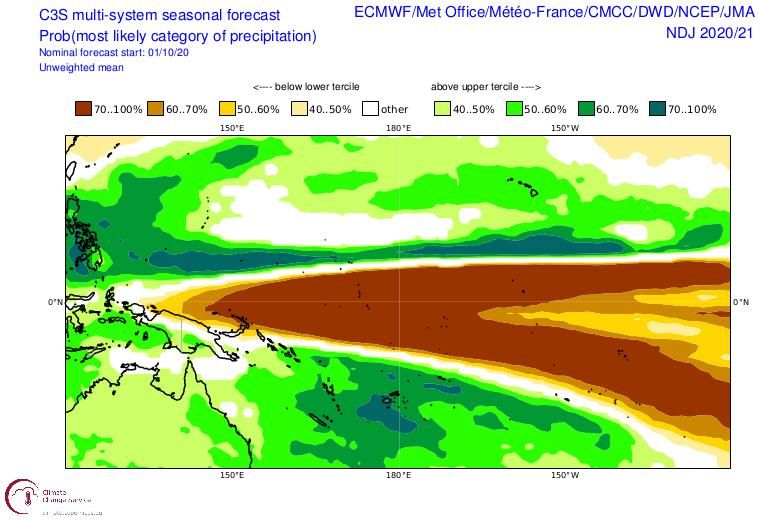
The Copernicus multi-model outlook for November to January favours below normal rainfall for the northern Momase
and New Guinea Islands region of PNG, Nauru, Kiribati, northern and central Tuvalu, Tokelau, northern Cook Islands
and northern and central French Polynesia. Above normal rainfall is favoured for Palau, parts of PNG, Solomon Is-
lands, New Caledonia, Vanuatu, Fiji, southern Tuvalu, Tonga, Samoa, Niue and southern Cook Islands.
The SCOPIC statistical model for November to January favours below normal rainfall for Kiribati, northern Tuvalu and
northern Cook Islands. Above normal rainfall is favoured for Palau, FSM, southern Marshall Islands, the southern re-
gion of PNG, Solomon Islands, Vanuatu, Fiji, southern Tuvalu, Tonga, Samoa, Niue and southern Cook Islands.
The APEC Climate Centre multi-model for November to January favours below normal rainfall for eastern FSM,
northern and far southern Marshall Islands, the northern Momase and New Guinea Islands regions of PNG, Nauru,
northern and central Tuvalu, Kiribati, Tokelau, northern Cook Islands and northern and eastern French Polynesia.
Above normal rainfall is favoured for Palau, western and central FSM, parts of PNG, Solomon Islands, New Caledo-
nia, Vanuatu, Fiji, Tonga, Samoa, Niue, central and southern Cook Islands and parts of southern French Polynesia.
For November 2020 to January 2021, the dynamical models (as well as SCOPIC) agree on above normal rainfall for
Palau, southern Marshall Islands, areas in the Highlands and Southern Regions of PNG, Solomon Islands, New Cale-
donia, Vanuatu, Fiji, Tonga, Niue, southern Cook Islands and southern French Polynesia. The models also agree on
below normal rainfall for northern Marshall Islands, the New Guinea Islands, Nauru, Kiribati, northern and central Tu-
valu, northern Cook Islands and central and northern French Polynesia.
16 | Monthly Climate BulletinSEASONAL TEMPERATURE OUTLOOK
November 2020—January 2021
Monthly ACCESS-S Maps
17 | Monthly Climate BulletinSEASONAL RAINFALL OUTLOOK
November 2020—January 2021
Seasonal ACCESS-S maps
SCOPIC
‘About SCOPIC’ www.pacificmet.net/project/climate-
and-ocean-support-program-pacific-cosppac
18 | Monthly Climate BulletinSEASONAL RAINFALL OUTLOOK
November 2020—January 2021
Copernicus (C3S multi-system)-Rainfall
Copernicus Rainfall:https://climate.copernicus.eu/charts/
APEC Climate Information Toolkit for the Pacific: http://clikp.sprep.org/
19 | Monthly Climate BulletinTROPICAL CYCLONE
2020/2021 Season
Tropical cyclone (TC) activity is expected to be near normal or The tropical cyclone season outlook for 2020-21
slightly below normal in the Southwest Pacific. There is the po- is available via: http://www.bom.gov.au/
tential for elevated levels of tropical cyclone activity as near
climate/cyclones/south-pacific/
New Caledonia, the Coral Sea, and northern Tasman Sea. The ACCESS-S Weekly Forecasts –Northwest Pacific
presence of warmer than normal ocean temperatures in the
western part of the region may contribute to the potential for
enhanced cyclone activity, along with the aforementioned dis-
placement of the SPCZ. Some island groups in the eastern part
of the region may experience reduced activity because of this
displacement. The long-term average is nine cyclones (east of
the tip of Cape York). There is the potential for elevated levels
of tropical cyclone activity in the western part of the basin, such
as near New Caledonia, the Coral Sea, and northern Tasman
Sea. Typhoon activity is expected to be normal or below normal
through December in the western North Pacific, although there
is an elevated risk for development into early November. The
above statement comes from the 2020 October Pacific Climate
Outlook Forum (PICOF-7) regional statement. Weekly tropical
cyclone forecast from ACCESS-S model show no cyclone risk
for the southwest Pacific while some risk for northwest Pacific
until 21 November 2020.
The tropical cyclone season outlook for 2020-21 is available ACCESS-S Weekly Forecasts –Southwest Pacific
via: http://www.bom.gov.au/climate/cyclones/south-pacific/
Individual Model Links
UKMO Global long-range model probability maps: http://
www.metoffice.gov.uk/research/climate/seasonal-to-decadal/gpc-outlooks/
glob-seas-prob
ECMWF Rain (Public charts) - Long range forecast: http://www.ecmwf.int/en/
forecasts/charts/seasonal/rain-public-charts-long-range-forecast
POAMA Pacific Seasonal Prediction Portal: http://poama.bom.gov.au/
experimental/pasap/index.shtml
APEC Climate Center (APCC): http://www.apcc21.org/eng/service/6mon/ps/
japcc030703.jsp
NASA GMAO GEOS-5:http://gmao.gsfc.nasa.gov/research/ocean/
NOAA CFSv2:http://www.cpc.ncep.noaa.gov/products/CFSv2/
CFSv2seasonal.shtml
IRI for Climate and Society: http://iri.columbia.edu/our-expertise/climate/
forecasts/seasonal-climate-forecasts/
20 | Monthly Climate BulletinOTHER INFORMATION
Southern Oscillation Index
The Southern Oscillation Index, or SOI, gives an indication of the development and intensity of El Niño and
La Niña events across the Pacific Basin. The SOI is calculated using the difference in air pressure between
Tahiti and Darwin. Sustained negative values of the SOI below −7 often indicate El Niño episodes. These
negative values are usually accompanied by sustained warming of the central and/or eastern tropical Pacific
Ocean, and a decrease in the strength of the Pacific Trade Winds. Sustained positive values of the SOI
greater than +7 are typical of La Niña episodes. They are associated with stronger Pacific Trade Winds and
sustained cooling of the central and eastern tropical Pacific Ocean. In contrast, ocean temperatures to the
north of Australia usually become warmer than normal.
Multivariate ENSO Index (MEI)
The Climate Diagnostics Center Multivariate ENSO Index (MEI) is derived from a number of parameters
typically associated with El Niño and La Niña. Sustained negative values indicate La Niña, and sustained
positive values indicate El Niño.
20 degrees Celsius Isotherm Depth
The 20°C Isotherm Depth is the depth at which the water temperature is 20°C. This measurement is im-
portant, as the 20°C isotherm usually occurs close to the thermocline, the region of most rapid change of
temperature with depth, or the division between the mixed surface layer and deep ocean. A deeper than
normal 20°C isotherm (positive anomaly) implies a greater heat content in the upper ocean, whilst a shal-
lower 20°C isotherm (negative anomaly) implies a lower than normal heat content in the upper ocean.
Regions
SST measurements may refer to the NINO1, 2, 1+2, 3, 3.4 or 4 regions. These descriptions simply
refer to the spatially averaged SST for the region described. The NINO regions (shown in the figure
below) cover the following areas:
Region Latitude Longitude
NINO1 5-10°S 80-90°W
NINO2 0-5°S 80-90°W
NINO3 5°N to 5°S 150-90°W
NINO3.4 5°N to 5°S 120-170°W
NINO4 5°N to 5°S 160°E to 150°W
NOTE: NINO1+2 is the combined areas 1 and 2
21 | Monthly Climate BulletinYou can also read