Advancing Statistical Development - SPC Prism
←
→
Page content transcription
If your browser does not render page correctly, please read the page content below
Advancing
                                                            Statistical
                                                            Development
tralia, Cook Islands, Federated States of Micronesia, Fiji, Kiribati, Nauru, New Zealand, Niue, Palau, Papua New Guinea, Republic of Marshal Islands, Samoa, Solom
ga, Tuvalu, and Vanuatu. Australia, Cook Islands, Federated States of Micronesia, Fiji, Kiribati, Nauru, New Zealand, Niue, Palau, Papua New Guinea, Republic of Marsh
moa, Solomon Islands, Tonga, Tuvalu, and Vanuatu. Australia, Cook Islands, Federated States of Micronesia, Fiji, Kiribati, Nauru, New Zealand, Niue, Palau, Papua Ne
public of Marshal Islands, Samoa, Solomon Islands, Tonga, Tuvalu, and Vanuatu. Australia, Cook Islands, Federated States of Micronesia, Fiji, Kiribati, Nauru, New Zea
au, Papua New Guinea, Republic of Marshal Islands, Samoa, Solomon Islands, Tonga, Tuvalu, and Vanuatu. Australia, Cook Islands, Federated States of Micronesia, F
auru, New Zealand, Niue, Palau, Papua New Guinea, Republic of Marshal Islands, Samoa, Solomon Islands, Tonga, Tuvalu, and Vanuatu. Australia, Cook Islands,
States of Micronesia, Fiji, Kiribati, Nauru, New Zealand, Niue, Palau, Papua New Guinea, Republic of Marshal Islands, Samoa, Solomon Islands, Tonga, Tuvalu, an
tralia, ok Islands, Federated States of Micronesia, Fiji, Kiribati, Nauru, New Zealand, Niue, Palau, Papua New Guinea, Republic of Marshal Islands, Samoa, Solomon Is
Tuvalu, and Vanuatu. Australia, Cook Islands, Federated States of Micronesia, Fiji, Kiribati, Nauru, New Zealand, Niue, Palau, Papua New Guinea, Republic of Marsh
moa, Solomon Islands, Tonga, Tuvalu, and Vanuatu. Australia, Cook Islands, Federated States of Micronesia, Fiji, Kiribati, Nauru, New Zealand, Niue, Palau, Papua Ne

                                                            in the
                                                            Pacific Island Region

                                                                         Secretariat of the Pacific Community
                                                                                 1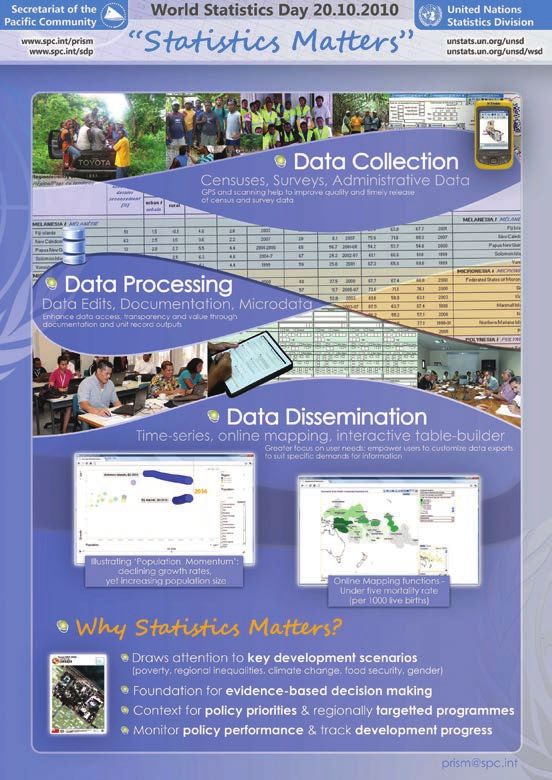
Advancing Statistical Development in the Pacific Island Region

                                                                             Partnership in action
                                                                               • Four agencies
                                                                               • Fifteen countries
                                                                               • Two statistical collections

                                                                             One common goal:
                                                                             Integrate agricultural questions in 2020
                                                                             word round of population and housing
                                                                             census operations

Regional Cooperation in Statistics

The importance of a regional approach to statistical development in the Pacific has been recognized by
Leaders of sixteen Pacific Island countries1 in the 2005 Pacific Plan – a regional strategy to strengthen
regional cooperation and integration across the region. With the key focus on enhancing and stimulating
economic growth, sustainable development, good governance and security, the importance of quality
statistics were recognized as essential to supporting informed decision making.
A second major stimulus contributing to closer statistical cooperation, was the explicit call to strive for
greater harmonization of statistical systems, standards and classifications. In terms of tangible and very
positive outcomes,
    • common statistical definitions and systems of data collection mean greater comparability of
       statistical information;
    • common core census and survey designs (including core questions and core modules) translate
       into greater efficiencies and costs-effectiveness of regional technical support and training;
    • common approaches help foster a regional statistical identity, and the consolidation of statistical
       subject-matter expertise over time means recognized specialists from some countries can assist
       smaller NSOs lacking such expertise, and thus contribute towards a virtual Pacific Statistical
       System.

 1. Including the Prime Ministers of Australia and New Zealand

                                                                 2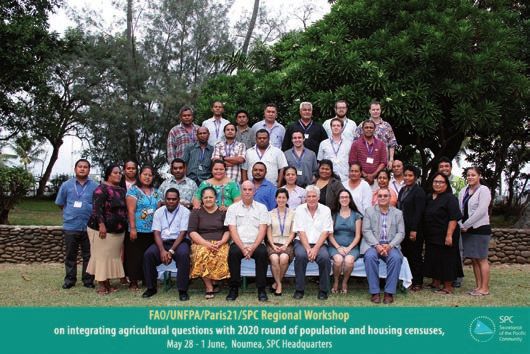
Access the TYPSS and associated Phase
                                                                          1 Pacific Statistics Strategy Action Plan
                                                                          2011-2014 at www.spc.int/sdd
                                                                          Core thematic areas, Phase 1:
                                                                            • Economics
                                                                            • Demography
                                                                            • Social Statistcs (Education, Health)
                                                                            • Vital Statistics/Civil Registration
                                                                          Covering full statistical life-cycle:
                                                                           • Data Collection
                                                                           • Data Processing
                                                                           • Data Dissemination

Ten-Year Pacific Statistics Strategy (TYPSS) 2011 – 2020

Developed as a blueprint for greater regional leadership of statistical developments and operations, TYPSS
provides a clear pathway for implementing priority actions over three distinct Phases:
Phase 1 (2011 – 2014) activities are guided by six strategic objectives, which are seen as essential to
setting out key principles and practices of the proposed Pacific island statistical system, with Pacific island
countries and territories
    • undertaking key statistical collections as scheduled
    • produce the agreed core set of statistics across sectors
    • have capacity or are accessing regional capacity to undertake agreed core and some specialists
       statistical functions;
    • improve data accessibility and utilization;
    • introduce new and innovative statistical tools and systems;
    • ensure that national and regional statistics governance is functioning effectively
Phase 2 (2015 – 2017) will focus on the implementation of region-wide statistical systems and tools;
the establishment of a regional centre of excellence in innovation in statistics and technology; advancing
policy agency relationships, and understanding in health, education, employment and environment; and
expanding the range of countries with economic accounts focused on timely GDP estimates.
Phase 3 (2018 – 2020) will ensure proposed statistical infrastructure will be adopted by all countries;
increase the cadre of Pacific island specialists; increase analytical reporting of official statistics; strengthen
capacity for regional policies to be monitored; broaden access to administrative records; look ahead to
innovations in initially established statistical infrastructures.

                                                        3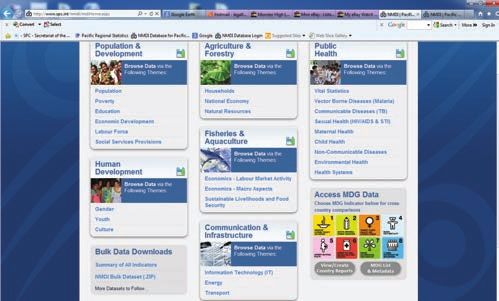
Advancing Statistical Development in the Pacific Island Region
Ten-Year Pacific Statistics Strategy (TYPSS) 2011 – 2020
Developed as a blueprint for greater regional leadership of statistical developments and operations, TYPSS
2013
provides a clear pathway for implementing priority actions over three distinct Phases:
THE MISSION OF THE SECRETARIAT OF THE PACIFIC COMMUNITY Latest available GDP pe
Phase 1 (2011 – 2014) activitiesOurare guided
mission byPacific
is to help six strategic
Island peopleobjectives, which
position themselves are seen as essentialselected
to respond to countries, in th
effectively to the challenges they face and make informed decisions about
setting out key principles and practices of and
their future thetheproposed Pacific
future they wish island
to leave for thestatistical system,
generations that follow. with Pacific island
PIB par habitant le plus
certains pays, en millie
POCKET STATISTICAL
countries and territories
SUMMARY LA MISSION DU SECRÉTARIAT GÉNÉRAL DE LA COMMUNAUTÉ DU PACIFIQUE Chiffres au format angl
Notre mission consiste à aider les peuples océaniens à surmonter
efficacement les obstacles qu’ils rencontrent et à prendre en toute 2012
• undertaking key statistical collections as scheduled
RÉSUMÉ STATISTIQUE connaissance de cause des décisions qui engageront leur propre avenir et
celui qu’ils souhaitent léguer aux générations futures. 2010
DE POCHE• produce the agreed core set of statistics across sectors
• have capacity or are accessing regional capacity to undertake agreed core and some specialists
2013 GENERAL CHARACTERISTICS 1
POPULATION CHARACTERISTICS 1
VITAL STATISTICS 1
statistical functions;
CARACTÉRISTIQUES GÉNÉRALES EN 2013 CARACTÉRISTIQUES DE LA POPULATION STATISTIQUES VITALES
• improve data accessibility and utilization;
COUNTRY/TERRITORY CBR CDR
Mid-year Density Growth Urban Dependency Median Youth % (‰) (‰) TFR IMR (‰) Life E
• introduce
PAYS / TERRITOIRE Land area
(km ) 2 new
estimateand
population
innovative
(persons/
km )
2 statistical
rate (%)
Taux de (%) tools and
Population Ratio (15 – systems;
59) Age (15 – 24) TBN TBM ISF TMI (‰) Espéranc
Rapport de Jeunesse (‰) (‰)
Superficie Estimation de la Densité crois- Population dépendance Âge
• ensure(km ) that
2
national
population en and regional
(habit-
millieu d’année ants/km ) 2
sance
(%)
statistics
urbaine
(%)
governance
(15 – 59) is functioning
médian %
(15 – 24) effectively Year Year Males/
Année Année Hommes
Phase 2 (2015
American Samoa 199 – 2017)
56,500 will
284focus -0.3
on the implementation
50 74 of 22.0
region-wide
19.8 statistical
25.9 4.8 systems
3.1 2010and
14.9 tools;
2010 69.3
the Islands
Cook establishment
237 of 15,200
a regional64 centre
-0.5of excellence
74 in71innovation
29.4 in statistics
16.1 18.1 and
7.9technology;
2.8 2011advancing
7.0 2006 – 12 p
73.6 p
Federated States of
policy agency 701
relationships,
103,000
and
147
understanding
0.3 22
in health,
67
education,
22.2
employment
21.0 23.8
and3.5environment;
5.3 2010 29.0
and2010 68.5 p
p p
Micronesia
Fiji 18,333 859,200 47 0.8 51 58 27.4 17.8 19.1 8.5 2.5 2007 19.0 2007 65.3
expanding the range of countries with economic accounts focused on timely GDP estimates.
Guam 541 174,900 323 0.3 94 59 29.8 17.6 18.7 6.4 3.0 2010 14.9 2010 71.1
PhaseKiribati3 (2018
811 – 2020)
108,800 will134ensure2.2proposed54 statistical
69 infrastructure
22.0 20.4 will be adopted
29.9 8.5 3.9 by all
2010countries;
45.0 2010 58.0
Marshall Islands 181 54,200 299 0.4 74 81 20.2 17.8 29.6 4.4 4.1 2011 26.3 2011 67.3
increase the cadre of Pacific island specialists; increase analytical reporting of official statistics; strengthen
Nauru 21 10,500 499 1.8 100 73 21.3 17.8 34.5 7.9 4.3 2009 – 11 33.0 2007 – 11 57.5
capacityNiue for 259
regional 1,500
policies to6 be monitored;
-0.2 n.a. broaden
74 access to administrative
35.1 12.9 13.2 12.5records; look
2.2 2006 – 11 ahead to–11
10.2 2006 66.1
innovations
Northern Mariana
Islands (CNMI)
in
457 initially established
55,600 122 statistical
-2.5 infrastructures.
90 48 34.9 15.1 14.8 3.5 2.2 2010 4.9 2006 – 08 73.5
Nouvelle-Calédonie 18,576 259,000 14 1.9 67 56 31.6 16.9 15.1 5.8 2.2 2007 6.1 2007 71.8
Palau 444 17,800 40 -1.9 77 48 36.2 14.7 13.6 8.6 1.7 2010 12.2 2010 66.3
Papua New Guinea 462,840 7,398,500 16 2.3 13 78 19.9 20.1 32.5 9.5 4.4 2002 – 06 56.7 2002 – 06 53.7
Pitcairn 47 60 n.a. n.a. n.a. n.a. n.a. n.a. n.a. n.a. n.a. n.a. n.a. n.a. n.a.
Polynésie française 3,521 261,400 74 1.8 51 50 29.6 18.3 16.6 5.3 2.1 2010 5.5 2010 72.0
Samoa 2,934 187,400 64 0.8 20 87 20.2 18.7 29.1 5.0 4.7 2011 15.6 2007 – 11 72.7
Solomon Islands 28,000 610,800 22 2.8 20 80 20.2 19.0 30.0 5.1 4.1 p 2007 – 09 26.0 p 2009 66.7 p
Tokelau 12 1,200 98 0.9 n.a. 76 25.0 18.8 15.3 7.6 2.1 2006 – 11 n.a. n.a. n.a.
Tonga 749 103,300 138 0.2 23 85 20.8 19.1 27.1 6.9 3.9 2011 17.0 2011 68.6
Tuvalu 26 10,900 420 1.1 47 71 24.1 18.8 24.7 9.0 3.7 p 2012 23.4 p 2010–12 64.8 p
Vanuatu 12,281 264,700 22 2.5 24 75 21.3 20.4 29.4 5.0 4.4 2009 21.0 2009 69.6
Wallis & Futuna 142 12,100 85 -2.1 n.a. 69 27.8 21.7 12.0 7.3 2.0 2008 5.2 2005 – 08 72.7
4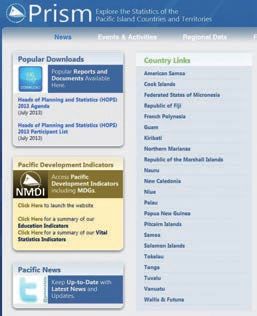
Symbols and abbreviations used: Symboles et abréviations utilisées :
n.a. not available n.a. non disponible
er capita for % percentage % pourcentage
housands USD ‰ per 1,000 ‰ pour 1000
p provisional figure p chiffre provisoire
s récent pour e estimate e estimation
r revised r corrigée
ers de $US.
CBR Crude Birth Rate (per 1,000 TBN taux brut de natalité (pour 1 000
lais. population) habitants)
CDR Crude Death Rate (per 1,000 TBM taux brut de mortalité (pour 1 000
population) habitants)
2011 IMR Infant Mortality Rate (per 1,000 TMI taux de mortalité infantile (pour
live births) 1 000 naissances vivantes)
2005 TFR Total Fertility Rate ISF indice synthétique de fécondité
1 Data from Pacific Island 1 Données du tableau de bord des
Populations 2013 fact sheet Polulations du Pacifique en 2013
GROSS DOMESTIC PRODUCT (GDP — in current price) CONSUMER PRICE OVERSEAS TRADE (thousands USD)
PRODUIT INTÉRIEUR BRUT (PIB — en prix courants) INDEX (annual % COMMERCE EXTÉRIEUR (milliers $US)
GOVERNMENT EXPENDI-
change)
TURE (per capita in USD)
INDICE DES PRIX
GDP (local DÉPENSES PUBLIQUES
Expectancy at Birth GDP Per capita À LA CONSOMMATION
currency in (par habitant en $US) Exports Imports
ce de vie à la naissance Currency thousands) (thousands (USD) Year (variations annuelles Year
USD) Par habit- en %) Exporta- Importa- Balance
Devise PIB (devise PIB (milliers ant Année Année
locale en tions tions
Females/ Year milliers) $US) ($US)
s Femmes 2009 2010 2011 2009 2010 2011
Année
75.9 2000 USD 615,000 615,000 9,333 2010 3,369 4,050 4,294 3.2 4.8 8.0 278,288 207,388 70,900 2011
79.6 p 2006 – 12 NZD 366,656 272,769 17,565 2011p 5,445 5,716 5,828 6.7 -0.3 2.2 2,943 102,411 -99,468 2011
72.0 p 2010 USD 310,213 310,213 3,031 2011p 1,741 1,945 1,979 3.8 3.7 6.9 36,919 188,081 -151,162 2011 p
69.6 2007 FJD 5,633,400 3,099,191 3,639 2011 p
813 827 1,211 3.7 5.5 8.7 1,054,272 2,151,759 -1,097,486 2011
76.1 2000 USD 4,577,000 4,577,000 25,420 2010 3,621 2,671 2,803 1.7 2.9 3.3 43,996 900,951 -856,955 2011
66.3 2010 AUD 167,592 170,542 1,651 2011 882 943 993 10.5 -4.0 2.6 8,478 90,468 -81,990 2011
72.6 2011 USD 173,700 173,700 3,158 2011 1,797 1,857 1,941 -1.7 1.8 5.4 65,300 175,800 -110,500 2011
63.2 2007 – 11 AUD 83,861 85,337 8,379 2010 – 11 3,349 2,014 2,337 7.6 -5.2 -1.2 49,755 14,540 35,216 2010
72.8 2006 – 11 NZD 30,724 22,857 15,807 2011 10,861 10,629 11,485 3.4 5.3 3.0 881 11,674 -10,793 2012
77.1 1999 – 01 USD 733,000 733,000 11,622 2010 2,666 n.a. n.a. 2.1 4.8 3.7 20 379,000 -378,980 2010
80.3 2007 XPF 812,100,000 9,093,963 36,405 2010 7,542 7,543 8,023 0.2 2.7 2.6 1,384,497 3,374,565 -1,990,067 2012
72.1 2001– 05 USD 212,903 212,903 10,314 2011 3,322 3,339 3,486 4.7 1.1 2.6 18,620 125,065 -106,445 2011
54.8 2000 USD 127,000,000 127,000,000 18,437 2011p n.a. n.a. 590 11.2 5.7 7.2 5,706,658 3,137,230 2,569,428 2008
n.a. n.a. NZD n.a. n.a. 3,385 2005 p n.a. n.a. 73,022 n.a. n.a. n.a. n.a. n.a. n.a. n.a.
76.6 2005 – 07 XPF 642,967,200 7,200,000 26,667 2011e 5,937 5,929 n.a. -0.8 1.7 1.8 161,308 1,725,221 -1,563,913 2011
75.6 2011 SAT 1,560,190 675,729 3,680 2012 904 1,105 1,033 6.3 0.8 5.2 76,325 343,009 -266,684 2012
73.7 p 2009 SBD 6,395,840 927,390 1,676 2012 n.a. n.a. n.a. 1.8 0.8 9.4 451,695 523,042 -71,348 2012
n.a. n.a. NZD n.a. n.a. n.a. n.a. 12,709 12,833 18,164 n.a. n.a. n.a. n.a. n.a. n.a. n.a.
72.7 2008 – 11 TOP 799,273 470,669 4,557 2011– 12 p n.a. n.a. n.a. 2.8 3.5 6.3 15,287 195,819 -180,532 2012
67.8 p 2010– 12 AUD 37,517 38,178 3,407 2011 3,029 3,471 3,179 2.8 -2.2 -0.6 653 20,510 -19,857 2011
72.7 2009 VUV 70,347,000 760,097 3,099 2011 696 766 722 4.3 2.8 0.9 54,814 296,643 -241,830 2012
75.9 2005 – 08 XPF 18,000,000 183,181 12,324 2005 2,273 1,991 2,294 -0.5 3.3 4.0 204 63,966 -63,762 2011
5Advancing Statistical Development in the Pacific Island Region
Pacific Statistics Steering Committee members, 6th session May 2013, including visiting guests:
Back row: Mr. Tomas Africa (1-L) and Ross McLeod (5-L), consultant of TYPSS Phase-1 mid-term review;
Mr Dennis Trewin (2-L), consultant to USP Official Statistics program;
Mr. Johannes Juetting (3-L), Paris21 Manager.
Front row: Mr. Len Cook (1-L), Friend of the Chair (4-L), Mr. Sefuiva Reupena Muagututi’a, Government Statistician, Samoa
Statistical governance and monitoring
Implementing agreed-upon TYPSS outputs and outcomes, including effective regional technical
cooperation, requires effective governance oversight at national and regional levels.
• National statistical advisory committees, comprising of data users and producers, are well placed
to advise on statistical priorities, ensure collections and data release are carried out in a timely
manner, and monitor overall statistical developments;
• At regional level, the Pacific Statistics Steering Committee (PSSC) provides statistical leadership
in guiding and monitoring implementation of the Ten Year Pacific Statistics Strategy. It is chaired
by the chair of the current Regional Conference of Heads and Statistics and Planning (2013-
2016), and comprises of eleven members (eight Government Statisticians and three planners)
and ten observers, representing regional and international financial and technical partners. It
meets every six months.
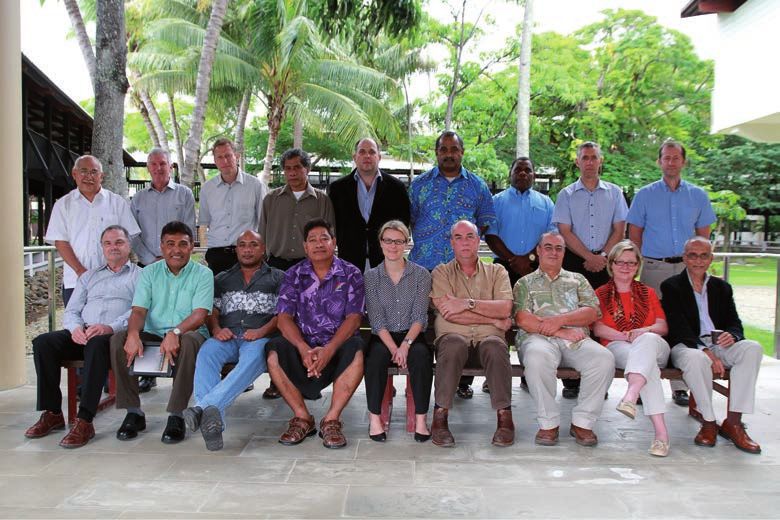
6Recent Progress in Statistical Developments
• User-friendly access to National Minimum Development Indicators (www.spc.int/sdd)
- successful response to request from Pacific Leaders to develop core set of statistics and
indicators across sectors
• Tangible improvements by countries in web-based data dissemination, facilitated by Pacific
Regional Information System (www.spc.int/prism)
• Pacific island countries achieving best census coverage world-wide, with all having undertaken
at least one population and housing census during the 2010 World round of censuses
• Notable progress by some NSOs in attracting strong political support and adequate annual
budgets to sustain regular statistical collections and the production of statistical outputs
• Comprehensive multi-year household survey programme established with generous financial
support from Australia and the Asian Development Bank, ensuring all countries have some
credible statistical indicators and benchmarks that were unavailable prior to 2005
• Concerted efforts in some countries to strengthen administrative databases and associated
management information systems in key sectors (CRVS, education, health), to facilitate regular
and real-time monitoring of development progress and policy performance
• Consolidation of sectoral statistical expertise in some NSOs available for south-south collaboration
with smaller island countries lacking such expertise, thus contributing to an emerging Pacific
statistical system
• Growing commitment to long-term strategic statistical planning across the region, with one country,
Samoa, already in the implementation stage of their National Strategy for the Development of
Statistics, (NSDS), with a further five countries at various stages of finalizing their strategy in 2014.
7Secretariat of the Pacific Community
alia, Cook Islands, Federated States of Micronesia, Fiji, Kiribati, Nauru, New Zealand, Niue, Palau, Papua New Guinea, Republic of Marshal Islands, Samoa, Solomon Isl
a, Tuvalu, and Vanuatu. Australia, Cook Islands, Federated States of Micronesia, Fiji, Kiribati, Nauru, New Zealand, Niue, Palau, Papua New Guinea, Republic of Ma
ds, Samoa, Solomon Islands, Tonga, Tuvalu, and Vanuatu. Australia, Cook Islands, Federated States of Micronesia, Fiji, Kiribati, Nauru, New Zealand, Niue, Palau, P
Guinea, Republic of Marshal Islands, Samoa, Solomon Islands, Tonga, Tuvalu, and Vanuatu. Australia, Cook Islands, Federated States of Micronesia, Fiji, Kiribati, N
Zealand, Niue, Palau, Papua New Guinea, Republic of Marshal Islands, Samoa, Solomon Islands, Tonga, Tuvalu, and Vanuatu. Australia, Cook Islands, Federated Stat
onesia, Fiji, Kiribati, Nauru, New Zealand, Niue, Palau, Papua New Guinea, Republic of Marshal Islands, Samoa, Solomon Islands, Tonga, Tuvalu, and Vanuatu. Aust
Islands, Federated States of Micronesia, Fiji, Kiribati, Nauru, New Zealand, Niue, Palau, Papua New Guinea, Republic of Marshal Islands, Samoa, Solomon Islands, T
u, and Vanuatu. Australia, Cook Islands, Federated States of Micronesia, Fiji, Kiribati, Nauru, New Zealand, Niue, Palau, Papua New Guinea, Republic of Marshal Isl
oa, Solomon Islands, Tonga, Tuvalu, and Vanuatu. Australia, Cook Islands, Federated States of Micronesia, Fiji, Kiribati, Nauru, New Zealand, Niue, Palau, Papua New Gu
blic of Marshal Islands, Samoa, Solomon Islands, Tonga, Tuvalu, and Vanuatu. Australia, Cook Islands, Federated States of Micronesia, Fiji, Kiribati, Nauru, New Zea
Booklet produced in collaboration with PARIS21
National Minimum Development Indicators (NMDI) - www.spc.int/nmdi
Statistics for Development (SDD) - www.spc.int/sdd
Pacific Regional Information System - www.spc.int/prism
Follow us @prismstats
8You can also read