Investing in Napier Port
              June 2021
←
→
Page content transcription
If your browser does not render page correctly, please read the page content below
Investing in Napier Port
June 2021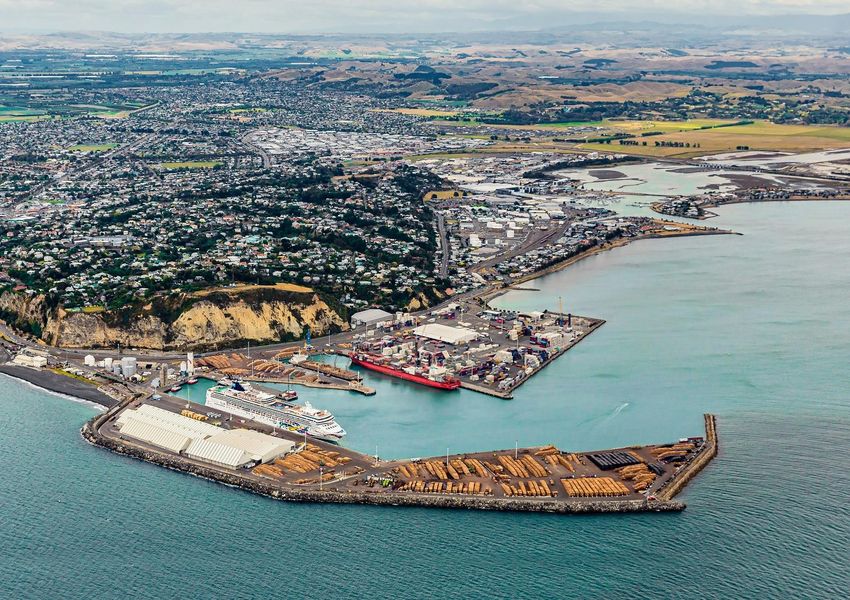
IMPORTANT NOTICE AND DISCLAIMER

This presentation has been prepared by Napier Port Holdings Limited (together with Port of Napier Limited, "Napier
Port"). This presentation is being provided to you on the basis that you are, and you represent and warrant that you are,         Past performance: Any past performance information given in this presentation is given for illustrative purposes only
a person to whom the provision of the information in this presentation is permitted by the applicable laws and regulations        and should not be relied upon as (and is not), a promise, representation, warranty or guarantee as to the past, present
of the jurisdiction in which you are situated without the need for registration, lodgement or approval of a formal disclosure     or the future performance of Napier Port.
document or any other filing or formality in accordance with the laws of that foreign jurisdiction.                               Future performance: This presentation contains "forward-looking statements", which include all statements other than
Information only; No reliance: This presentation is for information purposes only and you should not rely on this                 statements of historical facts, including, without limitation, any statements preceded by, followed by or that include the
presentation. This presentation does not purport to contain all of the information that you may require or be complete.           words "targets", "believes", "expects", "aims", "intends", "will", "may", "anticipates", "would", "could" or similar
The historical information in this presentation is, or is based upon, information that has been released to NZX Limited           expressions or the negative thereof. Indications of, and guidance or outlook on, future earnings or financial position or
("NZX"). This presentation should be read in conjunction with Napier Port's other periodic and continuous disclosure
announcements, which are available at www.nzx.com.                                                                                performance are also forward-looking statements. Such forward-looking statements involve known and unknown risks,
                                                                                                                                  uncertainties and other important factors beyond the control of Napier Port that could cause the actual results,
The information in this presentation does not constitute a personal recommendation or service or take into account the            performance or achievements of Napier Port to be materially different from future results, performance or achievements
particular needs of any recipient. The information in this presentation should be considered in the context of the
circumstances prevailing at the date and time of the presentation and is subject to change without notice. No person is           expressed or implied by such forward-looking statements. No assurances can be given that the forward-looking
under any obligation to update this presentation nor to provide you with further information about Napier Port. This              statements referred to in this presentation will be realised. Given these uncertainties, you are cautioned not to rely on
presentation does not constitute or form part of an offer to sell, or a solicitation of an offer to buy, any shares, securities   such forward-looking statements.
or financial products in any jurisdiction. This presentation has not been and will not be filed with or approved by any           Confidentiality and copyright: This presentation is strictly confidential and is intended for the exclusive benefit of the
regulatory authority in New Zealand or any other jurisdiction.
                                                                                                                                  person to which it is presented. This presentation should not be copied, reproduced or redistributed without the prior
Investment risk: An investment in securities in Napier Port is subject to investment and other known and unknown risks,           written consent of Napier Port. Distribution of this presentation may be restricted or prohibited by law. The copyright of
some of which are beyond the control of Napier Port. Napier Port does not guarantee any particular rate of return or the          this presentation and the information contained in it is vested in Napier Port.
performance of Napier Port.
                                                                                                                                  Acceptance: For purposes of this Notice, "presentation" shall mean the slides, the oral presentation of the slides by
No liability: Napier Port, its shareholders, their respective advisers and affiliates, and each of their respective directors,    Napier Port, any question-and-answer session that follows that oral presentation, hard copies of this document and any
shareholders, partners, officers, employees and representatives accept no responsibility or liability for, and make no            materials distributed at, or in connection with, that presentation. By attending an investor or analyst presentation or
representation, warranty or undertaking, express or implied, as to, the fairness, accuracy, reliability or completeness of,       briefing, or accepting, accessing or reviewing this presentation, you acknowledge and agree to the terms set out in this
and to the maximum extent permitted by law hereby disclaim and shall have no liability whatsoever (including, without
limitation, arising from fault or negligence or otherwise) for any loss or liability arising from, this presentation or any       Notice.
information contained, referred to or reflected in it or supplied or communicated orally or in writing to you or any other
person. The information in this presentation has not been independently verified or audited.
Financial data: All dollar values are in New Zealand dollars (NZ$ or NZD) unless otherwise stated. Any financial
information provided in this presentation is for illustrative purposes only and is not represented as being indicative of
Napier Port's views on its future financial condition and/or performance.
Investors should be aware that certain financial data included in this presentation are 'non-GAAP financial measures'.
Investors are cautioned not to place undue reliance on any non-GAAP financial measures included in this presentation,
they do not have a standardised meaning prescribed by New Zealand Generally Accepted Accounting Standards and,
therefore, may not be comparable to similarly titled measures presented by other entities, nor should they be construed
as an alternative to other financial measures determined in accordance with New Zealand Generally Accepted
Accounting Standards.

                                                                                                                                                                                                                          2
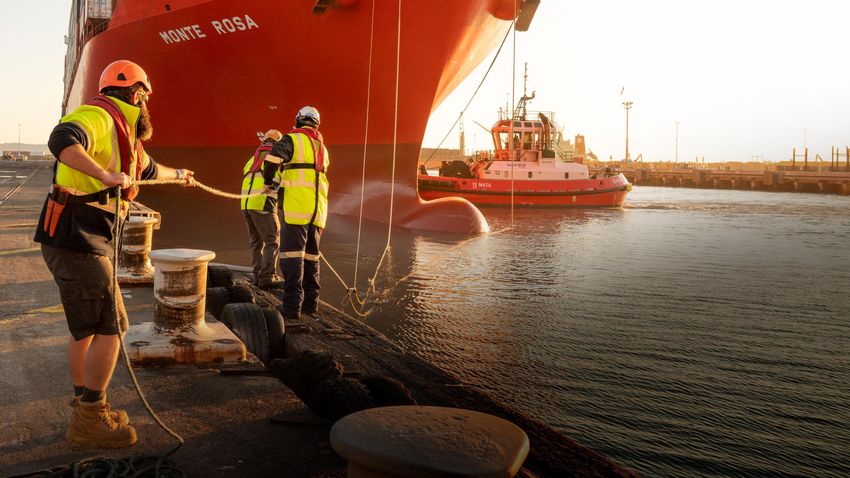
NAPIER PORT - A NEW ZEALAND EXPORT GATEWAY
  AN EXPORT DRIVEN PORT CONNECTING A THRIVING REGION TO THE WORLD

                          KEY STATISTICS (FY2020)

              CONTAINERS                              EXPORTS
             LEAD REVENUE                             DOMINATE
                     Other 3%
        Cruise 4%                                                                            ◼ Fourth largest container
                                            Imports              Exports                       terminal port in New
                                             20%                  80%
                                                                                               Zealand
                                                      VOLUME
                    REVENUE                            5.0M
                     $100.4m                          TONNES
Bulk cargo                                                                            ◼ Napier Port is positioned on New
   31%                                                                                  Zealand's main shipping route
                                Container
                                  62%                                                   with core national rail and road
                                                                                        network connectivity

                                                                           ◼ The majority of our cargo owners are
                                                          >268,000           located within 100 km of Napier Port,
        5.0 M TONNES             2.4 M TONNES
            CARGO                    LOGS             TEU CONTAINERS         providing a nearby, cost effective route to
          HANDLED                  EXPORTED              HANDLED             market

            ~284                   $100.4 M                $41.2 M
         PERMANENT                 REVENUE              RESULT FROM
           STAFF                                        OPERATIONS

                                                                                                   3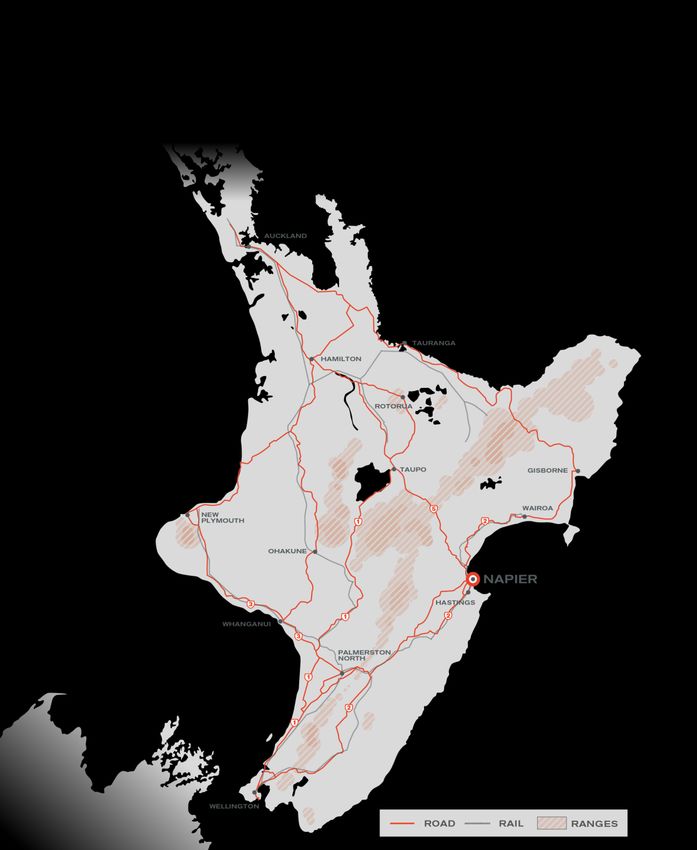
NAPIER PORT - A NEW ZEALAND EXPORT GATEWAY
AGILE AND RESILIENT INFRASTRUCTURE TO SUPPORT THE REGION

                                                           KEY INFRASTRUCTURE
                                                           •   50-hectare site
                                                           •   6 mobile harbour cranes
                                                           •   1000+ connection points for refrigerated cargo
                                                           •   42,830m2 warehousing
                                                           •   34 heavy container handling machines
                                                           •   16-hectare container storage space
                                                           •   Large on-port packing facility – 8000m2
                                                           •   10 hectares of dedicated log storage
                                                           •   Dedicated stevedoring services, SSA
                                                           •   Skilled log marshalling services, ISO and C3
                                                           •   Offsite container service and marshalling facilities

                                                           6 WHARF
                                                           •   Investment to support future growth
                                                           •   350m wharf with estimated cost of $173m - $190m
                                                           •   Target completion in 2022
                                                           •   Benefits include: reduced congestion, handle larger vessels, 24-hour
                                                               berthing, increased operational agility and resilience

                                                                                                              4
A STRATEGY TO DRIVE CUSTOMER COLLABORATION
NAPIER PORT IS BUILDING STRONG RELATIONSHIPS WITH CUSTOMERS TO CONNECT THEM TO THE WORLD

                                                             TOGETHER WE BUILD A THRIVING REGION
               OUR
               PURPOSE                                         BY CONNECTING YOU TO THE WORLD

               OUR FOCUS

                             Better understanding what   Collecting and harnessing    Using connected network            Working with all
                              our customers want and          data and using           infrastructure to ensure      stakeholders to help drive
                               how we can help them      technology to optimise         seamless supply chains      growth in the region, to drive
                                 achieve their goals          our operations         across our region and beyond        growth for the port

               OUR
               FOUNDATION                                                      OUR CULTURE OF CARE

                                                                                                                                              5
OUR STRATEGY BUILDS ON A STRONG BUSINESS
A LONG-TERM ASSET ESSENTIAL TO THE HEALTH OF THE HAWKE’S BAY ECONOMY

                                                                                                                                                                                               RELEVANCE
                                                                                                                                                                                                DURING
                                                                                                                                                                                                COVID-19

 AN INFRASTRUCTURE ASSET ESSENTIAL TO THE HEALTH OF THE HAWKE’S BAY ECONOMY
 Napier Port is an essential regional infrastructure asset and, by connecting Hawke’s Bay and central New Zealand to global markets, is an active participant in driving regional prosperity

 STRONG REGIONAL ECONOMIC GROWTH DRIVERS AND STRONG KEY CUSTOMER RELATIONSHIPS
 The Hawke’s Bay region has experienced strong growth, supported by international demand for its diverse range of export cargo.
 Strong key customer relationships see the Port embedded as an essential supply chain partner

 DIVERSIFIED TRADE PORTFOLIO MITIGATES SECTOR AND COUNTRY-SPECIFIC RISKS
 The Port handles a diversified mix of export and import products including logs and forestry products, pipfruit, oil products and fertiliser, which are shipped to or from over
 110 countries globally

 WELL-POSITIONED GIVEN FUTURE CARGO VISIBILITY AND FULLY-CONSENTED DEVELOPMENT PLANS
 Future cargo visibility enables robust planning for strategic growth projects. Development of 6 Wharf is expected to significantly increase the Port’s capacity and improve
 operational efficiency

 STRONG HISTORICAL FINANCIAL PERFORMANCE AND A RECORD OF EXECUTION ON GROWTH OPPORTUNITIES
 Napier Port delivered annual average revenue growth of 8.4% over the last four years (2016 - 2020), while consistently delivering EBITDA margins of above 40%

 EXPERIENCED MANAGEMENT TEAM THAT IS WELL CONNECTED WITH CARGO OWNERS AND OTHER STAKEHOLDERS
 Extensive commercial and infrastructure expertise and broad depth of senior leadership experience in New Zealand and overseas, and management enjoys strong relationships
 with key stakeholders and the local community

                                                                                                                                                                                        6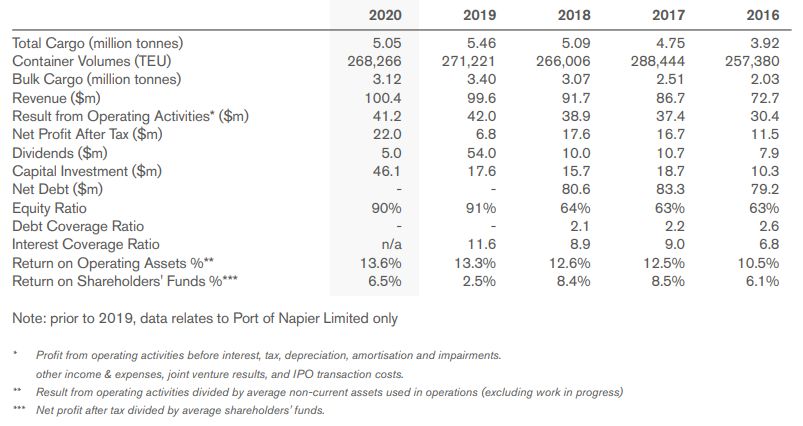
STRONG REGIONAL ECONOMIC GROWTH DRIVERS
GROWTH IN THROUGHPUT OVER THE LAST 10 YEARS HAS BEEN PRIMARILY DRIVEN BY TRADE TO AND FROM HAWKE’S BAY AND ITS SURROUNDING REGION

       Napier Port throughput FY2010 to FY2020, (000 tonnes)                                                                                                               Hawke’s Bay GDP growth(1) (NZ$B)

                                               4.0% CAGR                                                                                                                                       4.7% CAGR

                                                                                        5,459                                                                                                                                     8.2    8.7
                                                                                                                                                                                                                       7.6
                                                                              5,088              5,049                                                                                        6.6        6.7    7.0
                                                                                                                                                5.9            6.1            6.2
                                                                     4,755                                                       5.6

                                         4,105 4,067
                                3,987                       3,916
             3,643 3,713
   3,416
                                                                                                                                2010           2011           2012           2013           2014         2015   2016   2017       2018   2019

                                                                                                                                                      ~60% OF NEW ZEALAND’S TOTAL PLANTED
                                                                                                                                                      AREA OF PIPFRUIT2

   FY10 FY11 FY12 FY13 FY14 FY15 FY16 FY17 FY18 FY19 FY20                                                                                             ~8% OF NEW ZEALAND’S TOTAL PLANTED
                              Imports                                  Exports                                                                        FOREST AREA3

Sources (1) Statistics NZ. (2) Statistics NZ: Horticulture by Regional Council as at 30 June 2019. (3) The Ministry of Primary Industries, Te Uru Rakau, the New Zealand Farm Forestry Association and
the New Zealand Forest Owners Association – Facts & Figures 2019/20.                                                                                                                                                          7
DIVERSIFIED TRADE PORTFOLIO MITIGATES RISK
THE PORT HANDLES A DIVERSIFIED MIX OF EXPORT AND IMPORT PRODUCTS, WHICH ARE SHIPPED TO MORE THAN 110 COUNTRIES GLOBALLY
Napier Port export product mix (FY2020, by weight)
Other
13%
Meat
5%
Timber
6% Logs
58%
Pipfruit
7%
Woodpulp
11%
Napier Port import product mix (FY2020, by weight)
Other
7%
Cement
4%
• We are primarily export focused (with exports making up 80% of all cargo Fertiliser
Foodstuffs 34%
by weight processed through the Napier Port in FY2020) but imports also
12%
contribute to our diversified trade portfolio
• A number of different revenue streams across container services, bulk
cargo, cruise and other income
General
• Over 30 export and import commodity products are handled through the cargo
Port 15%
Oil products
28%
8FUTURE CARGO VISIBILITY ENABLES ROBUST STRATEGIC PLANNING
FOREST AND ORCHARD PLANTINGS CORRELATED WITH NAPIER PORT CARGO FLOWS OF THESE PRODUCTS
Napier Port forestry product export composition (FY2010 to FY2020, 000 tonnes) Napier Port pipfruit exports (FY2010 to FY2020, TEUs)
6.8% CAGR 5.8% CAGR
2,996 3,366 3,084 25,979 25,724
23,201 23,917
2,442
2,106 22,094
1,966 1,950 2,001 21,007
1,603 1,742 1,724 19,025
18,018
16,267
14,575 15,141
FY10 FY11 FY12 FY13 FY14 FY15 FY16 FY17 FY18 FY19 FY20
Logs Woodpulp Sawn timber Woodchips Paper
Hawke's Bay forestry planting 1990 to 20181 (hectares)
FY10 FY11 FY12 FY13 FY14 FY15 FY16 FY17 FY18 FY19 FY20
12,000
10,000
• Hawke’s Bay has ~8% of New Zealand’s total planted forests and
8,000 ~60% of the country’s total planted pipfruit orchards made up of:
6,000 • 132,000 hectares2 of planted forests with plantings in the mid-
4,000
1990s now coming to maturity
• 6,000 hectares3 of orchards, with an average yield of 61 tonnes
2,000
per hectare⁴
0
1990 1994 1998 2002 2006 2010 2014 2018
Sources: (1) Forme Forest Industry Consultants. (2) The Ministry of Primary Industries, Te Uru Rakau, the New Zealand Farm Forestry Association and the New Zealand Forest Owners Association – Facts & Figures 2019/20. 9
(3) Statistics NZ: Horticulture by Regional Council as at 30 June 2019. (4) World Apple Review 2018.NAPIER PORT HAS A STRONG RECORD OF FINANCIAL PERFORMANCE
BETWEEN 2016 AND 2020 NAPIER PORT HAS DELIVERED AVERAGE REVENUE GROWTH OF 8.4% AND PROFORMA EBITDA MARGINS OF ~40%
Napier Port revenue FY2010 – FY2020 (NZ$M) Napier Port pro forma EBITDA FY2016 – FY2020 (NZ$M) and Margin (%)
7.5% CAGR 10.2% CAGR
$99.6 $100.4
$91.7 40.7% 40.9%
$86.7 40.5%
40.7%
$72.1 $72.7
$67.0 38.2%
$60.3 $62.1
$54.1
$48.8
$40.5 $41.0
$35.3 $37.2
$27.8
FY10 FY11 FY12 FY13 FY14 FY15 FY16 FY17 FY18 FY19 FY20 FY16 FY17 FY18 FY19 FY20
10OUR NZX MARKET RECORD TO DATE
NAPIER PORT HAS OUTPERFORMED THE S&P NZX 50 SINCE LISTING
Napier Port share price and trade volume since listing (August 2019)
1.5 3,500,000 • Joined S&P NZX 50 on 22 June 2020
1.4
3,000,000
1.3
2,500,000
1.2
Index vaue
2,000,000
Volume
1.1
1,500,000
1
1,000,000
0.9
500,000
0.8
0.7 -
NPH VOLUME NPH NZX50
11APPENDIX 1: FIVE YEAR TRADE AND FINANCIAL SUMMARY
12You can also read