Frasers Centrepoint Trust - Presentation at Lim & Tan TR & Clients Evening Event 20 March 2019 - SGX.com
←
→
Page content transcription
If your browser does not render page correctly, please read the page content below
Frasers Centrepoint Trust
Presentation at Lim & Tan TR & Clients Evening Event

20 March 2019

Important notice
Important Notice
Certain statements in this Presentation constitute “forward-looking statements”, including forward-looking financial information. Such forward-
looking statement and financial information involve known and unknown risks, uncertainties and other factors which may cause the actual results,
performance or achievements of FCT or the Manager, or industry results, to be materially different from any future results, performance or
achievements expressed or implied by such forward-looking statements and financial information. Such forward-looking statements and financial
information are based on numerous assumptions regarding the Manager’s present and future business strategies and the environment in which
FCT or the Manager will operate in the future. Because these statements and financial information reflect the Manager’s current views concerning
future events, these statements and financial information necessarily involve risks, uncertainties and assumptions. Actual future performance could
differ materially from these forward-looking statements and financial information.
The Manager expressly disclaims any obligation or undertaking to release publicly any updates or revisions to any forward-looking statement or
financial information contained in this Presentation to reflect any change in the Manager’s expectations with regard thereto or any change in events,
conditions or circumstances on which any such statement or information is based, subject to compliance with all applicable laws and regulations
and/or the rules of the SGX-ST and/or any other regulatory or supervisory body or agency. The value of Units in FCT and the income derived from
them may fall as well as rise. The Units in FCT are not obligations of, deposits in, or guaranteed by, the Manager or any of their affiliates. An
investment in the Units in FCT is subject to investment risks, including the possible loss of the principal amount invested. Unitholders of FCT
should note that they have no right to request the Manager to redeem their Units while the Units are listed. It is intended that Unitholders of FCT
may only deal in their Units through trading on the SGX-ST. Listing of the Units on the SGX-ST does not guarantee a liquid market for the Units.
This Presentation contains certain information with respect to the trade sectors of FCT’s tenants. The Manager has determined the trade sectors in
which FCT’s tenants are primarily involved based on the Manager’s general understanding of the business activities conducted by such tenants.
The Manager’s knowledge of the business activities of FCT’s tenants is necessarily limited and such tenants may conduct business activities that
are in addition to, or different from, those shown herein.
This Presentation is for information only and does not constitute an invitation or offer to acquire, purchase or subscribe for any securities of FCT.
The past performance of FCT and the Manager is not necessarily indicative of the future performance of FCT and the Manager.
This Presentation includes market and industry data and forecast that have been obtained from internal survey, reports and studies, where
appropriate, as well as market research, publicly available information and industry publications. Industry publications, surveys and forecasts
generally state that the information they contain has been obtained from sources believed to be reliable, but there can be no assurance as to the
accuracy or completeness of such included information. While the Manager has taken reasonable steps to ensure that the information is extracted
accurately and in its proper context, the Manager has not independently verified any of the data from third party sources or ascertained the
underlying economic assumptions relied upon therein.
This advertisement has not been reviewed by the Monetary Authority of Singapore.
2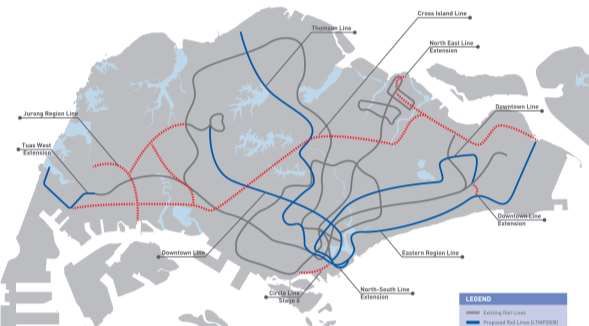
Overview
Frasers Centrepoint Trust (FCT)
Six suburban retail properties located in Singapore’s
densely-populated residential areas, with excellent Market Cap of
footfall catchment and connection to public transport S$2.1 billion1
infrastructure
Bloomberg: FCT SP
Reuters: J69U.SI
Tenancy-mix focused on necessity and convenience SGX: J69U
shopping; F&B and services which remain resilient
through economic cycles
Strong track record: 12 consecutive years of
Distribution per Unit (DPU) growth since IPO in 2006 Total appraised
value of S$2.75
Poised for Growth: Opportunities to acquire retail billion2
properties from Sponsor and 3rd parties; AEI and
organic growth from current properties
Sponsored by Frasers Property Limited
Total net lettable
area of 1.1
million square
feet
1. Based on closing price of $2.29 on 28 February 2019
2. As at 30 September 2018
3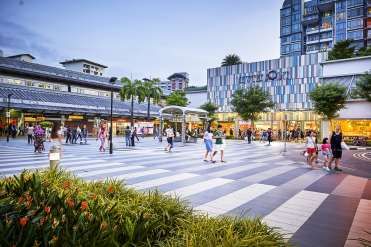
Overview
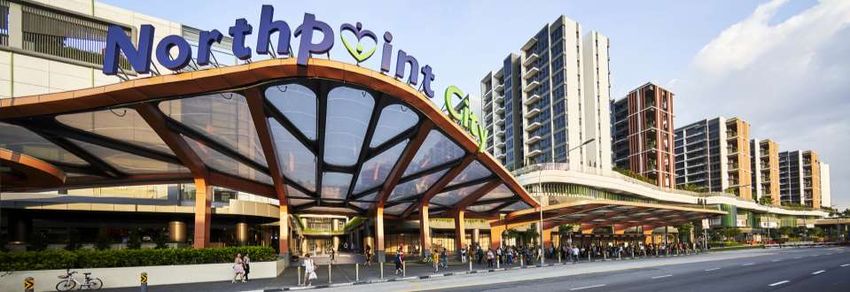
Portfolio of six suburban retail properties
Well-located suburban retail properties that enjoy good connectivity to public transport,
high footfall and high occupancy
Anchorpoint YewTee Point Causeway Point Northpoint City Bedok Point Changi City Point
North Wing1
Legend
Existing MRT Lines
Singapore
Future MRT Lines
1. Also includes Yishun 10 retail podium located next to Northpoint City North Wing | Map source: URA Master Plan, Illustration not to scale 4
Overview

Many reasons for shoppers to visit our malls
Convenience, wide range of options, delightful experience

Necessity & convenience shopping   Fun for the family   Delightful shopper experiences

Everyday dining                    Essential services   Social and family dining

                                                                                         5
Overview

Our malls are highly accessible by public transport
     Northpoint City, located in Yishun Central                    Linkway to the Expo MRT Station of Downtown Line
                                                                   from basement of Changi City Point

                                   North Park Residences
    Northpoint City North Wing

                                              Yishun MRT Station
     Through-block link at Causeway Point leading to               YewTee MRT Station next to YewTee Point
     Woodlands MRT station and Bus Interchange

                                                                                                                      6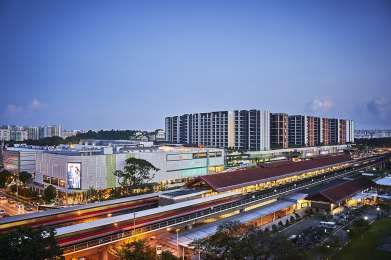
Consistent performance

                                                        Revenue and Net Property Income (S$ million)
                                                            Net Property Income                 Gross Revenue

                                                                                                                                                    Revenue +6.5% yoy
                                                                                                                                                        NPI + 5.9% yoy

                                                                                                                    189.2                                   193.3
                                                                                                                                    183.8       181.6
                                                                                                     168.8
                                                                                      158.0
                                                                      147.2
                                                                                                             131.0           129.8          129.6       137.2
                                                       117.9                                  118.1
                                       114.7                                  111.6
                                                               104.4
         84.7            86.6 80.1               82.6
  56.6            59.9

     FY2008         FY2009         FY2010          FY2011         FY2012          FY2013         FY2014         FY2015         FY2016*       FY2017*      FY2018

* Revenue and Net Property Income in FY2016 and FY2017 were affected by the asset enhancement works at Northpoint City North Wing

                                                                                                                                                                    7
Results - Highlights
1Q19 results highlights
Revenue ($ million) Net Property Income Distribution per Unit
($ million) (cents)
▲ 2.9%
49.30 ▲ 2.5%
▲ 0.7%
47.90 35.40
34.50 3.02
3.00
1Q18 1Q19 1Q18 1Q19 1Q18 1Q19
NAV and NTA per Unit of $2.08 as at 31 Dec 2018 (30 Sep 2018: $2.08)
Gearing level at 28.8% as at 31 Dec 2018 (30 Sep 2018: 28.6%)
96.4% portfolio occupancy as at 31 Dec 2018 (31 Dec 2017: 92.6%)
1Q19 portfolio average rental reversion at +6.9% (4Q18: +0.2%)
8
Steady DPU growth
12 consecutive years of DPU growth

                                                            Distribution per Unit (S cents)

                                                                                                                11.764   11.9   12.015
                                                                                                       11.608
                                                                                      10.93   11.187
                                                                              10.01

                                                             8.2       8.32
                                 7.29          7.51
                    6.55
      6.03

    FY2006 FY2007 FY2008 FY2009 FY2010 FY2011 FY2012 FY2013 FY2014 FY2015 FY2016 FY2017 FY2018
     (IPO)*

* Annualised DPU for the period 5 Jul 06 (IPO) to 30 September 2006.

                                                                                                                                         9
Overview
Strong financial position
Key financial indicators
Gearing level of SREIT by sector1 as at 31 Dec 2018
Gearing level1 28.8%
36.4% 36.2% Overall average
35.6% 35.6% FCT’s gearing Interest Cover2 5.92 times
34.6%
level is one of
the lowest Weighted average debt
1.8 years
among SREITs maturity
31.8%
30.8% Percentage of borrowings on
fixed rates or hedged via 54%3
28.8% interest rate swaps
Unencumbered assets as %
85.8%
of total assets
All-in average cost of
2.7%
borrowings
Corporate credit rating
• S&P BBB+ (Stable)
• Moody’s Baa1 (Stable)
1. The ratio of total outstanding borrowings over total assets as at stated
balance sheet date
2. Earnings before interest and tax (EBIT) divided by interest expense
1 Source: OCBC Investment Research Weekly S-REITs Tracker, 11 March 2019
10Overview
Clear growth strategies
Future
Northpoint 2 Bedok Changi City Yishun 10 Retail Northpoint South Wing
YewTee Point Point Point Podium (Singapore)
Acquisition 2010 2011 2014 2016
Waterway Point (33.3%)
Growth (Singapore)
Acquisition opportunities
of 3rd party assets in
S’pore and overseas
Northpoint City Causeway Point
Enhancement Anchorpoint Northpoint Causeway Point North Wing UPL*
(2008) (2010) (2012) (2017) (2019)
Growth
(AEI)
*UPL: Underground Pedestrian Link
Organic
Growth
Rental Growth High Occupancy High Footfall
11Overview
Frasers Property’s retail assets in Singapore
Northpoint City North Wing Northpoint City South Wing
(FPL owns 100%)
Causeway Point
YewTee Point
Singapore
The Centrepoint Waterway Point
(FPL owns 33.3%)
Bedok Point Eastpoint
Anchorpoint
Robertson
Walk Changi City Point
Valley Point
(6) Owned by FCT
(5) Owned and managed by Frasers Property Limited (“FPL”), including properties held through joint ventures
(1) Managed by Fraser Property Limited, owned by 3rd party
Illustration is not to scale 12Healthy macro-economic fundamentals
Household median income in Singapore Low unemployment rate in Singapore
continues to grow (S$)
3.0
9,293
9,023
8,666 8,846
8,292
7,872
7,566
7,037 2.2 2.2 2.2
2.1 2.1
6,342 2.0 2.0 2.0
6,100 6,006 1.9 1.9
2008 2009 2010 2011 2012 2013 2014 2015 2016 2017 2018 2008 2009 2010 2011 2012 2013 2014 2015 2016 2017 2018
Median Monthly Household Income from Work (Including Employer CPF Contributions) Overall unemployment rate (Annual Average)
Among Resident Employed Households, 2008 – 2018
Source: Department of Statistics, Key Household Income Trends Source: Unemployment - Ministry of Manpower, Singapore
13Retail sales remain resilient
Retail Sales Index (excluding motor vehicles) at Current Prices
(2017 = 100)
120.0
115.0
110.0
105.0
100.0
95.0
90.0
Jan Feb Mar Apr May Jun Jul Aug Sep Oct Nov Dec Jan
2018 2019
Seasonal Adjustment: Seasonal effects are observed in the RSI as there are usually intra-year periodic variations that repeat during the fixed period of time every year. To
better reflect the underlying trends of the monthly sales, the RSI index is seasonally adjusted to remove the seasonal effects.
The RSI covers retail sales of: (a) (multi-channel) retailers in Singapore that sell via both physical stores and online/ecommerce sites; (b) retailers in Singapore that sell via
physical stores only; and (c) retailers in Singapore that sell mainly via online/e-commerce sites
Source: Department of Statistics Singapore, March 2019
14Limited upcoming new retail supply after 2019
NLA (mil sq ft) Composition of supply from 2019 to 2022:
3.0
Rest of
Orchard
Central
2.5 6%
4%
5-Yr Avg: 1.66 mil
2.0
Downtown
Core
Outside 30%
1.5 Central
Region
1 . 10 mil 32%
1.0
Fringe
28%
0.5 0 . 35 mil
0 . 14 mil
0 . 10 mil
0.0
2014 2015 2016 2017 2018 2019 2020 2021 2022
Completed O rchard Downtown Core Rest of Central Fringe O utside Central Region
Note: Numbers include additional space carved out during AEI and if the development is closed entirely the total new NLA of enhanced asset is included. Future
supply tracks projects with NLA of 20,000 sf and more.
Source: CBRE Research
Source: CBRE, Singapore Real Estate Market Update, 4Q2018
15Prime Rent Up
Q4 18 Q - o- Q Y- o- Y
Sub- market
$ psf/ mth Prime Rent Change Change
$40.00 Orchard Road $31.70 0.0% 1.3%
$38.00 Suburban $29.15 0.0% 1.2%
$36.00
$34.00 Q1 2008
29%
$32.00
$30.00
$28.00
Q4 2018
For the whole of 2018, average islandwide 8.7%
$26.00
prime rents as tracked by CBRE Research
$24.00 increased by 1.2% y-o-y on the back of a
gradual increase in retail sales and tourism
$22.00
growth. – CBRE, Q4 2018
$20.00
Q 1 2008
Q 2 2008
Q 3 2008
Q 4 2008
Q 1 2011
Q 2 2011
Q 3 2011
Q 4 2011
Q 1 2012
Q 2 2012
Q 3 2012
Q 4 2014
Q 1 2015
Q 2 2015
Q 3 2015
Q 4 2015
Q 1 2016
Q 2 2016
Q 3 2018
Q 4 2018
Q 1 2009
Q 2 2009
Q 3 2009
Q 4 2009
Q 1 2010
Q 2 2010
Q 3 2010
Q 4 2010
Q 4 2012
Q 1 2013
Q 2 2013
Q 3 2013
Q 4 2013
Q 1 2014
Q 2 2014
Q 3 2014
Q 3 2016
Q 4 2016
Q 1 2017
Q 2 2017
Q 3 2017
Q 4 2017
Q 1 2018
Q 2 2018
Prime Orchard Prime Suburban
Source: CBRE, Singapore Real Estate Market Update, 4Q2018
16Overview
Summary
Well-located suburban retail properties that enjoy good connectivity to public
transport, high footfall and high occupancy
Quality assets
Diversified tenant base that focuses on necessity and convenience shopping; staple
and F&B; and services to sustain footfall and tenants’ sale
management Skillsets that are fundamental to successful AEI with good returns on investment
skillsets and capital value creation
Growing DPU and NAV through prudent asset, capital and risk management
Growing DPU Strong financial position with low gearing and cost of borrowings
and strong Strong support from sponsor Frasers Property Limited
financial
position
Opportunities to acquire retail assets from Sponsor and/or 3rd parties, both in
Singapore and overseas
Positive macro-environment factors that support consumption growth in suburban
Poised for retail sector (low unemployment rate, growing median household income, growing
further growth population in the suburban residential areas, better public transport connectivity)
17You can also read