Coastal Erosion as a Result of Cyclone Ingrid - Garig Gunak Barlu National Park, Cobourg Peninsula - DEPARTMENT OF INFRASTRUCTURE PLANNING AND ...
←
→
Page content transcription
If your browser does not render page correctly, please read the page content below
DEPARTMENT OF INFRASTRUCTURE PLANNING AND ENVIRONMENT
                NATURAL SYSTEMS DIVISION

     Coastal Erosion as a Result of Cyclone Ingrid –
   Garig Gunak Barlu National Park, Cobourg Peninsula

   REPORT 16/2005D
   Patrick Gray
   Darwin
   May 2005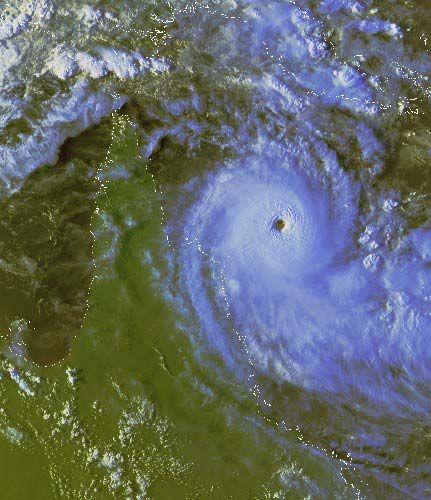
Cover Photo: Cyclone Damage along Record
Point, Port Essington

                                           2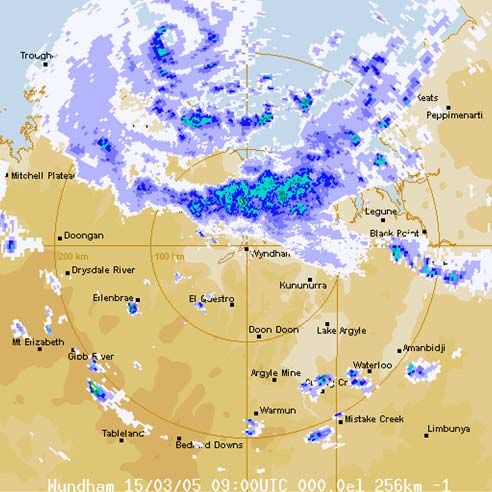
INTRODUCTION
Category five Cyclone Ingrid crossed Cobourg Peninsula mid morning on the
13/03/2005 (Figure1). With winds in excess of 225 kmh, Ingrid caused
considerable damage (Appendix 1) to both the natural and anthropogenic
environment.
Damage from cyclone Ingrid was spread over the majority of the Peninsula
with considerable coastal erosion evident within Port Essington (Figure 2).
Smith Point, which is directly exposed to the Arafura Sea, suffered some
primary dune regressions and sand loss. In an area just to the south west of
Smith Point, near the beach huts (Figure 2), dunes were completely stripped
of vegetation allowing the wind to remove significant amounts of sand and
then depositing this sand over a wide area behind the dune. Further down in
Port Essington exposed shorelines underwent considerable change. It is
estimated that the path of Cyclone Ingrid crossed directly over Caiman Creek
(Figure 2).
A field visit was undertaken six weeks after the event to looks for evidence of
storm surge and coastal erosion. Both storm surge and coastal erosion were
still clearly visible, although sand which was moved off shore from the beach
face during the cyclone is now been progressively pushed back onshore.
Cobourg Peninsula
Figure 1 Cyclone Ingrid Track across Northern Australia (Adapted from
www.bom.gov.au/inside/services_policy/tc_ingrid/index.shtml, 2005)
LOCATION
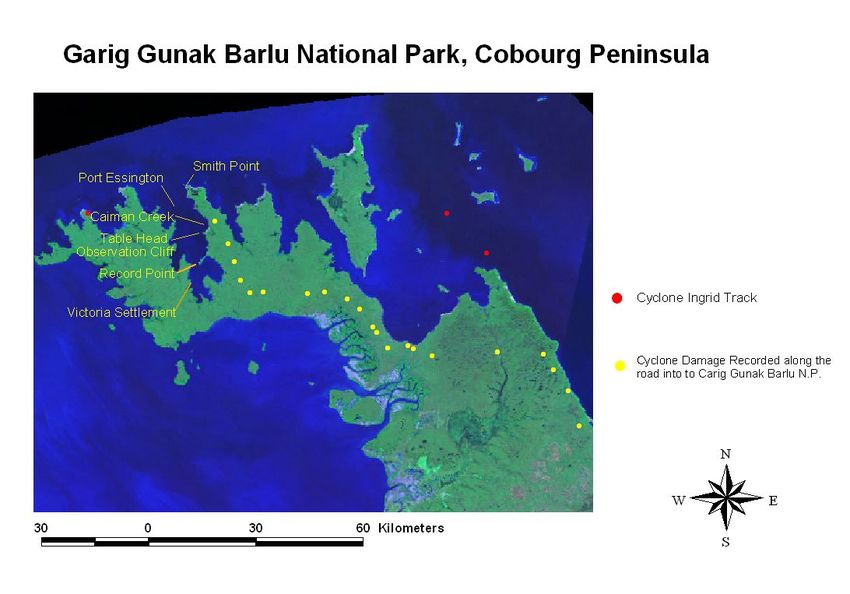
The majority of sites visited were located on the eastern side of Port
Essington from Smith Point to as far south as Record Point (Figure 2). The
only site visited on the western portion of Port Essington was Victoria
Settlement. Rough seas was a limiting factor to which area of the port were
visited.
3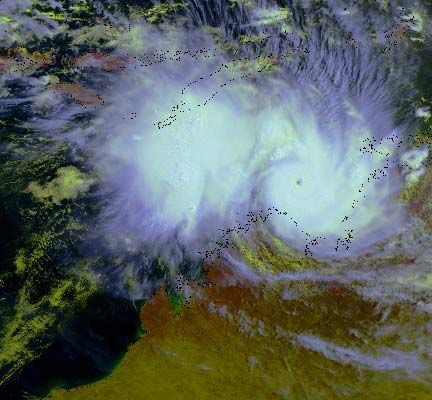
Figure 2 Locations of sites visited, Cyclone Ingrid Track and extent of cyclone
damage to terrestrial vegetation observed along the road to Garig Gunak
Barlu National Park.
METHODS
A five metre punt was used to boat along the foreshore and to enter Caiman
Creek. Once a site was selected it was transverse by foot. Photographs were
taken using a Canon 770 Digital camera

DISCUSSION
Elevated Water Levels

Just prior to the cyclone crossing Smith Point, locals described sea levels
exceeding the normal high tide position and wave spray coming over the tops
of the cliffs. Approximately 12.5 km South East of Smith Point at Table Head
(Figure 2), broken pieces coral reefs were located on top of a rock ledge
approximately 3-5 metres above the high tide mark (Plate 1 & 2). Residents
also noticed that once the cyclone had passed, sea levels remained around
the high tide mark for three days. Along this section of the coast there are no
tide gauging facilities to verify these claim. Cobourg Peninsula tidal
movement is approximately 3.5 meters during the spring tidal cycle.

As Cyclone Ingrid moved across the peninsula, the Black Point weather
station (3 km South East of Smith Point) recorded a drop in station level
pressure of over 65 hPa. This drop in pressure would have increased sea
levels by .65 of a metre. This increase does not including wave set up which
would further have increased water levels. As the cyclone moved further
westerly the prevailing wind direction from the cyclone would have been
pushing water into the Port Essington further increasing water levels.
Shoreline erosion was more evident within the Port when compared to coastal
areas around Smith Point (Plate 3 and 4)

                                                                              4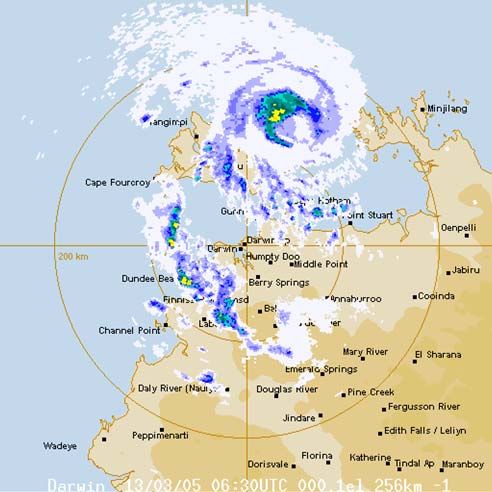
Coral Debris

Plate 1 & 2 Coral Debris on top of Table Head

Storm Surge
Evidence of storm surge was found in most sites visited within Port Essington
Large volumes of sand and debris had been moved from the dune system and
deposited in the surround hinterland region (Plate 5). At Record Point (Figure
2), sand and debris had been pushed over the dune and into the lagoon at the
rear of record point beach.

Behind the dune system at the mouth of Caiman Creek a small tidal mangrove
swamp exists. Mangroves on the edge of this swamp were in filled with sand
and debris. Some trees were buried by up to a meter of sand (Plate 6).

Large amounts of Casuarina equisetifoloia were ether up rooted or under
mined on most beaches within the port, especially Record Point (Plate 7). At
Victoria Settlement (Figure 2), a large Melaleuca Spp was undermined and
the beach strip of sediment (Plate 8). Also at this location a debris line was
located approximately 30 meters into the hinterland margin (Plate 9). The
Bureau of Meteorology reported that in one location alone the Top End coast
line, the accompanying storm tide from Cyclone Ingrid carried a boat
approximately 100 metres inland and several meters above the usual high tide
mark (www.bom.gov.au/inside/services_policy/tc_ingrid/index). Although
there is evidence of storm surge within Port Essington it would be unlikely to
have reached 100 meters inland as there are few areas where the topography
is relatively flat. The majority of the Port is surrounded by cliffs

Plate 3 Smith Point                     Plate 4 Observation Cliff (Beach)

                                                                            5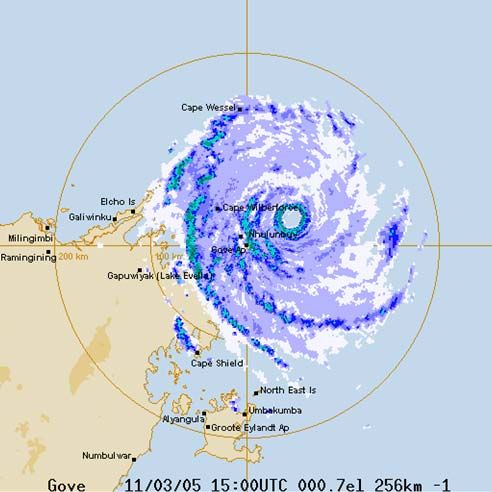
Plate 5 Sand and debris deposition.     Plate 6 Mangroves covered by
                                        approximately a metre of sand.

Plate 7 Undermined                      Plate 8 Beach Damage, Victoria
Casuarina equisetifoloia.               Settlement. Note Bark stripped
Record Point                            from Melaleuca Spp.

Plate 9 Debris line 30 metres within the Monsoon Vine Thicket, Victoria
Settlement.

                                                                          6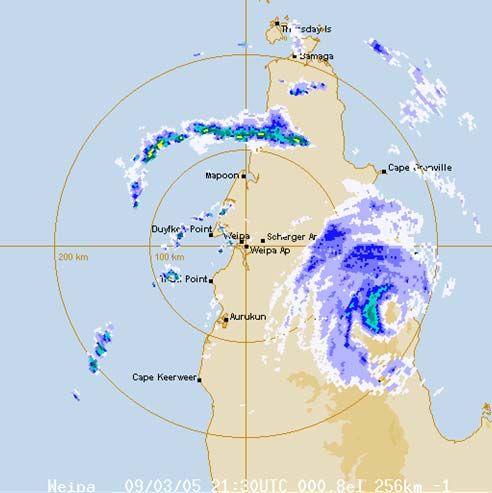
Beach Rock (Old
                                                          Sand Dune)

                                                          Broken Pieces of
                                                          Rock

                                                          Bed Rock (Old
                                                          Wave Cut
                                                          Platform)

Plate 10 Rock Pieces in Beach Rock, Smith Point

CONCLUSION
Large cyclones and storms have in the past, and will in the future continue to
impact on Cobourg Peninsula. Broken piece of laterite found in beach rock
around Smith Point provides evidence of past events (Plate 10). Disturbance
is a natural and important part of the coastal environment. Recovery of sandy
beaches can occur in relatively short period of time while recovery of
mangroves and terrestrial vegetation can take many years.

Many beaches suffered from erosion. Sand dragged offshore during the
cyclone is currently being moved back on shore. Large amount of mangrove
damage was observed within Caiman Creek which was under the direct path
of the cyclone. Mangrove recovery can be slow whilst some sites may never
recover as in Darwin Harbour after Cyclone Tracy.

Elevated water level is evident at all sites visited by the amount of shoreline
regression and coral pieces found on top of the cliffs at Table Head. In most
cases the shoreline has retreated leaving many large trees undermined or
completely uprooted.

Storm surge was also found at most sites, particularly lower lying areas of the
coast that had tidal swamps behind the dune system. In most cases sediment
lines were found up to 30 meters inland from the current high tide mark. With
the exception of a few mangrove species, much of the coastal and terrestrial
vegetation was completely defoliated and stripped of bark. Bark stripped from
trees can indicator Category 4 strength winds were experienced
(www.bom.gov.au/inside/services_policy/tc_ingrid/index). Sedimentation also
affected coastal vegetation. Mangrove covered by sediment can die.
However, at the time of site inspection mangroves covered by sediment were
still surviving.
                                                                                  7
Reference
http://www.bom.gov.au (May 2005)
8Appendix One
Updated Information
TROPICAL CYCLONE INGRID
6 TO 17 MARCH 2005
Summary | Track | Observations | Satellite Images | Radar Images | Impact Photos
Summary
(Note that this summary is based on preliminary information, and will be updated at a later
date when a more thorough analysis of data and impacts has been completed)
Severe Tropical Cyclone Ingrid caused significant impact on the Australian coast in March
2005. It was unusual in that it is the only cyclone in recorded history to impact, as a severe
tropical cyclone, on the coastline of three different States or Territories. It crossed the
Queensland east coast south of Lockhart River as a Category 4; impacted on Croker Island,
the Cobourg Peninsula and the Tiwi Islands in the Northern Territory as category four or five
cyclone; and finally impacted the West Australian Kimberly coast at Faraway Bay as a
Category 5 cyclone. (Note Category 5 is the strongest cyclone category).
Ingrid was a small cyclone in size, but very intense, not unlike Cyclone Tracy that devastated
Darwin in 1974. For this reason, communities more than 100 km from Ingrid's path (like
Darwin) were affected only slightly. Also, while some significant rainfall was reported, (eg
445mm in 24 hours at Emma Gorge in the Kimberley) the amounts were not as remarkable as
those reported after some other larger, but less intense cyclones in the past.
Large sea swells generated by the cyclone in the Coral Sea caused a boat to capsize near
Kerema in Papua New Guinea, resulting in the loss of five lives. Despite the widespread
impact area of this cyclone, and the wind strengths experienced, there have been no reports
of serious injury or death in Australia. Also, as the communities had all received good
warning, much preparation, including the clearing of loose materials around the populated
areas, reduced the final damage toll.Track
On 3 March a tropical low developed north of the Gulf of Carpentaria, then drifted eastwards
into the Coral Sea. It developed into a tropical cyclone on 6 March and turned back towards
the Queensland coast as it rapidly intensified, reaching Category 5 at 9am on 8 March. Over
the next week, the cyclone followed a relatively straight course to the west-northwest, then
west, albeit with an obvious oscillation in its movement. It crossed Cape York Peninsula into
the Gulf of Carpentaria on 10 March, temporarily weakening over land, but gathered strength
again as it headed for the NE corner of the Territory. It passed just north of Nhulunbuy on the
morning of 12 March, and then travelled along the north coast of the Top End and the Tiwi
Islands before moving offshore into the Timor Sea. At this stage, it changed direction towards
the southwest, ploughing into the Kimberley coast near Kalumburu on the evening of 15
March. It weakened as it moved inland, finally decaying below cyclone strength on the
morning of 17 March near Wyndham.
Impact
The cyclone crossed Cape York Peninsula at a remote location, avoiding the local townships
of Lockhart River and Coen, but vegetation was stripped bare near the crossing point. There
was a significant storm tide observed on the east coast.
Communities along the north coast of the Northern Territory were not so lucky. Widespread
tree damage and moderate damage to infrastructure was reported along the Arnhem Land
coast. Six ships in a local pearling fleet were sunk or damaged. Widespread damage was
reported at Croker Island, North Goulburn Island and over the Cobourg Peninsula, with
vegetation on the peninsula stripped of its leaves. The cyclone had weakened slightly before
reaching the Tiwi Islands, so damage to buildings was limited although vegetation, powerlines
and similarly exposed structures did suffer significant damage. Darwin was spared the major
wrath of the cyclone with gusty winds and rain only causing minor problems with unstable
trees.
In Western Australia, the cyclone devastated the remote resort of "Faraway Bay", northeast of
Kalumburu. Vegetation was stripped, and most of the buildings were destroyed. The
accompanying storm tide deposited boats about 100 metres inland and several metres above
the usual high tide mark. Luckily the resort was closed for the off-season and the caretakers
took shelter in a shipping container secured in concrete to withstand cyclones. At Kalumburu
several houses were unroofed but in general structures withstood the cyclone. Floodwaters
cut the Great Northern Highway near Kununurra and isolated some properties.
Rainfall
The map below shows rainfall during the week ending 9am on 18 March 2005. The effects of
Ingrid in the NT and WA can be seen. The cyclone had cleared Queensland at the beginning
of this period, however rainfall in Queensland due to the cyclone had been less significant.
10Observations summary
This information is unconfirmed and should be treated as preliminary.
Maximum Reported Wind Gust
207 km/h at McCluer Island, 03:40CST 13 March
174 km/h at Truscott, 03:40WST 16 March
148 km/h at Kalumburu, 01:30WST 16 March
Lowest Reported Pressure
967.4 hPa at Truscott, 04:30WST 16 March
973.6 hPa at Kalumburu, 02:40WST 16 March
974.5 hPa at McCluer Island, 03:20CST 13 March
Rainfall
438mm at Truscott in the 24 hours until 9am on 16 March, including 341.2mm in four hours
East Coast Landfall Parameters
When: 5:00am on Thursday 10 March (close to mid-tide)
Where: 60 km SSE of Lockhart River (near Bobardt Point)
Severity Category: 4
11Estimated Maximum Wind Gusts: 240 km/h
Estimated Central Pressure: 960 hPa
Estimated Storm Surge: several metres plus wave set-up of about 0.5 metre
Eye Radius: 15 km
Radius of Maximum Winds: 20 km
Radius of Very Destructive Winds: 25 km
Radius of Destructive Winds: 30 km
Satellite Images
Queensland, 08/03/05, 17:00EST WA/NT, 15/03/05, 10:00WST/11:30CST
Image from NOAA-12 satellite received and Image from NOAA-17 satellite received and
processed by Bureau of Meteorology courtesy processed by Bureau of Meteorology courtesy
of NOAA (USA). of NOAA (USA).
12Radar Images
Weipa radar at 07:30EST on March 10, 2005.
13Darwin radar at 16:00CST on March 13, 2005.
14Wyndham radar at 17:00WST on March 15, 2005.
15Gove radar at 00:30 CST on March 12, 2005
16Impact Photos
Click image for larger version and description.
17You can also read