Red snow occurrence in Eastern Europe. A case study
←
→
Page content transcription
If your browser does not render page correctly, please read the page content below
Red snow occurrence in Eastern
Europe. A case study
Joseph Barkan† and
Weather – Month 9999, Vol. 99, No. 99
Pinhas Alpert
Dept. Geophysics, Faculty of Exact
Sciences, Tel-Aviv University, Tel-Aviv,
Israel
Introduction
In the second half of March 2018, the
European media published in great headlines
Figure 3. Orange snow-blanketed parts of
a strange occurrence. Red-coloured snow fell Russia, Bulgaria, Ukraine, Romania and
in Bulgaria; Romania; Ukraine; and – what Figure 1. People skiing over orange snow that
is blanketing Eastern Europe. The Washington Moldova. The coloured snow is due to sand
most interested the media – in the moun- from the Sahara Desert storms mixing with
tains around Sochi (see ‘star’ in Figure 6), the Post, 26 March 2018 (Chiu, 2018).
snow and rain.
location of the former winter Olympic Games.
As a matter of fact, this is a rare phe-
nomenon but one that was noted even
in ancient times. Red rain occurrences
were mentioned by Livy, Cicero, Geoffrey
of Monmouth, Pliny the Elder and learned
monks in the early Middle Ages (White et al.,
2012; Mancini, 2018).
Causes of Red Snow
Red-coloured snow occurs for two reasons. The
first is activity of green algae, which usually Figure 4. Satellite picture of dust transport from
occurs in summer at high latitudes (Mancini, North Africa to Greece corresponding to Figure
Figure 2. As in Figure 1, another E. Europe 6(d). The image is taken from MODIS-TERRA on
2018) but is not a topic of interest here. The
location, The Washington Post, 26 March 2018 26 March 2018.
second is red snow as result of Saharan dust
(Chiu, 2018).
storms that can occur in any season.
Dust transport occurs when an active cold
trough in southern Europe with a strong sources: the National Centers for Environmental
southwesterly flow at its forward flank Prediction/National Center for Atmospheric
causes a dust storm in the western Sahara. Research (NCEP/NCAR) reanalysis (Kalnay
The southwesterly flow transports the result- et al., 1996), the Moderate Resolution
ing dust northwards as shown in Figures 3 Imaging Radiospectrometer (MODIS) on
and 4. After mixing with the cold air, the board the TERRA satellite and the Hysplit
dust colours the falling snow red. (Figures back trajectory model for 60h to show the Figure 5. MODIS Aerosol Optical Thickness
1 and 2) As a matter of fact, transportation origin of the dust. All the data from the (AOT) average over 30–40°E, 40–50°N, during
of Saharan dust occurs towards Europe and former two data sources were translated to 1–31 March 2018. PEAK AOT is observed on
eastern America and even further (Barkan et usable graphic form, for example, 700hPa 23 March, while the second maximum is on
al., 2004a,b; Barkan and Alpert, 2010, 2014). geopotential and vector form (not shown) 26/27 March. Note that the y-axis scale is
by the Grid Analysis and Display System shifted. It starts with the zero value and ends
at 3.5.
Methodology (GRADS) programme. The development
of the synoptic situation that eventually
In this study, to explain this outstand- caused the transportation of an unusually
ing phenomenon, we mainly used three large quantity of Saharan dust to south- Analysis
eastern Europe (Figures 3 and 4) and On 20 March, a trough extended from
†
Joseph Barkan died on 7 June 2019, and caused the colouration of the snow in the Scandinavia through the Gulf of Genoa
consent to publish this manuscript has been area will be discussed below with reference towards northern Africa. The next day,
given by his next-of-kin. to Figures 1 and 2. 21 March, it deepened and extended into 1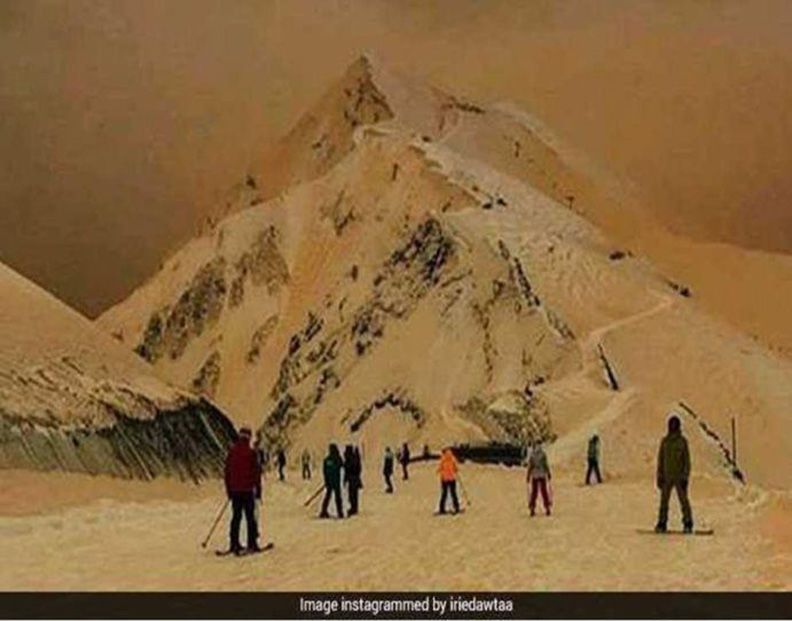
the Western Sahara and caused a huge
dust storm. At this stage, as can be seen
on the eastern flank of the trough, the dust
Red snow occurrence in Eastern Europe
began to be transported into the central
Mediterranean as shown in Figure 6(a).
On 22 March, the trough continued to
deepen. A closed low formed in it, and it
moved to the east.
The flow on the forward flank was defi-
nitely southwesterly, although it had not yet
reached the area we are interested in. This is
approximately shown by the Hysplit model
(Figure 6b).
The next day, the 23rd of the month, was
the crucial day for the area around Sochi.
Weather – Month 9999, Vol. 99, No. 99
The trough deepened further, moved fur-
ther eastwards and extended southward.
The southwesterly gradient steepened;
the flow was consequently stronger and
had the potential to lift dust (Barkan et al.,
2004b), which reached southeastern Europe
as can also be seen in the Hysplit model
(Figures 6 and 7).
We can use satellite imagery to track dust
plumes and their depth using the aerosol
optical thickness (AOT). AOT is the measure
of the column-integrated amount of the dif-
ferent aerosols when observing the Earth’s
surface from the satellite instrument. The
AOT is defined as the negative natural loga-
rithm of the fraction of light that is not scat-
tered or absorbed on a path. If this fraction
is less than about 36.7%, then optical depth
is above unity. High AOT values can reach 2,
and its scale runs from zero (aerosol-clean)
and higher. On 24 and 25 March, the trough
still existed in the central Mediterranean
and northern Africa, but the westerly
component of the flow became more pro-
nounced. Consequently, the transportation
of the dust to the Sochi area ceased, as can
be seen in Figure 1. Contrary to 23 March
with an AOT > 3, on these days, the AOT
was near zero (Figure 6c).
On 26 and 27 March (Figure 6d),
the trough weakened and somewhat
extended to the east, while its southern
part remained in the west. The closed low
disappeared. As a result, the flow along the
eastern flank of the trough again became
more southwesterly, although the gradi-
ent was much weaker than on the 23rd.
Consequently, some dust was again trans-
ported to the target area – although much
less than on the peak day. In Figures 5 and
6, it can be seen that, on these two days,
the AOT value rose to almost 1, contrast-
ing with the values of 24 and 25 March.
The Hysplit model also shows some trans-
portation from the Sahara towards the tar-
get area at heights between 1500m and
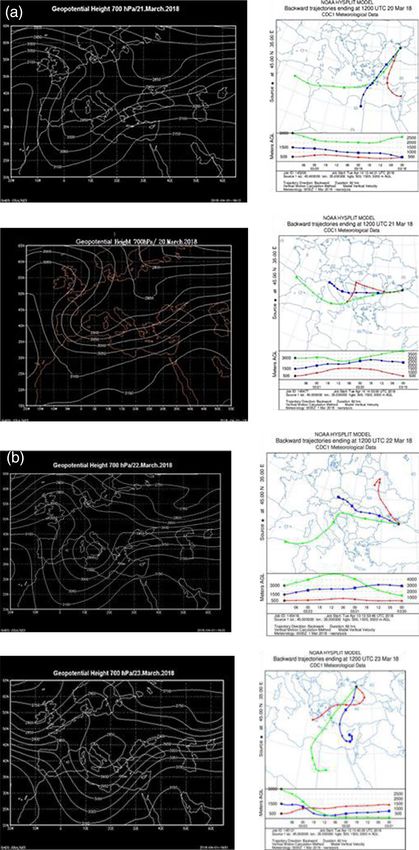
Figure 6. (a) Geopotential 700hPa, 20 (bottom left) and 21 (upper left) March 2018. Sixty-hour back 3000m (Figure 6d).
trajectories based on the Hysplit model are shown on the right panels ending at the Sochi point
(denoted by star) at altitudes of 500m (red), 1500m (blue) and 3000m (green). NOAA is acknowl-
edged for the data and model. (b) As in Figure 6(a) but on 22/23 March 2018. On 23 March 2018, Discussion
peak of AOD is found in the Red Snow square. Green back trajectory from Saharan surface to
700mb within 60 hours. (c) As in Figure 6(a) but on 24/25 March 2018. (d) As in Figure 6(a) but on The case of the coloured snow in south-
2 26/27 March 2018 eastern Europe became a great news item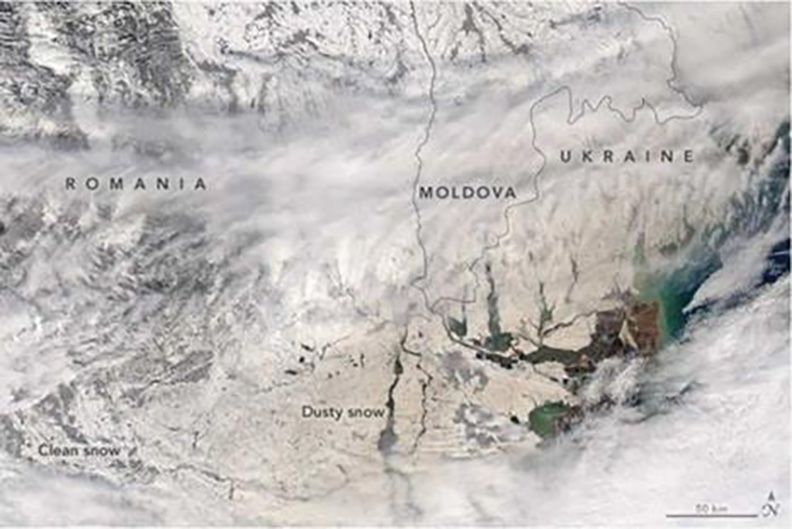
Red snow occurrence in Eastern Europe
Weather – Month 9999, Vol. 99, No. 99
Figure 7. Satellite picture of dust transport from
North Africa to Greece corresponding to Figure
6(d) on 26 March 2018.
almost every year. At the eastern flank of
the trough a strong south-southwesterly
flow develops, which transports the Saharan
dust to the north towards Europe. The
penetration of the dust depends on the
depth of the trough and, consequently, the
strength of the flow (Barkan et al., 2004a).
The development of troughs southwards
usually occurs along the western shores
of Europe or somewhat eastwards. As a
result, the dust is transported to western
or central Europe and the Mediterranean.
These areas are relatively warm, and snow
is rare.
In this case, the trough developed fur-
ther east, which is not a common occur-
rence. This caused significant dust storms
in the central Sahara near the amplest dust
sources (Barkan et al., 2004b). In addition,
the strong southwesterly flow along the
eastern flank of the trough reached Eastern
Europe, which is colder and snowier com-
pared with western Europe. So, there is a
high probability that the transported dust
reached the Sochi area together with snow
flakes and painted them with its colour, red
or brown.
Acknowledgements
We thank Ms Chiu and Mr Mancini for
the important and interesting information
and for the beautiful pictures in their arti-
cles. Their information is the basis of this
article. We also thank the Israel Science
Foundation (ISF) (grant no. 1123/17) for
partial support.
References
Barkan J, Alpert P. 2010. Synoptic
Figure 6. (c, d) (Continued). analysis of a rare event of Saharan dust
reaching the Arctic region. Weather, 65:
208–211.
in the European media because of its rarity et al., 2004a; Collaud Coen et al., 2004; Barkan J, Alpert P. 2014. A unique case-
and peculiarity. As a matter of fact, trans- Barkan and Alpert, 2010). Deep cold trough study of near-circular Saharan dust trans-
port over the Atlantic ocean. Atmos. Clim.
port of Saharan dust northwards is not a penetration from high latitudes southwards
Sci. 4: 164–170.
rare event at all (Dayan et al., 1991; Barkan towards western Africa occurs several times 3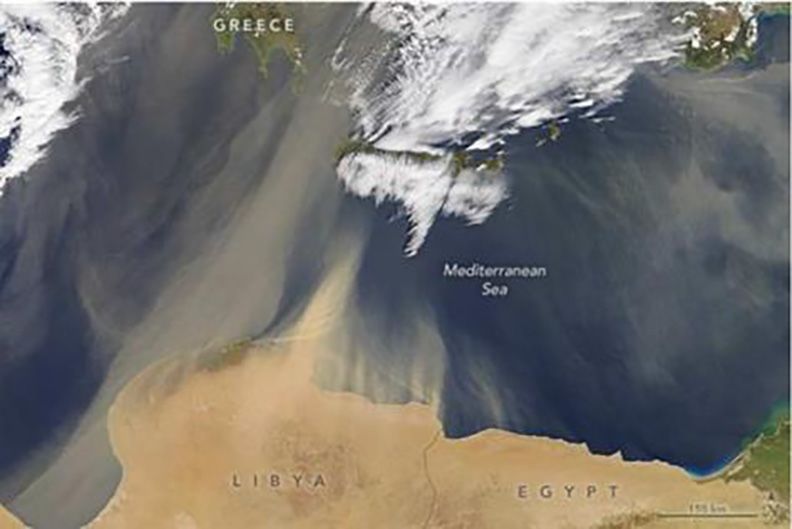
Barkan J, Alpert P, Kutiel H et al. 2004a. Jungfraujoch: detection by wavelength https://science.howstuffworks.com/nature/
The synoptics of dust transportation dependence of the single scattering albe- climate-weather/atmospheric/amazing-
days from Africa toward Italy and Central do and first climatology analysis. Atmos. and-alarming-science-behind-red-snow.
Red snow occurrence in Eastern Europe
Europe. J. Geophys. Res. 110: D07208. Chem. Phys. 4: 2465–2480. htm (accessed 1 December 2019).
doi:10.1029/2004JD005222. Dayan U, Hefter J, Miller J, Gutman G. 1991. White JR, Cerveny RS, Balling RC
Barkan J, Kutiel H, Alpert P. 2004b. Dust intrusion events into the Mediterranean Jr. 2012. Seasonality in European red
Climatology of dust sources in North Africa Basin. J. Appl. Meteorol. 30: 1185–1199. dust/“blood” rain events. Bull. Am.
and the Arabian peninsula, Based on TOMS Kalnay E, Kanamitsu M, Kistler R et al. Meteorol. Soc. 93(4): 471–476.
data. Indoor Built Environ. 13: 407–419. 1996. The NCEP/NCAR 40-year reanalysis
Chiu A. 2018. Orange snow blankets project. Bull. Am. Meteorol. Soc. 77(3): Correspondence to: P. Alpert
eastern Europe. There is an explanation, 437–472.
The Washington Post, 26 March 2018. Mancini M. 2018. The Amazing and pinhas@tauex.tau.ac.il
Collaud Coen E, Weingartner D, Schaub Alarming Science behind Red Snow. © 2019 Royal Meteorological Society
D et al. 2004. Saharan dust events at the Climate & Weather/Atmospheric Sciences.
doi:10.1002/wea.3644
Weather – Month 9999, Vol. 99, No. 99
Box 1 The late Dr Joseph Barkan
I knew Joseph Barkan since 1972 when I joined as a young weather
forecaster under his command. Joseph Barkan was a very experienced
weather forecaster and instructed several generations of young fore-
casters. I always admired him for being able to approach me in his
late 60s in order to complete a PhD in the Department of Geophysics,
Tel Aviv University. He did a comprehensive PhD study of the Saharan
dust sources based on Total Ozone Mapping Spectrometer (TOMS)
data and was jointly supervised by Prof. Haim Kutiel (Haifa University)
and myself. His dedication, for over 20 years, to do outstanding and
Dr Joseph Barkan accurate research on dust was much appreciated by the scientific
community. He continued his excellent studies in recent years on the synoptic con-
ditions related to dust transport and the aerosol characteristics especially over the
Mediterranean area. Many of his papers received worldwide attention and were fre-
quently cited. Dr Joseph Barkan, who was born in Budapest on 3 May 1934 and sur-
vived the Holocaust, passed away on 7 June 2019 and was still able, in his last week,
to provide me with his first response to the reviews of the current Red Snow paper.
Blessed be his memory.
Pinhas Alpert
4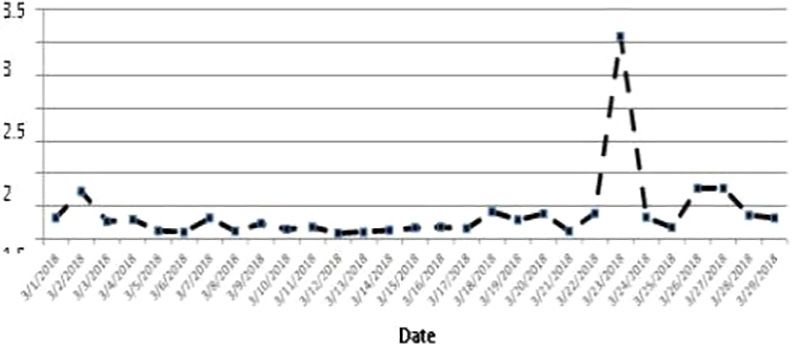
You can also read