SARS-COV-2 SEROPREVALENCE IN A RURAL AND URBAN HOUSEHOLD COHORT DURING FIRST AND SECOND WAVES OF INFECTIONS, SOUTH AFRICA, JULY 2020-MARCH 2021 - CDC
←
→
Page content transcription
If your browser does not render page correctly, please read the page content below
Article DOI: https://doi.org/10.3201/eid2712.211465 SARS-CoV-2 Seroprevalence in a Rural and Urban Household Cohort during First and Second Waves of Infections, South Africa, July 2020–March 2021 Appendix Supplementary Methods Study Population PHIRST-C (A Prospective Household study of SARS-CoV-2, Influenza, and Respiratory Syncytial virus community burden, Transmission dynamics and viral interaction in South Africa) is a continuation from PHIRST (A Prospective Household observational cohort study of Influenza, Respiratory Syncytial virus and other respiratory pathogens community burden and Transmission dynamics in South Africa) (1). PHIRST-C is conducted in two communities with established influenza-like illness and pneumonia surveillance sites (Appendix Figure 1). South Africa consists of nine provinces, which are divided into 52 districts, which form the second level of administration. Districts are further divided into municipalities. The rural site is located in the Bushbuckridge Municipality, Ehlanzeni District, Mpumalanga Province and forms part of a health and sociodemographic surveillance site (HDSS) at the Medical Research Council (MRC)/University of Witwatersrand Rural Public Health and Health Transitions Research Unit, Agincourt. During PHIRST, two of the 29 villages within the HDSS were selected according to convenience (proximity and burden of other studies within the site) each year between 2016–2018. A random selection of 50 households with a household size of 3 or more were approached for enrolment. The urban site is located in the Jouberton Township, Matlosana Municipality, Dr Kenneth Kaunda District, North West Province. A list of 450 global positioning system (GPS) coordinates were generated using Google Earth. Study staff approached the nearest house within 30 m of the coordinate point for enrolment. Approximately 50 households were enrolled each year during 2016–2018. At both sites, households were eligible if they consisted of 3 or more household members Page 1 of 12
(sharing at least four meals a week). All household members were approached for inclusion
in the study, and households were eligible for inclusion if >80% of members consented to be
enrolled.

 For PHIRST-C, all households who participated in PHIRST from the urban site, and
households from the 2017 and 2018 cohort in the rural site were approached for enrolment.
To supplement the sample size, additional households at each site were approached using the
same methods as for PHIRST. Villages in the rural site were restricted to those four used in
2017 and 2018 of PHIRST. Informed consent was obtained from participating adults or a
parent/guardian for children 18 years of age (Appendix Table 1). The City of Matlosana Municipality is considered to be
88.2% urban, and is located in the Dr Kenneth Kaunda District, which has a population of
797,715 (3). Sixty-five percent of the district population is aged >18 years (Appendix Table
1). At both sites, the percentage of children, females, and unemployed individuals were
higher in the cohort than in the district (Appendix Table 1).

Calculation of Infection-Case Ratio (ICR), Infection-Hospitalization Ratio (IHR), and Infection-
Fatality Ratio (IFR) by Wave of Infection

 We calculated the age-adjusted total number of infections, laboratory-confirmed
cases, hospitalizations, deaths, ICR (number of infections compared to laboratory-confirmed
cases), IHR and in-hospital and excess death IFR for each wave of infection as described in
below equations. We defined the first wave as March 1, 2020 (week 11) to November 21,
2020 (week 47), coinciding with the first case of SARS-CoV-2 reported in South Africa, and
ending the week before BD3 started. We defined the second wave as November 22, 2020
(week 48) to March 27, 2021 (week 11), starting directly after the defined wave 1 period, and
ending the week before BD5 started. Due to differences between the sex ratios of our cohort
and the district population, the infection estimates were also adjusted for sex. Data sources
used in these calculations are described in the next section. Age standardized estimates for
the selected endpoints for each wave were obtained as follows:

 Page 2 of 12
∑ ( × )
 = × 100,000
 ∑ ( )

 Where si is the seroprevalence in the cohort in the respective community and wave for
age and sex group i and pi(SA) is the South African population for age and sex group i.
Calculated for wave 1 as seroprevalence at blood draw 3, and for wave 2 as seroprevalence at
blood draw 5, excluding those who seroconverted at blood draw 3. Estimates only included
participants with a blood draw 3 and 5 pair, and adjusted for sensitivity and specificity of test
(4).

 ∑ (( ÷ ( ) ) × ( ) )
 − = × 100,000
 ∑ ( ( ) )

 Where ci is the number of laboratory-confirmed cases (RT-PCR and antigen-based
tests) from the respective district reported to the NMCSS (wave 1: 3 March – 21 November
2020, wave 2: 22 November 2020 – 27 March 2021) in age group i, pi(d) is the district
population for age group i and pi(SA) is the South African population for age group i.

 ∑ ((ℎ ÷ ( ) ) × ( ) )
 = × 100,000
 ∑ ( ( ) )

 Where hi is the number of hospitalizations from the respective district reported to
COVID-19 Sentinel Hospital Surveillance (DATCOV, wave 1: 5 March – 21 November
2020, wave 2: 22 November 2020 – 27 March 2021) (5) in age group i, pi(d) is the district
population for age group i and pi(SA) is the South African population for age group i.

 ∑ (( ÷ ( ) ) × ( ) )
 − ℎ ℎ = × 100,000
 ∑ ( ( ) )

 Where di is the number of in-hospital deaths from the respective districts reported to
DATCOV (wave 1: 5 March–21 November 2020, wave 2: 22 November 2020–27 March
2021) (5) in age group i, pi(d) is the district population for age group i and pi(SA) is the South
African population for age group i.

 ( 0.85) × ( )
 ℎ = × 100,000
 ( )

 Where ExD is the rate of provincial excess deaths adjusted to the South African
population reported by South African Medical Research Council (rural wave 1: 28 June–21
November 2020, urban wave 1: 21 June–21 November 2020, both communities wave 2: 22

 Page 3 of 12
November 2021–26 March 2021) (6), and p(SA) is the total South African population.
According to estimates only 85% of excess deaths are attributable to COVID-19 (6).

 For infections, hospitalizations, in-hospital (minimum) and excess (maximum) deaths,
95% CIs were calculated using the Clopper-Pearson method with a Poisson distribution.

 −
 − ( ) = 100

 − ℎ ( ) = 100

 ℎ
 − ( ) = 100

 Confidence intervals for infection ratios were calculated as ratios from the 95%
confidence intervals of infection, hospitalization and death rates. For international
comparisons, we repeated the calculations to standardize to the WHO standard world
population (7), using Sprague multipliers (8) to expand age groups to 1-year bands, and
aggregate to the age groups used in this study.

Data Sources

 Population Denominators (9)

 Population numbers for each district, by age, were obtained from the StatsSA 2020
mid-year population estimates for 2020.

 Notifiable Medical Conditions Surveillance System (NMCSS) (10)

 Reverse transcription PCR (RT-PCR) testing in South Africa to detect SARS-CoV-2
RNA started on 28 January 2020. Rapid SARS-CoV-2 antigen testing was implemented in
November 2020. All laboratories in the private and public sector performing SARS-CoV-2
tests automatically feed testing data from their lab information systems to the NMCSS, from
where daily and weekly reporting on national, provincial and district SARS-CoV-2 infections
are performed. No serology tests are used for this reporting. Results from antigen tests may
be underestimated in the NMCSS. The number of cases reported to the NMCSS in the
Ehlanzeni District (rural community) and Dr Kenneth Kaunda District (urban community)
was used as an estimate of reported, laboratory-confirmed SARS-CoV-2 infections. Wave 1:
3 March 1 November 2020, wave 2: 22 November 2020–27 March 2021.

 Page 4 of 12
COVID-19 National Hospital Surveillance (DATCOV) (5)

 DATCOV is a national hospital surveillance system to which all hospitals where
COVID-19 admissions occurred in the public and private sector in South Africa report to.
The case definition includes any person admitted with a positive RT-PCR test result for
SARS-CoV-2. In-hospital outcome was available for all patients. The total number of
hospitalizations and in-hospital deaths in each district reported to DATCOV between 3
March –21 November 2020 (wave 1) and 22 November 2020–27 March 2021 (wave 2) was
used to calculate in the IHR and minimum IFR, respectively.

 South African Medical Research Council (SAMRC) Report on Weekly Deaths (6)

 The Burden of Disease Unit at the SAMRC produces a weekly report on excess
deaths in South Africa. Deaths in South Africa are registered on the Department of Home
Affair’s National Population Register and includes all citizens with a South African
identification number. The number of excess deaths were defined as the number of all-cause
deaths in that week minus the number of deaths expected for the week based on 2014–2019
trends. Excess death estimates are adjusted for incomplete reporting, and death estimates in
provinces are age-standardized to the national population. Eighty-five percent of the reported
excess deaths were used to calculate the maximum IHR. In both provinces, excess deaths
were only available starting 21 June (urban) and 28 June 2020 (rural), and not from March as
for infections and hospitalizations, therefore the period for wave 1 in the rural community
was defined as 28 June –21 November 2020, and as 21 June–21 November 2020 in urban
communities for wave 1. For both communities wave 2 was defined as 22 November 2021–
26 March 2021. The wave-specific excess death rates were kindly provided by Professor Rob
Dorrington.

Differences in SARS-CoV-2 Seroprevalence by HIV Status and Age

 To assess differences in seropositivity based on HIV status, we considered
seroprevalence at the fifth blood draw and compared the seroprevalence of individuals at
each site and age group by HIV status using the Pearson’s chi-squared test, and furthermore
also compared the seroprevalence by HIV status while controlling for site, sex and age using
logistic regression. We calculated power using the two-sample proportion, likelihood-ratio
test for a 95% CI, to detect an odds ratio of at least 1.8, assuming a 24% SARS-CoV-2
seroprevalence and 14% HIV prevalence. In the 19–34 year old group (n = 247) we only had
33% power.

 Page 5 of 12
References

1. Cohen C, Kleynhans J, Moyes J, McMorrow ML, Treurnicht FK, Hellferscee O, et al.; PHIRST
 Group. Asymptomatic transmission and high community burden of seasonal influenza in an
 urban and a rural community in South Africa, 2017–18 (PHIRST): a population cohort study.
 Lancet Glob Health. 2021;9:e863–74. PubMed https://doi.org/10.1016/S2214-
 109X(21)00141-8

2. Bushbuckridge Local Municipality. Bushbuckridge Local Municipality final integrated
 development plan 2020/21. 2020 [cited 2021 Feb 16].
 https://www.cogta.gov.za/cgta_2016/wp-content/uploads/2021/02/Bushbuckridge-
 Municipality.pdf

3. City of Marlosana. Matlosana spatial development framework. 2009 [cited 2021 Feb 16].
 http://www.matlosana.gov.za/Documents/Policies/SPLUMA/SDF%20FRAMEWORK%2020
 09.pdf

4. Larremore DB, Fosdick BK, Bubar KM, Zhang S, Kissler SM, Metcalf CJE, et al. Estimating
 SARS-CoV-2 seroprevalence and epidemiological parameters with uncertainty from
 serological surveys. eLife. 2021;10:e64206. PubMed https://doi.org/10.7554/eLife.64206

5. National Institute for Communicable Diseases. COVID-19 sentinel hospital surveillance update,
 week 18. 2021 May 14 [cited 2021 May 22]. https://www.nicd.ac.za/wp-
 content/uploads/2021/05/NICD-COVID-19-Weekly-Sentinel-Hospital-Surveillnace-update-
 Week-18-2021.pdf

6. South African Medical Research Council. Report on weekly deaths in South Africa, week 18. 2021
 May 10 [cited 2021 May 22]. https://www.samrc.ac.za/reports/report-weekly-deaths-south-
 africa

7. Ahmad OB, Boschi-Pinto C, Lopez AD, Murray CJ, Lozano R, Inoue M. Age standardization of
 rates: a new WHO standard. 2001 [cited 2021 May 5].
 https://www.who.int/healthinfo/paper31.pdf

8. Shryock HS, Larmon EA, Siegel JS; US Department of Commerce, Bureau of the Census. The
 methods and materials of demography. Washington: US Government Printing Office; 1980.

9. Statistics South Africa. Statistical release P0302: mid-year population estimates 2020. 2020 [cited
 2021 May 14]. http://www.statssa.gov.za/?page_id=1854&PPN=P0302&SCH=72634

10. National Institute for Communicable Diseases. COVID-19 weekly epidemiology brief, week 19.
 2021 May 22 [cited 2021 May 22]. https://www.nicd.ac.za/wp-
 content/uploads/2021/05/COVID-19-Weekly-Epidemiology-Brief-week-19-2021.pdf

 Page 6 of 12
Appendix Table 1. Comparison of characteristics between district (Ehlanzeni and Dr Kenneth Kaunda Districts) (9) and
PHIRST-C cohort population, 2020, South Africa.
 Rural community Dr Kenneth Kaunda Urban community
 Characteristic Ehlanzeni District cohort p-value Districts cohort p-value
 Age group, y
Appendix Table 4. SARS-CoV-2 seroprevalence from the fifth blood collection (22 March – 11 April 2021), by site, age group
and HIV status, South Africa
 Rural Urban
 Age group, y HIV-uninfected HIV-infected p-value HIV-uninfected HIV-infected p-value
 60 6/27 (22) 4/10 (40) 0.28 17/46 (37) 1/7 (14) 0.24
 All ages 113/476 (24) 26/78 (33) 0.07 165/415 (40) 40/81 (49) 0.11

Appendix Table 5. Comparison of participants with detectable SARS-CoV-2 antibodies at the fifth blood collection (22 March–
11 April 2021), South Africa*
 Characteristic Seropositive Multivariable aOR (95% CI)
 Site
 Rural 150/587 (26) Referent
 Urban 209/510 (41) 1.9 (1.5–2.5)
 Sex
 Male 130/441 (29) Referent
 Female 229/656 (35) 1.2 (0.9–1.6)
 Age group, y
 60 28/95 (29) 1.5 (0.8–2.9)
 HIV status
 Negative 278/891 (31) 1.0 (0.7–1.5)
 Positive 66/159 (42) Referent
*aOR: adjusted odds ratio.

 Page 8 of 12
Appendix Table 6. Comparison of participants with detectable SARS-CoV-2 antibodies after the first wave (blood draw 3) and second wave (blood draw 5), by site, July 2020–April 2021, South
Africa*
 Rural Urban
 No. (%) No. (%)
 Age group,y Sero+ B3 Sero+ B5 Infected wave 2 OR (95% CI Sero+ B3 Sero+ B5 Infected wave 2 OR (95% CI)
 60 4/41 (10) 10/41 (24) 6/10 (60) 0.6 (0.1–2.6) 10/41 (24) 18/53 (34) 11/18 (61) 5.8 (1.9–17.8)
* OR: odds ratio; Sero+: seropositive.

 Page 9 of 12
Appendix Table 7. Comparison of individuals with and without a blood draw 3 and 5 pair, South Africa*
Characteristic Missing 3,5 pair Univariate OR (95% CI)
Site
 Rural 115/668 (17) 1.0 (0.8–1.4)
 Urban 99/598 (17) Referent
Sex
 M 85/503 (17) 1.0 (0.7–1.3)
 F 129/763 (17) Referent
Age group, y
 60 17/111 (15) 1.5 (0.8–2.8)
HIV status
 Negative 112/968 (12) Referent
 Positive 22/178 (12) 1.1 (0.7–1.8)
*OR: odds ratio.

Appendix Table 8. The PHIRST-C Group
Name Affiliation
Amelia Buys Centre for Respiratory Diseases and Meningitis, National Institute for Communicable Diseases of the National
 Health Laboratory Service, Johannesburg, South Africa.
Anne von Gottberg Centre for Respiratory Diseases and Meningitis, National Institute for Communicable Diseases of the National
 Health Laboratory Service, Johannesburg, South Africa. School of Pathology, Faculty of Health Sciences,
 University of the Witwatersrand, Johannesburg, South Africa.
Cheryl Cohen Centre for Respiratory Diseases and Meningitis, National Institute for Communicable Diseases of the National
 Health Laboratory Service, Johannesburg, South Africa. School of Public Health, Faculty of Health Sciences,
 University of the Witwatersrand, Johannesburg, South Africa.
F. Xavier Gómez- MRC/Wits Rural Public Health and Health Transitions Research Unit (Agincourt), Faculty of Health Sciences,
Olivé School of Public Health, University of the Witwatersrand, Johannesburg, South Africa.
Floidy MRC/Wits Rural Public Health and Health Transitions Research Unit (Agincourt), Faculty of Health Sciences,
Wafawanaka School of Public Health, University of the Witwatersrand, Johannesburg, South Africa.
Jackie Kleynhans Centre for Respiratory Diseases and Meningitis, National Institute for Communicable Diseases of the National
 Health Laboratory Service, Johannesburg, South Africa. School of Public Health, Faculty of Health Sciences,
 University of the Witwatersrand, Johannesburg, South Africa.
Jacques du Toit MRC/Wits Rural Public Health and Health Transitions Research Unit (Agincourt), Faculty of Health Sciences,
 School of Public Health, University of the Witwatersrand, Johannesburg, South Africa.
Jinal N. Bhiman Centre for Respiratory Diseases and Meningitis, National Institute for Communicable Diseases of the National
 Health Laboratory Service, Johannesburg, South Africa. School of Pathology, Faculty of Health Sciences,
 University of the Witwatersrand, Johannesburg, South Africa.
Jocelyn Moyes Centre for Respiratory Diseases and Meningitis, National Institute for Communicable Diseases of the National
 Health Laboratory Service, Johannesburg, South Africa. School of Public Health, Faculty of Health Sciences,
 University of the Witwatersrand, Johannesburg, South Africa.
Kathleen Kahn MRC/Wits Rural Public Health and Health Transitions Research Unit (Agincourt), Faculty of Health Sciences,
 School of Public Health, University of the Witwatersrand, Johannesburg, South Africa.
Kgaugelo Patricia Perinatal HIV Research Unit (PHRU), University of the Witwatersrand, Johannesburg, South Africa.
Kgasago
Limakatso Lebina Perinatal HIV Research Unit (PHRU), University of the Witwatersrand, Johannesburg, South Africa.
Linda de Gouveia Centre for Respiratory Diseases and Meningitis, National Institute for Communicable Diseases of the National
 Health Laboratory Service, Johannesburg, South Africa.
Maimuna Carrim Centre for Respiratory Diseases and Meningitis, National Institute for Communicable Diseases of the National
 Health Laboratory Service, Johannesburg, South Africa.
Meredith L. Influenza Division, Centers for Disease Control and Prevention, Atlanta, Georgia, United States of America.
McMorrow Influenza Program, Centers for Disease Control and Prevention, Pretoria, South Africa.
Mignon du Plessis Centre for Respiratory Diseases and Meningitis, National Institute for Communicable Diseases of the National
 Health Laboratory Service, Johannesburg, South Africa.
Neil A. Martinson Perinatal HIV Research Unit (PHRU), University of the Witwatersrand, Johannesburg, South Africa. Johns
 Hopkins University Center for TB Research, Baltimore, Maryland, United States of America.
Nicole Wolter Centre for Respiratory Diseases and Meningitis, National Institute for Communicable Diseases of the National
 Health Laboratory Service, Johannesburg, South Africa. School of Pathology, Faculty of Health Sciences,
 University of the Witwatersrand, Johannesburg, South Africa.
Retshidisitswe Centre for Respiratory Diseases and Meningitis, National Institute for Communicable Diseases of the National
Kotane Health Laboratory Service, Johannesburg, South Africa. School of Pathology, Faculty of Health Sciences,
 University of the Witwatersrand, Johannesburg, South Africa.
Stefano Tempia Influenza Division, Centers for Disease Control and Prevention, Atlanta, Georgia, United States of America.
 Influenza Program, Centers for Disease Control and Prevention, Pretoria, South Africa. School of Public
 Health, Faculty of Health Sciences, University of the Witwatersrand, Johannesburg, South Africa.
 MassGenics, Atlanta, Georgia, United States of America.
Stephen Tollman MRC/Wits Rural Public Health and Health Transitions Research Unit (Agincourt), School of Public Health,
 Faculty of Health Science, University of the Witwatersrand.
Tumelo Moloantoa Perinatal HIV Research Unit (PHRU), University of the Witwatersrand, Johannesburg, South Africa.

 Page 10 of 12
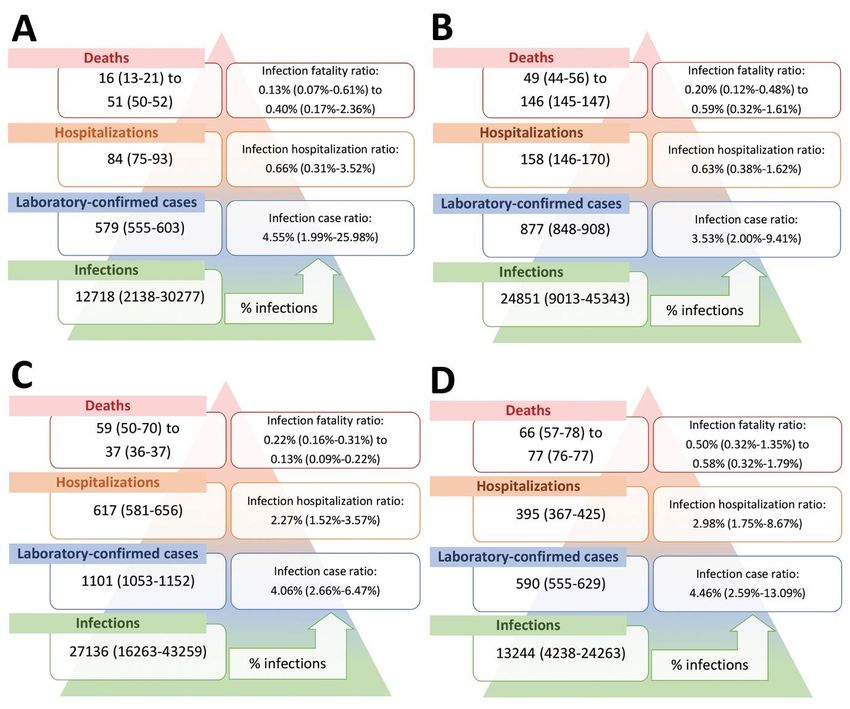
Appendix Figure 1. Location of study sites PHIRST-C, South Africa. The rural site is located in
Agincourt, Ehlanzeni District (dark green), Mpumalanga Province (light green) and the urban site in
Jouberton, Dr Kenneth Kaunda District (dark orange), North West Province (light orange).

 Page 11 of 12
Appendix Figure 2. World Health Organization population age-standardized SARS-CoV-2 infection,
diagnosis, hospitalization and deaths per 100,000 population in a rural community during A) wave 1
and B) wave 2, and urban community during C) wave 1 and D) wave 2 of infections, South Africa,
March 2020‒March 2021.

 Page 12 of 12
You can also read