Preliminary High-Temperature Tests of Textile Reinforced Concrete (TRC)
←
→
Page content transcription
If your browser does not render page correctly, please read the page content below
Proceedings

Preliminary High-Temperature Tests of Textile
Reinforced Concrete (TRC) †
Panagiotis Kapsalis 1,2,*, Tine Tysmans 1, Svetlana Verbruggen 1 and Thanasis Triantafillou 2
 1 Department of Mechanics of Materials and Constructions, Vrije Universiteit Brussel, 1050 Ixelles, Belgium;
   Tine.Tysmans@vub.be (T.T.); Svetlana.Verbruggen@vub.be (S.V.)
 2 Department of Civil Engineering, Structural Materials Laboratory, University of Patras, 26504 Rio, Greece;

   ttriant@upatras.gr
 * Correspondence: Panagiotis.Kapsalis@vub.be; Tel.: +32-489-180-273
 † Presented at the 18th International Conference on Experimental Mechanics (ICEM18), Brussels, Belgium,
   1–5 July 2018.

 Published: 29 June 2018

 Abstract: Fire-testing of Textile Reinforced Concrete (TRC) is an interesting field in which quite
 limited research has been conducted so far. In this paper some preliminary tests are presented,
 where mortars used as binders are heated to 850 °C and their residual strength is tested, while the
 Ultrasonic Pulse Velocity (UPV) is also measured, before and after heating, and compared.
 Additionally, TRC specimens are subjected to flame exposure with a simple set-up and the residual
 strength is also tested by flexural tests. It is concluded that even with simple set-ups, interesting
 results can be obtained regarding the structural degradation of the material.

 Keywords: fire tests; textile reinforced concrete

1. Introduction
      Textile Reinforced Concrete (TRC) is a composite material which constitutes a novel structural
system with enormous potential in construction. The main difference of this system with traditional
steel reinforced concrete is that the bulky steel reinforcement has been replaced by lightweight
textiles, usually made of glass or carbon fibres. This offers the opportunity to manufacture thin (thus
lightweight) structural elements with a high structural performance, since (i) the thick concrete cover
is no longer necessary; (ii) the textiles are thinner and lighter than the steel rebars; (iii) the thin fibers
have a very high tensile strength.
      A possible disadvantage of TRC construction lies on the fact that the thinner elements are less
capable to bear the same loads when combined with fire loading. The thin cover and the poor fire
behaviour of the commonly used glass fibers in construction lead to a potentially low fire resistance
and may become critical in the design of a structural element with fire-safety requirements.
      Even though the structural properties of TRC have been widely studied in the past two decades,
there is not sufficient knowledge on the fire behaviour. Most of the existing publications on the high-
temperature effect on TRC concern the application of TRC on an existing substrate (concrete or
masonry) and investigate the effect of temperature on the effectiveness of the strengthening system
or the bond between the substrate and the TRC (e.g., [1,2]). Also, most publications that study the
high-temperature effect on TRC, either discuss tests on temperatures lower than 800 °C (e.g., [3];
according to standardized fire curves [4] the temperatures developed in case of a common fire event,
exceed 800 °C within 30 min of exposure and 1000 °C within 90 min of exposure), and/or discuss tests
on TRC with non-common types (other than glass or carbon) of fibers for construction (e.g., [5]). The
difficulty of performing fire-tests and simulating real fire cases might be one reason for the lack of
studies on this topic.
Proceedings 2018, 2, 522; doi:10.3390/ICEM18-05416                           www.mdpi.com/journal/proceedings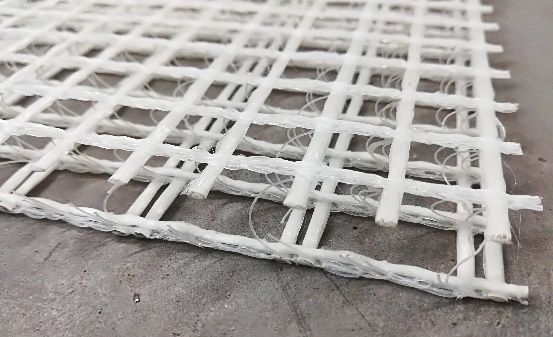
Proceedings 2018, 2, 522 2 of 6
Thus, it is necessary that further work must be done towards testing and evaluating the
performance of commonly used TRC under fire loading. This paper presents some preliminary tests
of TRC that were performed using simple tools and equipment that is easily available and has the
potential to provide useful results with the right set-up.
2. Materials and Methods
The materials used for this study are commercially available and they are described in this
section.
The reinforcement was a three-dimensional, alkali-resistant glass (3D AR-glass) fiber textile (see
Figure 1). The mesh size differed among the two perpendicular directions and among the two faces,
varying between 9 and 18 mm. However, the cross-sectional area of the reinforcement was equal in
both faces; 70.5 mm2 lengthways and 71.6 mm2 crossways. The weight of the textile before finishing
is 917 g/m2 and the tensile strength is equal to 1200 MPa, according to the manufacturer. The distance
between the two faces is 12 mm.
Figure 1. Three-dimensional AR-glass fiber reinforcement.
Two different mortars (M1 and M2) were used, both with very good self-flowing properties
(low-viscosity), ideal for casting TRC specimens as they can easily be poured through the 3D
reinforcement. They both consist of cement, sand and additives not specified by the manufacturers.
The known differences about their composition are the different kind of sand and the different
amount of water in the mixture. Specifically, mortar M1 consists of siliceous sand and 1 kg of dry
mortar is mixed with 0.15 L of water, while mortar M2 consists of quartz sand and 1 kg of dry mortar
is mixed with 0.13 L of water.
Two different series of tests have been conducted in this study, so far:
The first test series consists of compression, flexure and Ultrasonic Pulse Velocity (UPV) tests on
mortars, before and after heating to 850 °C. The temperature was chosen to be equal to 850 °C, as this
is the temperature that corresponds to 30 min of exposure to a typical cellulosic fire, according to [4].
The heating was achieved with a small furnace which has the potential to reach temperatures above
1000 °C. The temperature was measured and monitored by the furnace’s controller but additional
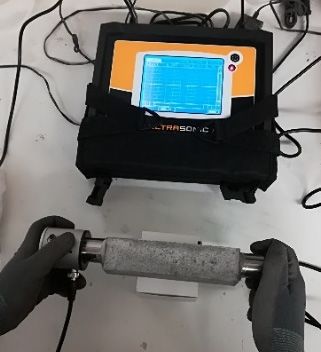
thermocouples to verify the measurements were used as shown in Figure 2a.
The tests were conducted on cubic (40 mm) and prismatic specimens (160 × 40 × 40 mm). Six
cubic and six prismatic specimens were made from each mortar, M1 and M2. Three cubes were tested
in compression without being exposed to high temperature and three after exposure. Moreover, three
prismatic specimens were tested in 3-point bending before and three after exposure to high
temperature. UPV measurements were conducted to all specimens (cubes and prisms from M1 and
M2) before and after the heat treatment. All these tests are shown in Figure 2b–d.
In the second test series burning tests on tile specimens of TRC were conducted using a simple
gas burner. Two tiles 400 × 400 mm and 22 mm thick were made, one from mortar M1 and one layer
of the available 3D textile, and one from mortar M2 and one layer of the same textile. The textile was
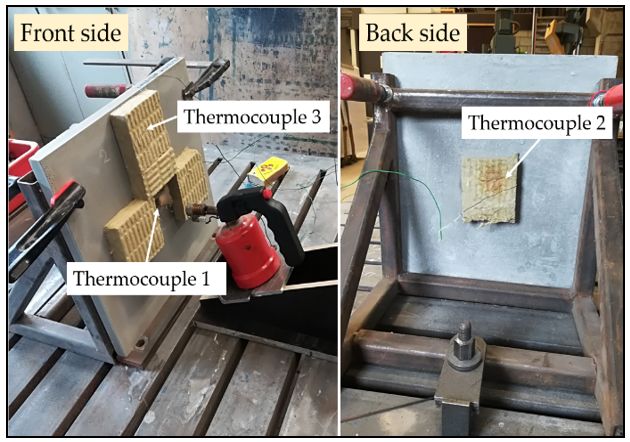
placed in the middle of the tiles so that the cover was equal to 5 mm in all cases. As seen Figure 3a,
the tiles were fixed with a simple set-up on a vertical position and a flame was applied at the center
with a gas burner. The temperature was measured using K-type thermocouples, at three different
points: (1) at the center of the front face (where the flame was directly applied); (2) at the center of the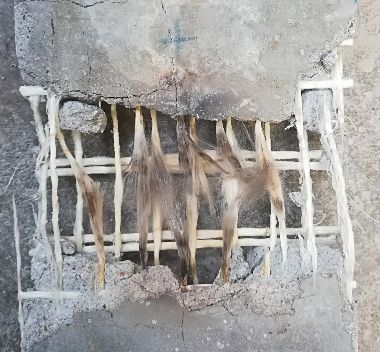
Proceedings 2018, 2, 522                                                                                          3 of 6

back face and (3) at 160 mm away from the center at the front face. The first thermocouple was
exposed directly to the applied flame. The other two were placed in order to measure the temperature
of the TRC and thus, they were covered with a flame resistant, thermal insulating product of mineral
wool (so that the measurement was not affected by the air temperature). All thermocouples were
fixed into position using a fire resistant and highly thermally conductive commercial mortar.
     The temperature measurements were read in real-time and, thus, the distance of the gas burner
from the tile and the intensity of the flame were adjusted during the test, so that the temperature
applied at the center of the front face (on thermocouple 1) would follow the standard cellulosic fire
curve, according to EN1363 [4].
     After the test was finished, the specimens were left to cool down naturally and one day later
three specimens (strips of 105 mm width) were cut from each tile using a diamond saw [see Figure
3(b-top)]. One specimen was cut from the center (area exposed to the high temperature) and two
specimens were cut from the edges of the tiles (not exposed to high temperature—the temperature
did not raise above ambient, according to the measurements obtained from thermocouple 2, which
was placed 160 mm away from the center). Those specimens were then subjected to four-point
bending tests as shown in Figure 3(b-bottom).

               (a)                         (b)                          (c)                         (d)
      Figure 2. Test series 1; (a) Specimens and thermocouples inside the furnace; (b) compression tests on
      cubic specimens; (c) three-point bending tests on prismatic specimens; (d) UPV measurement.

                                    (a)                                                       (b)
      Figure 3. (a) Set-up of gas-burning tests on TRC tiles; (b-top) Three specimens cut from each tile, after
      the fire-exposure; (b-bottom) Four-point bending tests on specimens cut from the tiles.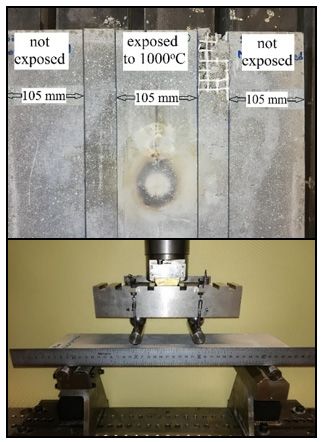
Proceedings 2018, 2, 522                                                                                               4 of 6

3. Results and Discussion

3.1. High Temperature Effect on Mortars
      Hereby, the results from the first series of tests are presented. Figure 4 gives the results of the
UPV measured from all cubic and prismatic specimens. Each bar represents the average value of
three identical specimens. It is clear that the decrease of the UPV is approximately equal to 60% in
both mortars, but the point of interest is the residual strength of the material. However, the authors
did not manage to find a predictive model in current literature that would relate the UPV value to
the expected compressive strength of mortars with the same characteristics. As shown in [6],
characteristics such as cement type, aggregates type, maximum grain size, water to cement ratio and
additives play a significant role in the correlation between the UPV value and the elastic properties
and strength of concrete. Thus, a different calibration curve needs to be defined for each case. There
is, nonetheless, a clear indication about the degradation of the mortars.
      In Figure 5 it is observed that the loss of strength (compressive and flexural) varies between 70%
and 82%, which is considered rather severe. It is, therefore, expected that in a case of a real fire, where
the heating rate is much faster in the first minutes (20 °C to 530 °C in 3 min, which could not be
reproduced by the furnace that was used for these tests) and for an exposure longer than 30 min
(which means temperature higher than 850 °C) the degradation of the mortar will probably be too
severe. Of course, further tests, need to be done, with more representative conditions.

                                prismatic specimens                             5           cubic specimens
                                                                 UPV (km/sec)

                  5
   UPV (km/sec)

                  4                                                             4
                  3                                                             3
                                    63%               57%                       2            60%              61%
                  2
                  1                                                             1
                  0                                                             0
                                   M1              M2                                      M1               M2
                               Not exposed    Exposed                                    Not exposed   Exposed

              Figure 4. Ultrasonic Pulse Velocity measured on specimens of mortars M1 and M2, before and after
              exposure to 850 °C. Comparisons and percentages of decrease.

                          12                                                        80
                                                                strength (MPa)

                          10
      Flexural strength

                                                                 Compressive

                                                                                    60
                           8
                           6                                                        40
            (MPa)

                           4                                                                    70%              81%
                                      82%             82%                           20
                           2
                           0                                                        0
                                     M1            M2                                         M1             M2
                                Not exposed    Exposed                                   Not exposed    Exposed

              Figure 5. Compression and three-point bending test results of mortars M1 and M2, before and after
              exposure to 850 °C. Comparisons and percentages of decrease.

3.2. Fire Testing Effect on TRC
       In the following Figure 6, the recordings measured from the thermocouples during the flame-
exposure tests on Tile 1 and Tile 2 are given. What can be observed is that even with this simple set-
up the standard fire curve [4] could be simulated quite accurately (although only at a narrow area at
the center of the tiles). It is also observed that the temperature measured by thermocouple 2 (ThC2,
center of back face) is almost parallel to the temperature applied at the center of the front face, and it
is quite important to note that the difference between ThC1 and ThC2 varies between the two mortars;
it is close to 750 °C for mortar M1 and close to 600 °C for M2. Therefore, mortar M1 is less thermally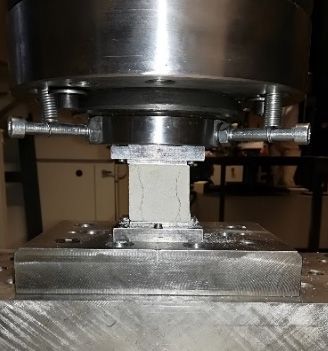
Proceedings 2018, 2, 522                                                                                                                                  5 of 6

conductive, even though they both present a relatively low thermal conductivity (temperature
difference in the order of 600–800 °C by a thickness of only 22 mm).
     What was also observed on the two tiles is that cracks were formed, as marked on Figure 7a. All
cracks were propagating to the center. The damage of the fibers near the central area where the flame
was applied is visible in Figure 7b,c. It should be noted that the textiles were revealed by removing
the mortar after testing the specimens in four-point bending. The results of the bending tests on
exposed and not-exposed specimens are shown in Figure 8.

                 1000                       Tile 1 (mortar M1)                                            1000        Tile 2 (mortar M2)
                                                                                                           800

                                                                                       Temperature (oC)
                     800
  Temperature (oC)

                     600                                                                                   600

                     400                                                                                   400
                     200                                                                                   200
                          0                                                                                  0
                                    0               20           40            60                                0         20              40            60
                                                         Time (min)                                                             Time (min)
                           ThC1              ThC2          ThC3       standard curve                        ThC1        ThC2      ThC3          standard curve

                     Figure 6. Recordings of thermocouples 1,2 and 3 (ThC1, ThC2, ThC3 respectively) during the flame-
                     exposure testing of the tiles; comparison with standard fire curve [4].

                                              (a)                                   (b)                                              (c)
                     Figure 7. (a) Cracking of the tiles exposed to a flame at their center; (b,c) Damage of the glass textiles
                     due to fire exposure for Tiles 1 and 2, respectively.

                                    4                                                                       4
                                             Specimens from Tile 1                                                   Specimens from Tile 2
                                    3                                                                       3
                                                                                          Force (kN)
                       Force (kN)

                                    2                                                                       2

                                    1                                                                       1

                                    0                                                                       0
                                        0       5      10     15               20                                0      5      10     15            20
                                               Displacement (mm)                                                       Displacement (mm)

                     Figure 8. Force displacement curves obtained from four-point testing of specimens cut from Tiles 1
                     and 2.

     As seen at the graphs presented in Figure 8, the maximum load and displacement of the fire
exposed specimens, has decreased more significantly for the tile specimen of mortar M1. It is also
observed from Figure 7 that the fibers of the specimen from tile 1 seem more damaged than those of
the specimen from Tile 2. This, however, comes in contradiction with the observation that the thermal
conductivity of mortar M1 is less than the one of M2. In that case, since the cover thickness is the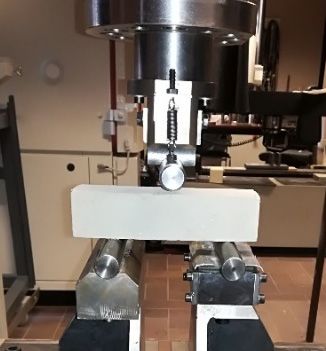
Proceedings 2018, 2, 522                                                                                       6 of 6

same, less damage on Tile 1 should be expected. However, no firm conclusions can be reached from
such a small number of specimens. Some useful indications can be obtained with simple tests like
these, but further investigation is absolutely necessary.

4. Conclusions—Future Work
      From the discussion of the results presented above, it can be concluded that:
•     Extremely costly equipment is not always necessary to perform fire tests, but, at least for
      preliminary tests, interesting and useful results can be obtained with simple set-ups like the ones
      presented hereby, as long as an adequate number of specimens are tested.
•     Fine grained mortars, as the ones described here, have a thermal conductivity that may provide
      a drop in temperature equal to 600–750 °C, in a member of only 22 mm thick.
      It is also proposed that further investigations should be conducted towards:
•     Mechanical performance of TRC specimens, before and after being subjected to fire-loading
      (with simple and more complicated set-ups). Parameters such as the cover thickness, the type of
      fibers, the time/temperature of exposure to fire, the moisture content of the specimens and the
      coating of the fibers should also be taken into consideration.
•     Calibration of curves that correlate the Ultrasonic Pulse Velocity measured on fine grained
      mortars commonly used for TRC elements, with the compressive and flexural strength of the
      mortars.

Author Contributions: All authors contributed substantially for the authorship of this paper. The experiments
were conceived by T.T. and P.K. S.V. and P.K. designed and performed the tests while all authors contributed
with suggestions for the analysis of the results and corrections on the manuscript that was written by P.K.

Acknowledgments: The authors gratefully acknowledge Agentschap voor Innovatie en Ondernemen (VLAIO)
for funding the research and all the members of the ‘CeComStruct’ project, of which this research is part of, for
their advice.

References
1.    Ehlig, D.; Hothan, S. Reinforced Concrete Slabs Strengthened with Textile Reinforced Concrete Subjected
      to Fire. In Proceedings of the 2nd International RILEM Workshop on Concrete Spalling Due to Fire
      Exposure, Delft, The Netherlands, 5–7 October 2011; pp. 419–426.
2.    Maroudas, S.R.; Papanicolaou, C.G. Effect of High Temperatures on the TRM-to-Masonry Bond. Key Eng.
      Mater. 2017, 747, 533–541.
3.    Silva, F.D.A.; Butler, M.; Hempel, S.; Filho, R.D.T.; Mechtcherine, V. Effects of elevated temperatures on the
      interface properties of carbon textile-reinforced concrete. Cem. and Conc. Compos. 2014, 48, 26–34.
4.    EN 1363-1:1999. Fire Resistance Tests. General Requirements; BSI: UK, Brussels, 1999.
5.    Rambo, D.A.; de Andrade Silva, F.; Toledo Filho, R.D.; Ukrainczyk, N.; Koenders, E. Tensile strength of a
      calcium-aluminate cementitious composite reinforced with basalt textile in a high-temperature
      environment. Cem. Conc. Compos. 2016, 70, 183–193.
6.    Trtnik, G.; Kavcic, F.; Turk, G. Prediction of concrete strength using ultrasonic pulse velocity and artificial
      neural networks. Ultrasonics 2009, 46, 53–60.

                           © 2018 by the authors. Licensee MDPI, Basel, Switzerland. This article is an open access
                           article distributed under the terms and conditions of the Creative Commons Attribution
                           (CC BY) license (http://creativecommons.org/licenses/by/4.0/).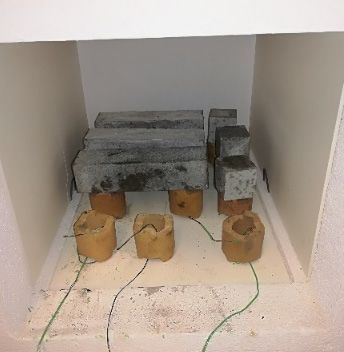
You can also read