PROTEIN DISULFIDE MAPPING WITH EXD - SLICING THE GORDIAN KNOT: E-MSION
←
→
Page content transcription
If your browser does not render page correctly, please read the page content below
APPLICATION NOTE FOR AGILENT Q-TOFS

SLICING THE GORDIAN KNOT:

Protein Disulfide Mapping with ExD
Mike Hare, Joseph Meeuwsen, Jared Shaw, Valery Voinov, Joe Beckman

Introduction
Cysteine disulfide bonds play an important role in stabilizing protein tertiary structure, particularly in
circulatory proteins exported to the oxidative extracellular environment. Such proteins are often involved
in regulatory or immune mechanisms and they can be valuable therapeutic biomolecules. However, a
challenge of analyzing proteins with multiple disulfide bridges, particularly with recombinant expression,
is the potential to fold in multiple disulfide configurations. Proper formation of disulfide bonds is critical
to their function and hence methods to investigate or confirm disulfide bonds are in high demand.
Proteins with multiple disulfide bridges include antibodies, hormones and cysteine knot proteins (CKP).
CPKs contain three or more disulfide bonds in an amino acid sequence approximately 30 residues long.
Because of their small size, stability, and solubility, this class of compounds is of increasing interest in
drug delivery.

Electron-based fragmentation is well suited for analysis of biomolecules containing disulfide bonds.
Disulfide bonds are not cleaved under typical collision induced dissociation (CID) conditions. In contrast,
electron-based fragmentation results in efficient homolytic cleavage of disulfide bonds1, yielding more
complete coverage without prior thiol reduction of proteins and peptides.2 ECD is advantageous for
work with intact proteins because in principle the efficiency of ECD increases with targets of higher
mass and higher charge. ECD cleavage sites tend to be more evenly distributed through the sequence
in comparison to CID fragmentation, which may occur at only the weakest bonds and those toward
the ends of the biomolecule.3

This application note demonstrates ECD analysis of disulfide bonds with two biomolecules, apamin
and insulin. Apamin is a peptide neurotoxin found in bee venom which is only 18 amino acids long but
contains two disulfide bridges, Cys1-Cys11 and Cys3-Cys15. Insulin is a small protein composed of two
polypeptide chains A and B, with two inter-chain disulfide bonds and one intra-chain disulfide bond.
Experimental
Electron Capture Dissociation
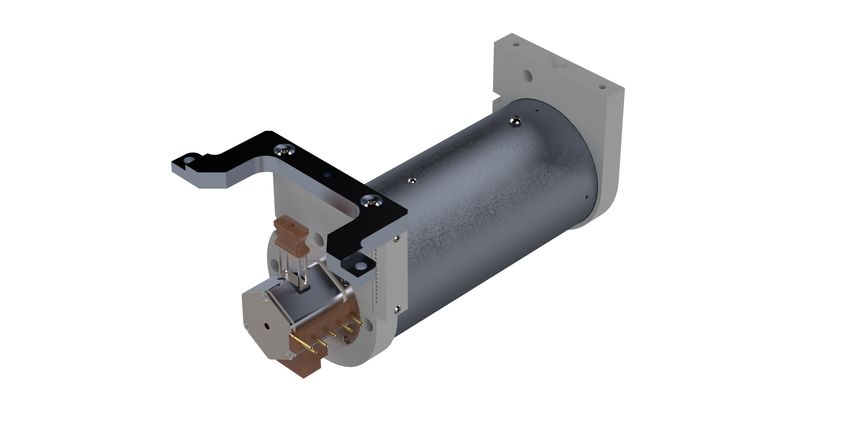
ECD was performed using the e-MSion4 ExD cell, a compact Production of c- and z-type ECD fragments is often
device which is installed in Agilent Q-TOFs between the enhanced by application of 3-15 V collision energy to
quadrupole and a shortened version of the original help separate fragments which may be held together
collision cell (Figure 1). The ExD cell produces electrons by electrostatic forces, particularly for larger proteins.
with a resistively heated rhenium wire and uses a series However, this was not found to be generally beneficial
of electrostatic lenses and permanent magnets to trap the for these experiments, and the ECD results shown below
electrons in the ion path (Figure 2). The position of the
5
were acquired with no additional collision energy.
ExD cell after the quadrupole allows ExD experiments to
be performed in much the same way as a CID experiment.
Established LC protocols can be used, as the cell does not
slow down normal operation of the Q-TOF.
Tuning the lenses of the ExD cell was performed using the
peptide standard substance P. Substance P was infused
while the ExDControl software performed automated
coarse and fine ECD optimization procedures to maximize
the signal of the c5 fragment of substance P. The optimized Figure 1. The e-MSion ExD AQ-250 Option attached to a
settings were then used to analyze apamin and insulin. shorter collision cell.
Entrance Lens Filament Electrons Exit Lens 1 Transfer Octupole
2 Lens 1
9
3 Lens 2
4 Quadrupole Mass Filter
Precursor Product
Ions Ions
5 ExD Cell
6 Collision Cell
Ring Magnet Ring Magnet
7 Ion Beam Shaper
1 4 5 6 7
8 Ion Slicer
9 Ion Mirror
2 3 8 10 10 Detector
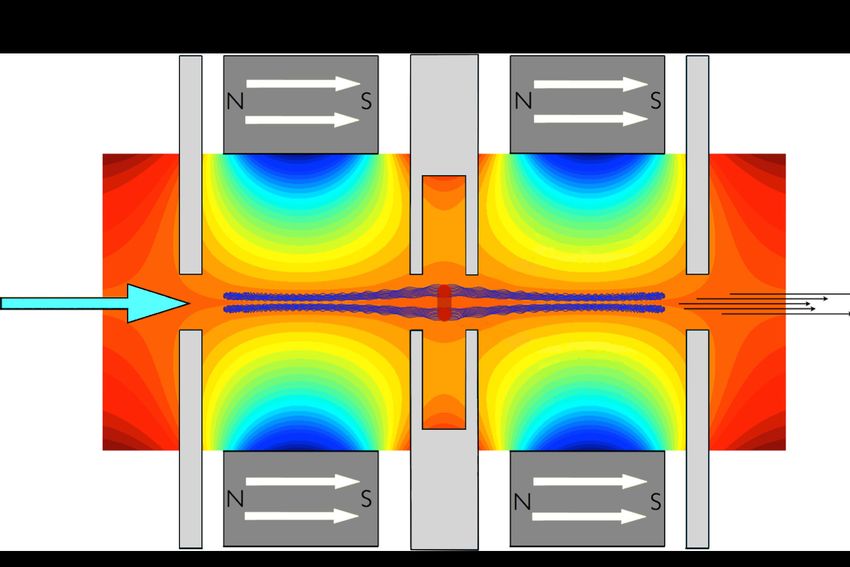
Figure 2. Location of the e-MSion ExD cell in the Agilent 6545XT mass spectrometer. Electrons are produced in the center of the
ExD cell and are trapped radially by a magnetic field produced by permanent magnets. The electrostatic lenses focus ions and
trap electrons along the lateral axis.
2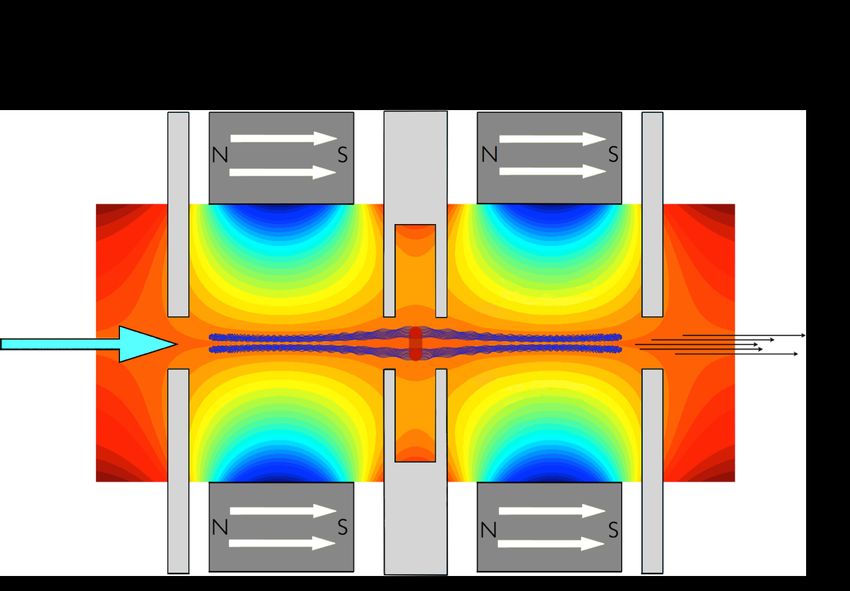
Table 1: LC Parameters: Agilent 1290 LC System               Sample preparation
                                                             Substance P (Bachem) was prepared at 10 µg/mL in 50%
                               Agilent AdvanceBio Pep-
Column                         tide Map, 2.1 × 150 mm,       methanol, 0.1% formic acid. A stock solution of bovine
                               2.7 μm
                                                             insulin (Sigma) was prepared at 0.9 mg/mL in 5% acetic

Column temperature             50 °C                         acid. This was diluted to 10 μM with 0.1% formic acid in
                                                             water for use in LC/MS analysis. For analysis by direct
Mobile phase A                 0.1 % formic acid in water    infusion, the stock solution was diluted to 10 μM in 20%
                                                             acetonitrile, 0.1% formic acid. Apamin (Sigma) was infused
                               0.1 % formic acid in
Mobile phase B                                               as a 10 μM solution in 20% acetonitrile, 0.1% formic acid.
                               acetonitrile

                               0–2 minutes 5 % B
                                                             Data acquisition
                               2–12 minutes 5–40 % B
Gradient                                                     The Agilent 6545XT was operated in targeted MS2
                               12–13 minutes 40–80 % B
                               13–15 minutes 80 % B          mode for both LC/MS and infusion experiments. Liquid
                                                             chromatography and Q-TOF parameters respectively are
Flow rate                      0.4 μL/min                    given in Table 1 and Table 2. For LC/MS experiments, the
                                                             target window was set to acquire ECD data throughout
Injection volume               20 μL
                                                             the elution time of insulin, previously determined in an MS-
                                                             only acquisition. Insulin spectra were acquired in 4 GHz
Table 2: MS Parameters: Agilent 6545XT Q-TOF with the        high resolution mode, with a resolution of approximately
Agilent Jet Stream Technology Ion Source, retrofitted with
                                                             50,000 at m/z 1222. Apamin data were acquired in 2GHz
an e-MSion ExD cell
                                                             extended dynamic range mode.
                               Positive ion mode, ESI
Ion mode
                               (Profile)
                                                             Data analysis
Drying gas temperature         300 °C                        ECD data were analyzed in ExDViewer.6 ExDViewer provides
                                                             a graphical user interface for performing scan averaging,
Drying gas flow                5                             noise removal, and peak picking on data imported in the
                                                             original vendor format. Theoretical isotope distributions
Sheath gas temperature         275
                                                             of fragments of a target sequence are calculated and
Sheath gas flow                12 L/min                      matched to the experimental data. The matched results
                                                             can then be interactively viewed with calculated isotopic
Nebulizer                      35 psi
                                                             patterns superimposed on the spectrum. For these
Capillary voltage              3,200 V                       experiments, fragment ion mass tolerances were set at
                                                             10 ppm. Sequence coverage figures from ExDViewer are
Fragmentor                     175 V
                                                             shown below, with cysteine bridges added by hand. Intact
                               LC/MS data were               and ECD-cleaved disulfide bonds were both modeled as
                               analyzed using Agilent        dehydrocysteine (cysteine lacking one hydrogen atom).
                               MassHunter Qualitative
                               Analysis 10, Agilent          Observation of fragments formed by cleavage between
Data analysis
                               MassHunter BioConfirm         disulfide-linked cysteines in the same chain show that both
                               10.0, and ExDViewer for
                               identification of fragment    a peptide bond and one or more disulfide bonds has been
                               ions.                         cleaved. The analysis of insulin is detailed in Figure 6.

                               1000 μL/hr (for infusion
Infusion rate
                               experiments)

                                                                                                                         3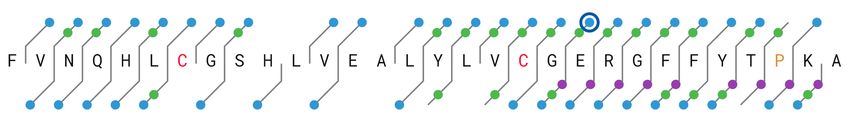
Results and Discussion
Apamin
Figure 3 compares the coverage of apamin obtained                A and B and further experimentation will be required to
with ECD fragmentation versus 15 V CID fragmentation.            distinguish between them. Thus for apamin, CID can be
ECD fragmentation yields ions indicating that nearly             used to identify the the regions of this molecule which are
every peptide bond has been cleaved. The characteristic          enclosed by the disulfide bonds. ECD is uniquely able to
product ions of ECD are c- and z-type ions7, illustrated as      confirm the sequence within them.
blue dots on the coverage map. Because of the internal
energy deposited in the precursors in the source of the
instrument and collisions with gas molecules in the collision
cell directly following the ECD cell in the ion path, b and y
ions are often produced as well (green dots). In addition,          A
a-type ions (purple dots) are also commonly observed.

                            CID                                     B

                                                                    C

                            ECD

                                                                 Figure 4. Possible disulfide bond configurations of apamin.

                                                                 Insulin
                                                                 Charge states 4+ through 6+ were most prominently
Figure 3. The sequence and disulfide bond structure of apamin,
                                                                 observed for intact insulin (Figure 5). Deconvolution of the
with ECD and CID cleavages identified by ExDViewer. The
theoretical mass of apamin with two intact disulfide bonds is    insulin spectrum using Agilent Bioconfirm software resulted
2025.89; the deconvoluted observed mass was 2025.95. The 4+      in a monoisotopic mass of 5729.63 Da, which compares
charge state of apamin at m/z 507.5 was selected for isolation
                                                                 favorably with 5729.60 Da, the calculated mass of insulin
and fragmentation. Yellow lines indicate the known disulfide
bond configuration of apamin.                                    with all three disulfide bridges intact.

Because of the interlaced structure of the disulfide bridges,    The ECD fragment sequence coverage of insulin from a
many of the cleavages of the peptide backbone can only           single LC-MS/MS experiment is shown in Figure 6. ECD
have occurred with concurrent cleavage of both of the            cleavage can occur at either of the disulfide bridges, and the
disulfide bonds. By contrast, CID at 15 V cleaves only the       observable peptide fragments will depend on the disulfide
peptide bonds which are external to the rings formed by          cleavage. Each of the two cases is considered separately.
the disulfide bridges.                                           Figure 6A shows the observed fragments resulting from
                                                                 cleavage of the disulfide bond between the B-chain Cys19
Of the three possible configurations of the disulfide bonds      and A-chain Cys20 along with a peptide bond, assuming
in apamin (Figure 4), structure C can be ruled unlikely          the Cys7-Cys7 disulfide still intact. The figure is a composite
because no CID fragmentation is observed between the             of separate A- and B-chain analyses. Figure 6B shows
two separated disulfide-bridged rings. The observed ECD          the observed fragments resulting from cleavage of the
and CID fragments are consistent with both structures            disulfide bond between the B-chain Cys7 and A-chain Cys7.

4
Figure 5. Mass spectrum and (inset) chromatogram of intact bovine insulin. Because more highly charged ions often give better
ECD fragmentation, the 6+ charge state was selected.
chain B
A X
chain A
B X
X
Figure 6. Insulin structure and fragments identified in an ECD experiment. c- and z-type ECD ions are indicated with blue dots,
green dots indicate b- and y-type ions, and purple dots signify a-type ions. Circled dots indicate w-ions. Top: fragments found
with Cys7-Cys7 disulfide bridge assumed to be intact. Each chain was calculated separately. The fragments of the B-chain were
calculated with the mass of the A-chain as a modification on Cys7, and fragments of the A-chain were calculated with the mass
of the B-chain on its Cys7. Bottom: fragments found with the Cys19-Cys20 disulfide bridge intact. The fragments were calculated
in the same way as the upper figure, with the mass of the A-chain on Cys19 of the B-chain and the mass of the B-chain on Cys20
of the A-chain.
5A X
B X
Figure 7. Insulin structure and fragments identified by CID, 25 V collision energy. The figure was constructed as described above.
Fragmentation inside of the ring formed by the disulfide indicating that the Cys7-Cys7 disulfide bond remained
bonds is extensive, demonstrating the cleavage of at least intact (Figure 7B). A few low-abundance fragments are
one disulfide bond in addition to a peptide bond. Also observed within the region bounded by the disulfide bonds
of interest is the apparent correlation of fragmentation when the data are analyzed with the assumption that
between C6 and C11 of the A-chain with cleavage of Cys19-Cys20 disulfide is cleaved (Figure 7A).
the interlacing inter-chain C7-C7 disulfide bond. This
observation suggests that the intra-chain disulfide of the Conclusions
A-chain is protected from cleavage by the C7-C7 inter- • The ExD cell readily cleaves disulfide bonds in
chain link. In this LC-MS/MS experiment, the spectra used intact proteins on a chromatographic time scale.
to produce Figure 6 were acquired over approximately
6 seconds, and averaged in ExDViewer. A four minute • ECD and CID work in tandem to identify disulfide
acquisition while infusing the sample with a syringe pump linkages and confirm protein sequences
resulted in virtually complete coverage of the insulin B-chain in regions bounded by disulfide bonds.
and 80% coverage of the A-chain, when all disulfide
variants are combined. • ECD potentially obviates the need for chemical
disulfide reduction by enabling high sequence
Figure 7 shows CID fragmentation of insulin for comparison. coverage of disulfide-containing proteins in the
The data were acquired by infusion, with the ExD cell same experiment that intact mass can be determined.
filament current off and 25 V collision energy. As expected,
extensive fragmentation to b- and y-type ions is observed • This capability can be retrofitted to existing
in regions outside of the ring formed by the two disulfide instruments.
bridges. When the data are analyzed with the assumption
that the Cys7-Cys7 disulfide is cleaved, no fragmentation
within the regions bounded by disulfides is observed,
6References
1. Zubarev, R. A., Kruger, N. A., Fridriksson, E. K., Lewis, M. A., Horn, D. M., Carpenter, B. K., & McLafferty, F. W. (1999).
Electron capture dissociation of gaseous multiply-charged proteins is favored at disulfide bonds and other sites
of high hydrogen atom affinity. Journal of the American Chemical Society, 121(12), 2857-2862.
2. Fort, K. L., Cramer, C. N., Voinov, V. G., Vasil’ev, Y. V., Lopez, N. I., Beckman, J. S., & Heck, A. J. (2018). Exploring ECD
on a benchtop Q exactive orbitrap mass spectrometer. Journal of proteome research, 17(2), 926-933.
3. Zubarev, R. A., Zubarev, A. R., & Savitski, M. M. (2011). Electron capture/transfer versus collisionally activated/induced
dissociations: solo or duet?. Journal of the American Society for Mass Spectrometry, 19(6), 753-761.
4. e-MSion Inc., Corvallis, Oregon. https://e-msion.com
5. Beckman, J. S., Voinov, V. G., Hare, M., Sturgeon, D., Vasil’ev, Y., Oppenheimer, D., ... & Stafford, G. (2021). Improved
Protein and PTM Characterization with a Practical Electron-Based Fragmentation on Q-TOF Instruments. Journal
of the American Society for Mass Spectrometry. In press.
6. ExDViewer is available from e-MSion Inc.
7. Turecek, F., & Julian, R. R. (2013). Peptide radicals and cation radicals in the gas phase. Chemical reviews, 113(8),
6691-6733.
SUPPORT SALES
e-MSion, Inc. e-MSion, Inc.
2121 NE Jack London 2121 NE Jack London
Corvallis, Oregon 97330 Corvallis, Oregon 97330
Support@e-MSion.com Sales@e-MSion.com
https://e-msion.com/products/agilent/ Research Use Only. Not for use in diagnostic procedures.
Mark-Ag-002 • R001 • July 2021You can also read