Quarterly Vehicle Fleet Statistics - Ministry of Transport
←
→
Page content transcription
If your browser does not render page correctly, please read the page content below
Quarterly Vehicle
                 Fleet Statistics
                 January-March
                 Quarter of 2018
ISSN 1173-1079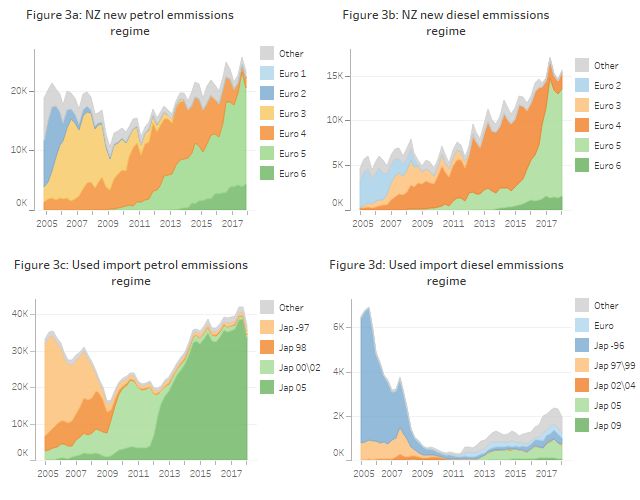
Introduction
The January-March 2018 Quarterly Fleet Report is a brief review of vehicle fleet statistics. It provides
information on trends in vehicle registration patterns, fuel economy, travel and fuel prices.

This report and the accompanying data are available from the Ministry of Transport website. The
annual 2016 Fleet Statistics are also available.

The vehicle, fuel economy and Road User Charges data in this report is derived from the New
Zealand Transport Agency (NZTA) Motor Vehicle Register. The definitions of the vehicle classes that
have been used can be found on pages 4 and 5, and Appendix A of the annual Fleet Statistics
report.

Table of Contents

Introduction ............................................................................................................................................ 1
Highlights ............................................................................................................................................... 2
Registrations .......................................................................................................................................... 3
Fleet age, growth, makeup and scrappage ........................................................................................... 8
Emissions standards and CO2 emissions of light vehicles entering the fleet ...................................... 13
Engine size of light vehicles entering the fleet .................................................................................... 21
Transport Indicators ............................................................................................................................. 23
    Petrol and diesel deliveries ............................................................................................................. 23
    Real petrol and diesel prices ........................................................................................................... 24
    Travel .............................................................................................................................................. 25
    Purchase of road user charges (RUC) ............................................................................................ 27

Disclaimer:

All reasonable endeavours have been made to ensure the accuracy of the information in this report. However, the
information is provided without warranties of any kind including accuracy, completeness, timeliness or fitness for
any particular purpose.
The Ministry of Transport excludes liability for any loss, damage or expense, direct or indirect, and however
caused, whether through negligence or otherwise, resulting from any person or organisation’s use of, or reliance
on, the information provided in this report.
Under the terms of the Creative Commons Attribution 4.0 International (BY) licence, this document, and the
information contained within it, can be copied, distributed, adapted and otherwise used provided that:
 • the Ministry of Transport is attributed as the source of the material
 • the material is not misrepresented or distorted through selective use of the material
 • images contained in the material are not copied
The terms of the Ministry’s Copyright and disclaimer apply.
Enquires relating to this data may be directed to the Ministry of Transport, PO Box 3175, Wellington, or by email on
info@transport.govt.nz
For more information about vehicles and travel check out www.transport.govt.nz/research.

                                                                             1
Highlights
 Light vehicle        Light vehicle registrations are still at record high levels, despite were slightly
 registrations        down in the first quarter 2018.

 Vehicle travel       Light and heavy vehicle travel has been increasing since mid-2013.

 Fuel prices          Real petrol prices remain lower than they were in 2012-2014. These are real
                      quarterly prices, converted to a December 2011 basis using the consumer
                      price index.

 CO2 emissions of     The reported CO2 emissions of light vehicles entering the fleet have not
 light vehicles       dropped noticeably since 2013.
 entering the fleet

                                                  2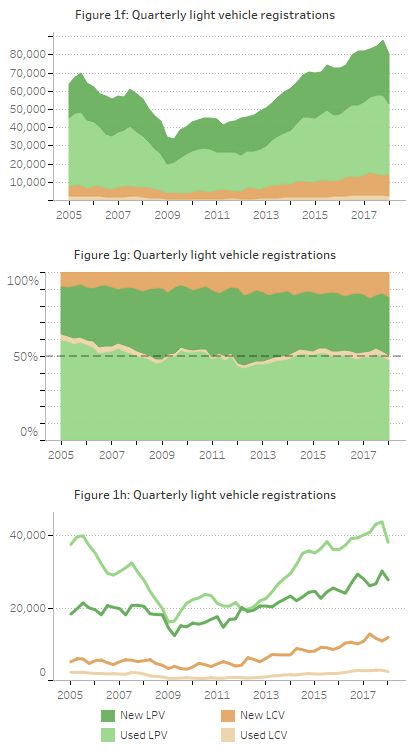
Registrations

Light vehicles
Figures 1a and 1b show that recent registrations of new light vehicles are at record high levels.
However, used light vehicle registrations dropped noticeably in the first quarterly of 2018. The
problem with stink bug infested ships carrying used vehicles imported from Japan could be the main
contributing factor1.

Registrations of new vehicles dropped in 2008 and 2009 due to the global financial crisis, but the drop
was less pronounced than that for used vehicles. Sales have rebounded since that time. There were
335,800 new and used import light vehicle registrations in the year to March 2018, up from 317,500 in
the year to March 2017.

Used import numbers were dropping prior to the 2008 global financial crisis. Among the contributing
factors may have been the already high levels of vehicle ownership, collapses in the finance sector,
fuel price shocks in 2006 and 2008 and the requirement from January 2008 for used imports to meet
the Japanese 98 emissions standard. This requirement restricted the vehicles that could be imported.

There was a further requirement in January 2012 for used imports to meet the Japanese 05
emissions standard. This prevented most vehicles built before 2005 from being registered. This
restricted used imports in the first half of 2012.

1   https://www.stuff.co.nz/business/101735791/stink-bug-infested-ships-are-headed-back-to-auckland

                                                   3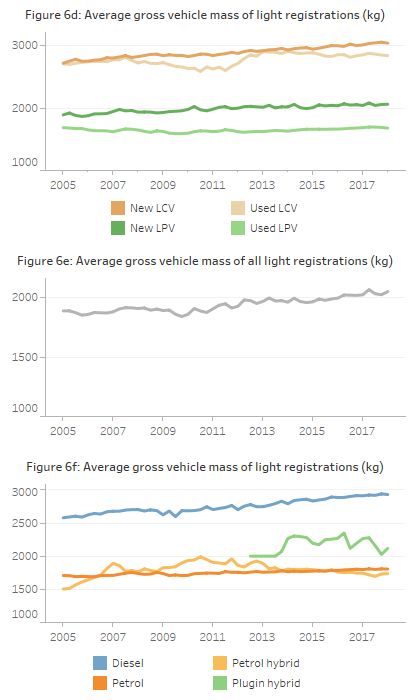
Buses and trucks
Registrations of used buses and trucks (Figures 1c and 1d) dropped to very low levels after July
2008. The 2007 Vehicle Exhaust Emissions Rule restricted imports of diesel vehicles after January
2008 to those built to the Japanese 02/04 standard, which effectively prevented most vehicles built
before 2002 from being registered. In 2010 the requirement for used diesels changed to the Japanese
05 standard. There has been a slight recovery in used heavy vehicle registrations since 2012, which
reflects the increasing availability of stock in Japan that is again economic to import. Sales of new
buses and trucks remain dominant.
Larger numbers of buses and trucks were imported in late 2007 because they would not have been
allowed in from January 2008. That is why registrations spiked early in 2008.

The 2016 Annual Fleet Statistics report provides more information on the truck and bus fleets.

                                                  4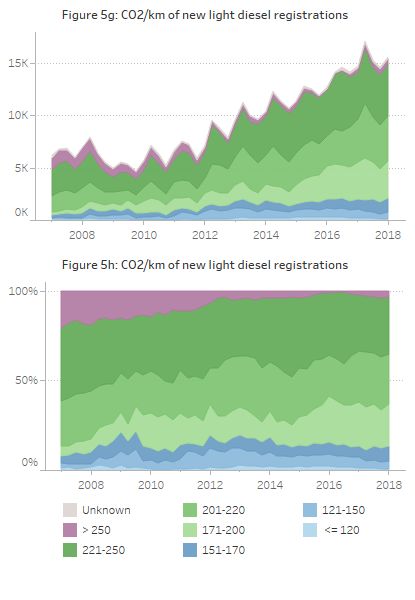
Motorcycles
Motorcycle and moped registrations (Figure 1e) increased in 2008, possibly in response to the higher
fuel prices. Sales peaked in 2008 (over 20,000 registrations in the year to September 2008).
Registrations halved in 2009 but have slowly increased again from about 2013.
The 2016 Fleet Statistics Report provides more information on the motorcycle fleet.

                                                  5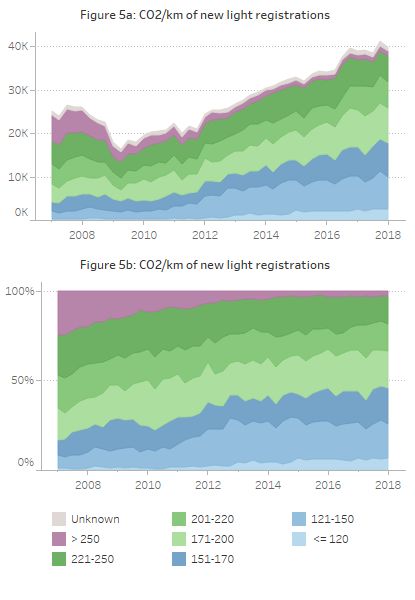
Light passenger and light commercial registrations
Figures 1f, 1g and 1h provide more insights into light vehicle registrations. Figure 1f shows the growth
of registrations since 2009 as economic confidence picked up and the exchange rate strengthened.

Note : LPVs are Light Passenger Vehicles (typically cars and SUVs) and LCVs are Light Commerical
Vehicles (typically vans and utes).

                                                   6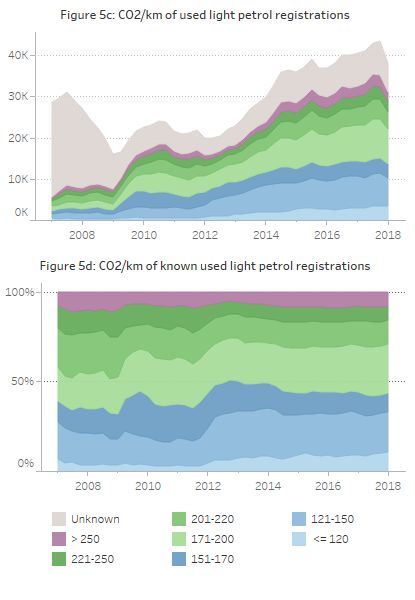
Light electrics
The introduction of the Mitsubishi Outlander plugin hybrid had an immediate impact on electric
vehicle2 registrations early in 2014. Audi and BMW plug-in hybrids entered the market later.
The sales mix has changed since then, many electric vehicle registrations in recent quarters have
been used imports.
There were 1035 light electric and plug-in hybrid registrations between January and March 2018,
which is well up on the 645 for the same period in 2017. The electric vehicle fleet (including heavy
vehicles) was 7232 vehicles by the end of March 2018.

The monthly electric vehicle report provides more detail, including a breakdown of the models that
have been sold, and where the electric vehicle fleet is located. It is available from the “Monthly electric
and hybrid light vehicle registrations” section of
http://www.transport.govt.nz/research/newzealandvehiclefleetstatistics.

2Electric vehicles are either powered solely by battery, or are plug-in hybrid electric vehicles (PHEV) which are
battery and engine powered. They have a shorter electric range than pure electric vehicles.

                                                         7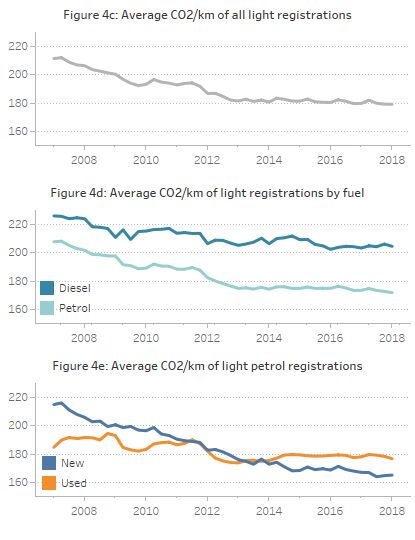
Fleet age, growth, makeup and scrappage
Light fleet age
The average age of the light fleet has remained stable since late 2013 at about 14 years old.

Used import ages
The average age of the used import light vehicles entering the fleet is increasing.
In January 2012 the emissions rule changed to require light petrol vehicles to have been built to the
Japanese 05 standard, which effectively prevented most vehicles built before 2005 from being
registered. The average age of used imports when registered dropped in 2012, but has been
increasing since then.
The number of used light diesel vehicles imported is low and therefore the average age of all imports
is similar to that of petrol vehicles. (see figures 1l and 1m).

                                                    8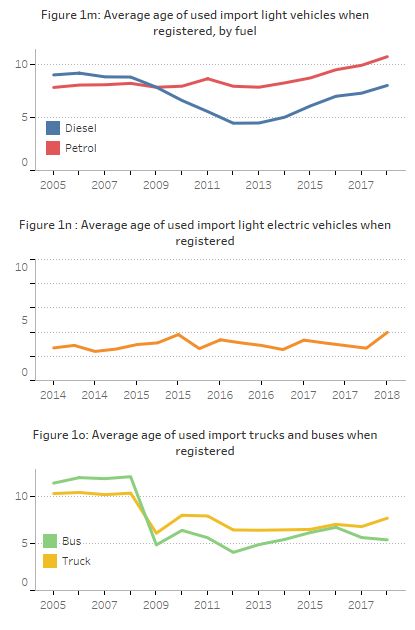
The 2007 Vehicle Exhaust Emissions Rule restricted imports of diesel vehicles after January 2008 to
those built to the Japanese 02/04 standard, which effectively prevented most vehicles built before
2002 from being registered. This propably the major reason that the average age of used import
trucks and buses when registered dropped sharply in late 2008 (Figure 1o).

                                                 9
Fleet growth
There has been a major increase in vehicle registrations since 2013. Figures 2a-2f show the change
in the fleet size each quarter (registrations that quarter minus scrappage3 that quarter).
The light fleet (see Fig. 2c) has grown by over 20,000 vehicles a quarter since the last quarter of
2013.
3 This report ends 12 months before the period covered in the remainder of this report, as some vehicles not yet
relicensed may either lapse out of the fleet after a year, or be relicensed late in the one year grace period.
1011
Light fleet age breakdown and scrappage
Vehicle safety performance has improved over time, on average newer light vehicles do a better job
of protecting their occupants. Road safety policy makers are interested in the size of the pre-2000
vehicle cohorts remaining in the fleet, and the rate at which they are leaving.

Figure 2g shows the vehicle year of manufacture mix in the light fleet at the end of each quarter.

Scrappage of the pre-1990 cohort is limited now, but Figures 2g and 2h shows that the 1990-94
cohort is shrinking noticeably, and that scrappage of the 1995-99 vehicles appears to be accelerating.

Scrappage is not reported for the last four quarters as the administrative data we are now using to
determine when vehicles leave the fleet is not definitive until 12 months after the period.

                                                   12
Emissions standards and CO2 emissions of light vehicles entering the fleet
Emissions standards of light vehicles entering the fleet
Under the 2007 Vehicle Exhaust Emissions Rule, all vehicles being registered in New Zealand are
required to be built to a recognised exhaust emissions standard. Standards may come from Europe
(Euro), Australia (ADR), Japan, or America. Figures 3a-3d show the steady improvement in the
emissions standards of vehicles entering the New Zealand fleet over time.
New Zealand-new light vehicles typically comply with an Euro (or ADR equivalent) standard, and most
used imports comply with a Japanese standard. The 2007 Emissions Rule required used imports
certified from January 2012 to meet the Japanese 05 emissions standard. Figure 3c shows that
almost all registrations of used imports now meet that standard.
Imports of new Euro 6 vehicles are increasing though it is not a legal requirement.
Explanatory notes:
Australian Design Rules (ADR) emissions standards are identical to European emissions standards,
although they sometimes have different implementation dates. The two are combined and reported as
European standards in the graphs above.
Fewer than 100 light vehicles a year are reported to comply with standards from America, so these
are not broken down further.
Vehicles are shown as ‘incorrectly recorded’ when the fuel type did not match the emissions standard,
where the vehicle was reported to meet a standard that did not exist, or where insufficient information
was provided to determine the standard.
The emissions standards relate to emissions that are directly harmful. There is no a clear relationship
between these standards and the CO2 emissions described in this report.
13CO2 emissions of light vehicles entering the fleet
Issues in the test results
This section reports the fuel consumption figures that manufacturers get for their vehicles when they
put them through standardised drive cycles in laboratory conditions.
While there will always be a difference between laboratory and real world results, they should be
readily comparable over time. There is good evidence that the gap between laboratory results and
real world fuel economy has been widening. A 2015 vehicle with a certain real world fuel economy is
likely to have a lower laboratory result than a 2010 vehicle with the same real world economy.
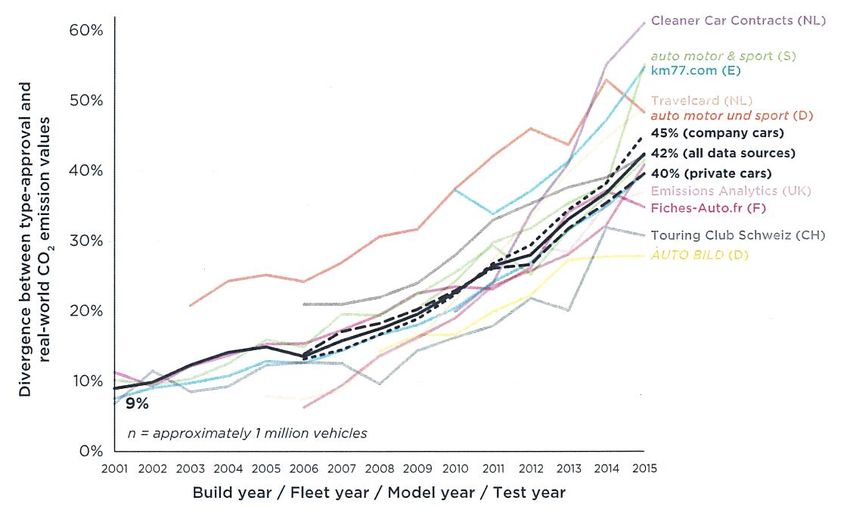
Figure 4a from a recent European study shows the divergence between real world economy and
laboratory test results. Real-world fuel use was 9% higher than test results in 2001 but the gap
increased to more than 40% by 2015.
Figure 4a Real world emissions vs laboratory test results
Source : ICCT 2016 from laboratory to road report
A similar comparison has been done in New Zealand 4 between the actual fuel consumption of light
petrol corporate fleet vehicles and their laboratory test results. The result shown in Figure 4b is similar
to the result shown above. Real world fuel economy is diverging from the test values for the same
vehicle.
Figure 4b : Divergence between real world and test
petrol economy
Margin of real world economy
25%
20%
above tests
15%
10%
5%
0%
2010 2011 2012 2013 2014
Year of manufacture
4“Real-world fuel efficiency of light vehicles in New Zealand” Wang, McGlinchy, Badger, and Wheaton, Ministry
of Transport.
This paper was presented to the Australasian Transport Research Forum (ATRF) in October 2015, see
http://atrf.info/papers/2015/files/ATRF2015_Resubmission_9.pdf
14Figure 4e shows that the average laboratory test value for new light petrol vehicles was 193 g CO2/km
for vehicles entering the fleet in the fourth quarter of 2010 and 168 g CO2/km in the fourth quarter of
2014. That suggests an improvement of 13% in fuel economy. However, based on the result above
their real world economy may have been 219 g CO2/km in 2010 and 210 g CO2/km in 2014, or an
improvement of only 4%.
The NZ analysis does show that real world economy has been improving for vehicles with a given
engine size and fuel type, but not as quickly as the published laboratory results suggest.
The fuel economy of the light vehicles that have entered the fleet in the last four to five years has
been relatively static in terms of laboratory test results (see Figure 4c below).
Average CO2 emissions of light vehicles entering the fleet
Figure 4c shows the average reported CO2 emissions (based on laboratory testing) from light vehicles
entering the fleet generally declined from 2006 to 2012, but have leveled out since then.
The average engine size of light vehicles registered was dropping until 2010 (see Figures 6a and 6b)
and this contributed to the reduction in CO2 emissions. Average engine size of light diesel vehicles
has increased slightly since 2013.
The reported CO2 emissions of new light petrol vehicles have been dropping since 2005. Some of the
drop is due to the substitution of diesel SUVs for large petrol engined vehicles such as the Australian
Fords and Holdens. The drop in the engine size of light petrol vehicles can be seen in Figure 6c.
However some of the drop in reported fuel consumption of near-new vehicles in particular will be due
to the issues in the test results discussed previously.
15Figure 4f shows the proportion of older used vehicles (9 years or older when registered) has
significantly increased since 2014. This contributed to the plateau of average reported CO2 emissions
of light registrations in recent years.
16CO2 emissions of New Zealand-new light vehicle registrations (petrol and diesel)
Figure 5b shows that registrations in the segment of the fleet with lower reported CO2 emissions (under
150g CO2/km) are 25% of new registrations. Protracted high fuel prices (see Figures 8a and 8b)
between 2011 and 2014 probably had an impact on purchasing patterns, and there have been advances
in vehicle technology. The average results for all light registrations can be seen in Figure 4c.
17CO2 emissions of used imported petrol light vehicle registrations
Imported used petrol vehicles had lower average reported CO2 emissions than New Zealand-new
petrol vehicles (see Figure 4e) until mid-2011. After that New Zealand new vehicles, on average, have
been at least as efficient as used imports5. Figure 5d shows that the percentage of fuel efficient used
vehicles (under 150g/km) entering the fleet changed little from 2005 to 2011, but increased markedly
in 2012, possibly in response to fuel prices. The percentage of fuel efficient used petrol vehicles
registered has been relatively stable since 2012.
To enable the CO2 values for used vehicles to be compared with new vehicles (shown in Figures 5a
and 5b above), their values have been converted from Japanese warm-start test values to European
cold-start values.
5The divergence between real world and tested fuel economy figures may have affected this comparison. Most
of used imports tend to be more than 7 years old when registered, and their real world and tested fuel economy
were closer when they were manufactured.
18CO2 emissions of all light petrol vehicle registrations
Figure 5f shows that since 2005 there has been a trend towards buying more fuel efficient petrol
vehicles, partly as buyers are purchasing diesel sports utility vehicles (SUVs) instead of larger
engined petrol vehicles. The share of registrations of light petrol vehicles under 150g/km CO2
increased markedly in 2012 (see Figure 5f) but has plateaued since.
19CO2 emissions of new diesel light fleet registrations
Figure 5g shows that registrations of the least CO2 efficient diesel vehicles (over 250g reported
CO2/km) have plummeted. Registrations of diesels under 170g CO2/km remain limited. Sales of light
diesel vehicles continue to be mainly light commercial vehicles (vans and utes) and SUVs. New
vehicle sales are seasonal, reflecting tax and business cycles.
Used diesels have not been reported on as few of them have fuel economy values recorded.
20Engine size of light vehicles entering the fleet
The engine capacity of new petrol vehicle registrations had been trending down, but has stayed about
the same for the last three years. The engine size of light diesel vehicles increased from 2012 to 2014
but has stayed about the same since then. The engine capacity of used petrol vehicles has hardly
varied since 2005.
LPVs (Light Passenger Vehicles, typically cars and SUVS) are mainly petrol powered and LCVs (Light
Commerical Vehicles, typically vans and utes) are mainly diesel powered.
21Gross vehicle mass of light vehicles entering the fleet
The gross vehicle mass of new light registrations is increasing. Used passenger vehicles are also
getting heavier, though not to the same extent.
22Transport Indicators
Petrol and diesel deliveries6
Fuel data lags the other data in this report by around three months, so that this section covers the
period Quarter 1 of 2003 to Quarter 4 of 2017. Fuel deliveries have seasonal patterns, so quarterly
comparisons should be made with the same quarter in other years.
Over the longer term diesel deliveries have been increasing. Petrol deliveries were decreasing but
began increasing in 2015, due to the increase in the fleet size and travel (see Figures 1b and 9a).
Diesel is also used in many non-transport areas of the economy including agriculture, mining, forestry,
fishing, industrial and at times electricity generation. These fuel delivery figures include those uses,
and the transport/non-transport usage split is estimated by the Ministry of Business, Innovation &
Employment. The split of transport/non-transport use of diesel is discussed in the Liquid Fuel Use in
New Zealand report.
6Source Ministry of Business and Innovation (MBIE) fuel delivery data.
http://www.med.govt.nz/sectors-industries/energy/energy-modelling/data/oil
23Real petrol and diesel prices7
The prices shown in Figure 8a and 8b are December 2011 prices (termed real prices), adjusted for
inflation via the consumer price index.
Real petrol prices remained between $2.03 and $2.11/litre from 2011 to late 2014. They have
averaged $1.79/litre in the 12 months to March 2018.
Real diesel prices dropped significantly in 2015 and 2016, but have gradually picked up since then.
They averaged $1.14/litre in the 12 months to March 2018, which is still significantly lower than the
average price ($1.45/litre) in 2011-2014.
7 Source Statistics NZ Infoshare – Economic Indicators,
Group: Consumers Price Index
Table: CPI Selected Quarterly Weighted Average Prices for New Zealand
24Travel
Figure 9a shows estimates of annual national travel8 for the 12 months to each quarter. Travel
continues to increase after being fairly stable between the peak in 2008 and mid-2013. The recent
increase reflects growth in the vehicle fleet, lower fuel prices and increased net migration.
The estimates are established by analysing the odometer readings recorded at warrant of fitness
(WoF) and certificate of fitness (CoF) inspections over the last year.
This data lags the report period by 6 months, as WoF and CoF inspections are needed after the end
of the period being analysed in order to estimate travel. If travel was estimated sooner it would have
to be projected from the previous inspection, and changes in fuel price or economic conditions would
reduce the reliability of that projection.
Vehicle travel per capita dropped between mid 2008 and 2012 but has been increasing since 2013.
Figure 9b shows that travel per capita is now back to the 2005 peak.
8 All the vehicle travel estimates (2001 onwards) have been revised starting with the Jan-March 2015
report. The old mechanism for removing vehicles from the fleet (if their registration was not cancelled
by the owner) took into account when their Warrant or Certificate of Fitness expired. That mechanism
is no longer viable with the change to longer inspection periods in 2014..
25The significant decline in heavy vehicle travel between October 2008 and December 2009 was the
result of the economic downturn. Heavy travel increased significantly from mid-2013. Light travel
dropped from late 2008 to 2012, but has grown substantially since then.
26Purchase of road user charges (RUC)
Drivers of vehicles with a gross vehicle mass over 3.5 tonnes, or powered by a fuel other than petrol or
electricity, pay for their use of the roads through road user charges (RUC). All light vehicle RUC is from
diesel powered vehicles.
RUC licences are purchased in advance so quarterly light vehicle net9 RUC purchases are only
indicative of travel.
9 RUC used for off road travel is refunded. Net RUC is RUC paid, less refunds
27You can also read