High Prices Show Stresses in New England Natural Gas Delivery System
←
→
Page content transcription
If your browser does not render page correctly, please read the page content below
February 7, 2014

High Prices Show Stresses in New England Natural Gas Delivery System
Abstract. Since 2012, limited supply from the Canaport and Everett liquefied natural gas (LNG) terminals coupled with
congestion on the Tennessee and Algonquin pipelines have led to winter natural gas price spikes in New England. The problem
continued in the winter of 2013-14, as indicated by New England’s forward basis for January 2014 reaching $17.41. Pipeline
expansions could ease price spikes, but their cost-effectiveness, including their ultimate cost to consumers, remains a
challenge. This article reviews possible alternatives. The data are presented in three summary tables and in detailed state
tables.
    During the past two winters, New England natural gas winter prices have risen significantly. The
    average bidweek natural gas price reached a high of $14.52 per million British thermal units (MMBtu)
    for December 2013 and more than $20/MMBtu for January 2014. The January New England forward
    basis 1 , reflecting the relationship between market conditions at a specified regional hub and those at
    Louisiana’s Henry Hub, settled at $17.41, 2 and the forward basis curves indicate a market expectation
    of a record-high winter basis (Figure 1). The high winter prices in New England suggest a natural gas
    delivery system that is stretched significantly. 3

Figure 1. Forward basis curves for natural gas in New England

1
 In the natural gas industry, basis is the difference between a natural gas price at a given location and the benchmark Henry
Hub (Louisiana) price; a forward price of a given forward month is a contract price for delivering a specified amount of natural
gas in the given month. A forward basis of a given location is the difference between the forward prices at the given location
and at Henry Hub. A spot price is a contract price for delivering natural gas on the next day. A spot basis at a given location is
the difference between spot prices at the given location and Henry Hub.
2
 This specific basis was at the Algonquin Citygate.
3
 See also Constraints in New England likely to affect regional energy prices, Market Alerts, and the Market Prices and
Uncertainty Report.
                                                                                                                                     1
New England receives natural gas from several sources. Most natural gas delivered into New England
flows through the Tennessee Gas Pipeline (TGP) and Algonquin Gas Transmission pipeline (AGT), both of
which flow gas into the region from the south. Massachusetts’s Everett liquefied natural gas (LNG)
terminal also supplies natural gas to the region and is connected with the AGT and TGP pipelines. 4
Canada’s Canaport LNG import terminal also sends natural gas into the region through the Maritimes &
Northeast (M&N) pipeline, which has the option of delivering natural gas to New England from the
production fields in the Sable Offshore Energy Project and Deep Panuke in Nova Scotia, Canada (Figure
2).
Figure 2. New England natural gas supply system
The TGP and AGT pipelines have a combined transport capacity of about 3.5 billion cubic feet (Bcf) per
day delivered into New England, including gas from domestic production and storage withdrawal,
Canadian production, and imported LNG. Although transport capacity is greater than average January
consumption (Figure 3), peak-demand days determine the stress on the delivery system.
4
Everett also provides LNG directly to the Mystic Power Plant and the National Grid utility company. In addition, Everett is
capable of delivering LNG directly to utilities or even end users by truck at the capacity of 0.1 Bcf/day. Two additional
regasification terminals, offshore buoy-systems Neptune and Northeast Gateway, both near Everett, are usually inactive.
2Figure 3. January average natural gas basis and daily consumption in New England
In the winter of 2012-13, LNG supply from Canaport via M&N and from Everett declined (Figure 4), and
as a result, the other primary sources of supply, the AGT and TGP pipelines, were almost fully utilized
and thus stressed in many days of the winter (Figure 5). This situation has been repeated as the winter
of 2013-14 reaches a midpoint, and the forward basis continues to spike.
Figure 4. New England's swing supply of natural gas
3Figure 5. New England natural gas supply from TGP & AGT pipelines
Some of the natural gas from M&N and Everett is delivered to New England through their
interconnections to TGP and AGT. In addition, Everett delivers up to 0.7 Bcf per day directly to the
1,951-magawatt (MW) Mystic power plant, the National Grid utility company, and LNG users. New
England also receives natural gas directly from M&N, Iroquois, and the Pacific Northern Gas pipelines in
addition to the delivery points on TGP and AGT.
International natural gas and LNG markets. The reduction in LNG imports into New England is a
consequence of the growth in U.S. shale gas production since 2010, which has contributed to a
reduction in U.S. natural gas market prices relative to those in other world markets. The price spread
between the U.S. benchmark price at Henry Hub and the United Kingdom (U.K.) benchmark price at
National Balancing Points widened to $6.91/MMBtu in 2013 from $0.83/MMBtu in 2009 (Figure 6).
4Figure 6. Average spot natural gas prices
The growing price spread between U.S. and global markets led to the reduction in LNG imported and
then sent from the Canaport (through M&N) and Everett LNG terminals (through TGP and AGT), and
contributed to the upward price pressure in the New England market.
Effect of limited peak supply on New England prices. The price effect of a decline in peak supply is
evident when comparing January 2013 with January 2012. Both months had several days when the
market called for supply close to peak capacity of 3.5 Bcf/day from TGP and AGT. The basis in January
2013, however, rose substantially higher than the basis in January 2012, reaching over $30/MMBtu on
January 26, 2013, while remaining under $9/MMBtu the entire month of January 2012 (Figure 7).
Figure 7. NE natural gas supply from TGP and AGT and basis, Jan 2012
vs. Jan
5Increasing electric power sector natural gas use in New England. Relatively lower natural gas prices in
the United States, compared with the United Kingdom, not only led to declines in LNG imports but
contributed to increased use of natural gas in power generation. In New England, natural gas use for
electricity generation made up about a third of the region’s natural gas consumption in 2013, averaging
1.2 Bcf per day. Since 2010, a trend of less expensive natural gas relative to other fuels has led to an
increase in the share of total electricity generated by natural gas in the region (Figure 8).
Figure 8. Natural gas share of total generation
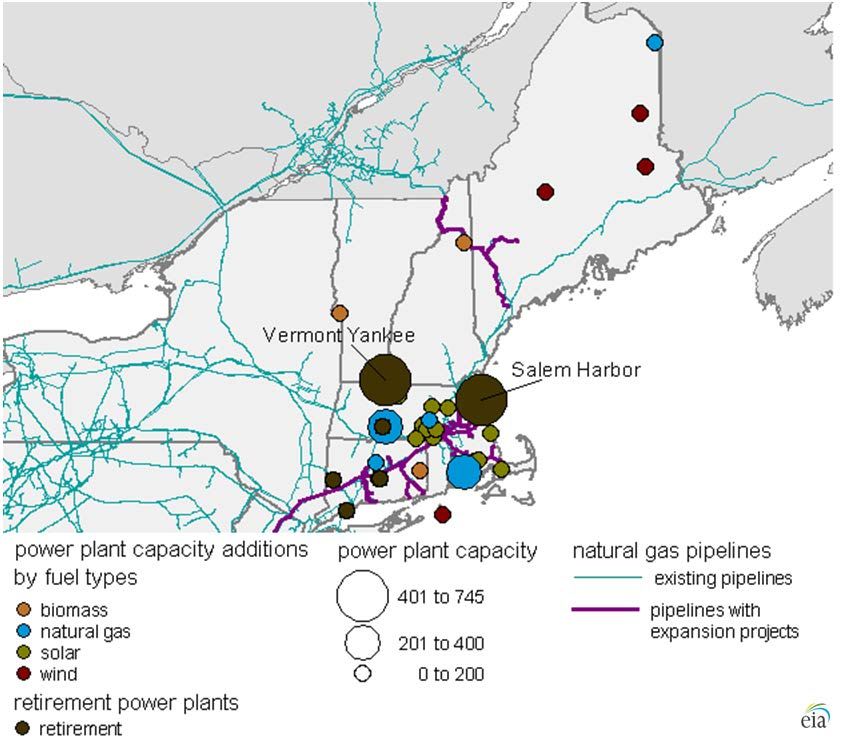
This price pattern has increased the use of natural gas-fired capacity in the region and contributed to
generally lower wholesale power prices. The lower wholesale power prices along with some
environmental regulations at the regional and national levels have contributed to planned retirements
of some large electric power plants in New England that use other fuels (Figure 9), including Vermont
Yankee (a 620-MW nuclear generator with a planned retirement date of December 2014) and Salem
Harbor (a 744-MW coal- and oil-fired power plant with a planned retirement date of June 2014). The
planned retirement of the Vermont Yankee and Salem Harbor power plants could result in as much as
0.11 Bcf per day of additional natural gas demand in the power sector during winter months, if typical
demand patterns hold and all the output of these units is replaced by natural gas generation.
6Figure 9. New England planned energy infrastructure changes between 2013 and 2016
Source: U.S. Energy Information Administration.
Increased pipeline utilization rates on peak days create physical stress on the natural gas transport
system, which leads to reliability concerns for electric power sector deliveries. These deliverability
concerns led the Independent System Operator of New England (ISO-NE), the electric grid operator for
the region, to create a special winter reliability program for this winter. The program includes:
• demand-response program;
• incentives to ensure oil-fired generators increase their fuel inventories;
• payments to dual-fueled units for testing their capacity to use oil; and
• some changes to the market-monitoring procedures aimed at increasing the flexibility of dual-
fueled units
The deliverability problems cited in the ISO-NE winter reliability program are a key reason to have oil-
fired backup and dual-fired unit capacity in the region.
7Potential solutions
There are a number of potential solutions to lessen the impact of limited peak supply at peak demand
times.
Pipeline expansion to New England. With rising natural gas output from the Marcellus production field,
pipeline expansion to move this gas to New England is one option for alleviating market stress. The key
is to deliver more natural gas to Massachusetts, especially the Boston area, because it is the largest
market in New England. Major energy infrastructure projects in metropolitan areas such as Boston and
New York City, however, are capital intensive. Regulated pipeline companies typically seek financial
assurance by signing long-term firm transport capacity contracts with shippers. Companies that sign firm
capacity contracts will benefit financially when spreads widen substantially in New England. On the
other hand, firms signing these contracts also assume the financial liability.
In 2011, Spectra Energy (operator of the Algonquin pipeline) proposed the Algonquin Incremental
Market (AIM) Project to expand its citygate capacity by a nonbinding nomination of 1 Bcf/day. In
December 2013, the proposed capacity expansion was 0.33 Bcf/day, with the target completion in
November 2016. 5 The size of the pipeline capacity expansion was reduced 65% from the original
proposal because of lack of interest in signing up for long-term firm transport capacity contracts. 6 So
far, only regulated utilities, including UIL Holdings, Northeast Utilities, National Grid, and NiSource, have
shown a willingness to absorb the financial cost embedded in the long-term firm contracts. 7 In addition
to Spectra, Tennessee Pipeline proposed an expansion project of up to 1.2/day into the Boston area,
with expected completion in 2018. 8
In general, public utility commissions (PUCs) require utilities to seek approval for signing long-term
contracts and the rate hikes required to pay for them. The reduction in the proposed expansion capacity
of the AIM project may indicate hesitation by and their regulators. Pipeline rates approved by FERC and
utility rates approved by PUCs need to be consistent for success in pipeline expansion.
U.S. LNG. Utilities in New England might also enhance winter supply reliability by investing directly in
proposed U.S. LNG liquefaction plants and receiving occasional LNG cargoes as a stipulation of their
investment. It may be possible that investing a relatively small amount of capital could provide access to
this source of swing supply during periods of high winter demand in New England.
Physical peaking option contracts. To mitigate the market risk of such high-price patterns, one effective
instrument is a physical peaking option to manage the physical supply and financial price risk on peak
5
Algonquin Incremental Market (AIM) Project, Spectra Energy, http://www.spectraenergy.com/Operations/New-Projects-and-
Our-Process/New-Projects-in-US/Algonquin-Incremental-Market-AIM-Project/ and DEEP Electric IRP Gas Stakeholder Meeting,
Hartford, CT, September 20, 2011, Spectra Energy,
http://www.ct.gov/deep/lib/deep/energy/irp/naturalgas/irp_2012_stakeholdermtg_naturalgas_spectraenergy_092011.pdf
6
Utilities seek boost in region’s natural gas, the Boston Globe, November 5, 2013,
http://www.bostonglobe.com/business/2013/11/05/agreements-with-utilities-moving-pipeline-expansion-
forward/8uyv2tJ9dqhXReB3BxgkYN/story.html.
7
NGA Pre-Winter Briefing, Spectra Energy, November 6, 2013,
8
Northeast Gas Association Pre-Winter Briefing 2012 / 2013, Kinder-Morgan, December 3, 2012,
www.northeastgas.org/pdf/d_skipworth.pdf
8demand days. 9 The contract buyer purchases a fixed quantity of gas from a peak supplier, such as an
LNG storage facility, for a specified open window of time, price, and number of days on which the buyer
can call for delivery of the gas at the agreed price and volume. The buyer pays the option premium to
the LNG facility for this right. Volumes tend to be small, as the right to buy the gas would only be
exercised as an emergency on days of peak demand, such as a very cold day when the spot price spikes.
However, in recent years, New England has developed problems that may prevent the economic use of
an LNG-based peaking option:
• The increased frequency of price spikes has made options more expensive.
• Supplies from Canada’s eastern offshore production areas declined, making the overall premium
more expensive.
• Because LNG is traded globally, higher international LNG prices have increased competitive
buying pressure for the gas.
With the increase in the forward basis for the winter of 2013-14 as described above, Canaport and
Everett may be able to lock in LNG supplies to New England, but the cost to consumers is higher than in
recent years because of the above factors.
Fuel substitution. In periods of high natural gas prices, users could substitute less-expensive fuels if
possible. Natural gas consumption by the power sector declined in January 2013 compared to January
2012 (Figure 10), encouraged in part by higher natural gas spot prices. When natural gas prices hit a
historic low in the summer of 2012, it was widely reported that many power generating units switched
from eastern coal to natural gas. More importantly, during the peak-demand season when natural gas
prices spike, power generating units tend to switch from natural gas to fuel oil. In addition to power
generation, other natural gas consumers, such as universities, factories, or even residential customers,
also benefit from optimizing their fuel strategy when a backup-fuel is available. Regulatory restrictions
and other issues, however, may limit the extent that fuel substitution can occur, which will constrain the
effect of fuel switching even in periods of peak demand.
9
Imported LNG: a Reliable Peaking Option for New England, Repsol Presentation, April 30, 2013,
www.northeastgas.org/pdf/v_morrissette_repsol.pdf and GDF Suez Gas NA, GDF Suez Presentation, December 3, 2012,
www.northeastgas.org/pdf/g_whitney.pdf.
9Figure 10. New England fuel consumption for power generation, annual vs. January average
Demand curtailment. Utilities in both New England and New York City are able to offer interruptible
services to customers with dual-fuel capability. New York City has a widely used feature in which utilities
offer retail customers firm services and interruptible services. Natural gas consumers with dual-fuel
backup have an option to buy interruptible natural gas services at a substantial discount. Consumers
with interruptible services can choose to switch from natural gas if another fuel is less expensive. If
market activities fail to reduce peak demand below available supply, however, utilities make curtailment
calls to ensure supply reliability, which require natural gas consumers with interruptible services to
switch from natural gas to another fuel regardless of costs. Customers who fail to comply will incur
monetary penalties. 10
The retail curtailment mandate lowers peak demand, which helps reduce price spikes during high-
demand periods. When curtailment is called, customers may have to pay higher prices to switch from
natural gas to alternative fuels, but they may still be better off than paying higher premiums up front to
purchase firm services.
Price comparison between New England and New York City. Both Boston and New York City had
natural gas price spikes in the winter of 2012-13 (Figure 11). So far in the winter of 2013-14, however,
natural gas price spikes in New York City remained less frequent than in Boston, although on the coldest
days the spot prices tend to be higher in New York City than in Boston. Natural gas pipeline expansion
into the New York City area may be providing a buffer against the frequency of price spikes this winter.
Encouraged by the proximity to Marcellus natural gas production and rising baseload consumption,
pipeline capacity increased, and this likely contributed to the mitigation of price spikes in the New York
10
OFO and Curtailment, SCANA Energy Marketing,
http://www.scanaenergymarketing.com/SCANA.ESS.Templates/Content/Content100.aspx?NRMODE=Published&NRNODEGUID
=%7bF78CDC8B-8C39-40A8-961E-D84EB1183F1A%7d&NRORIGINALURL=%2fen%2fnatural-gas-education%2fofo-and-
curtailment%2f&NRCACHEHINT=Guest#curtailment
10City area. In addition, effective retail demand curtailment in New York City provides peak supply
reliability and, in turn, reduces price volatility.
Figure 11. Natural gas spot prices in Boston and New York City
The forward basis markets have also shown widening differentials (Figure 12). At Transco Zone 6 New
York, the January 2013 forward basis settled around $3/MMBtu, while the Algonquin Citygate January
2013 forward basis reached more than $6/MMBtu. The deviation widened rapidly in 2013. The January
2014 forward basis at Transco Zone 6 New York settled at $4.89/MMBtu, but the Algonquin Citygate
forward basis for the same contract settled at $17.41/MMBtu. The 2015 basis differential also remains
wide, indicating the market expectation that New England’s peak supply problems will continue into the
winter of 2014-15.
11Figure 12. Natural gas forward basis for January 2013, January 2014, and January 2015
Conclusion. Limited peak supply contributed to substantial increases in New England natural gas prices
and basis on high-demand days this winter and last winter. New York City reduced spikes in prices and
basis by adding pipeline capacity and by using retail demand curtailment, solutions that could help New
England as well. Companies have proposed pipeline expansion, but getting the financial commitments to
move forward has been difficult because the additional capacity may only be necessary for short periods
during the year. Pipeline expansion may become more viable if baseload consumption of natural gas to
generate electricity continues to increase. The high January 2015 forward basis for Boston indicates that
market participants do not expect a resolution to these peak supply issues before next winter.
12You can also read