The models of physical processes of bees winter aggregation
←
→
Page content transcription
If your browser does not render page correctly, please read the page content below

Journal of Physics: Conference Series

PAPER • OPEN ACCESS

The models of physical processes of bees winter aggregation
To cite this article: S V Oskin et al 2019 J. Phys.: Conf. Ser. 1278 012028

View the article online for updates and enhancements.

                                This content was downloaded from IP address 176.9.8.24 on 24/06/2020 at 23:37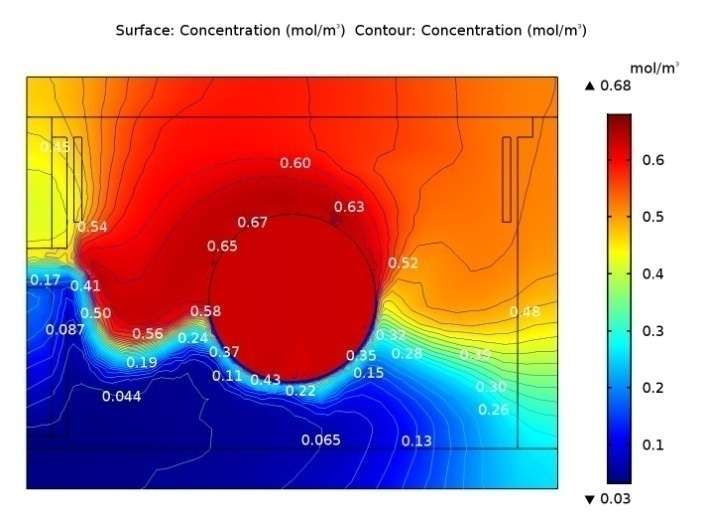
VSPID2018                                                                                                       IOP Publishing
IOP Conf. Series: Journal of Physics: Conf. Series 1278 (2019) 012028                     doi:10.1088/1742-6596/1278/1/012028

The models of physical processes of bees winter aggregation

                     S V Oskin1*, D A Ovsyannikov 2 and D S Tsokur 3
                     Dept. of Electric Machines and Electric Drive, Kuban State Agrarian University
                     named after I.T. Trubilin, 13 Kalinina Str., 350044 Krasnodar, Russian Federation

                     E-mail: *1kgauem@yandex.ru, 2beestim@mail.ru, 3blin_dima@mail.ru

                     Abstract. The analysis of physical processes happening in beehives was carried out for 15 000
                     bees in winter aggregation. In the current study changes of bees aggregation volume during
                     winter season as well as bonds between heating, air exchange and humidity were considered.
                     Simulation of physical in-hive processes was carried out with the help of software Comsol 5.3.
                     Temperature fields analysis confirms the availability of the high thermal insulation ability of
                     bees. On the surface of the bees aggregation the temperature is +12°C. In spite of temperature
                     fluctuations outside the aggregation, inside of the latter temperature is maintained at the level
                     of +25°C...+32°C. Within the aggregation temperature is distributed uneven, and there are
                     zones of higher temperature values not exceeding +34°C, which is not harmful for bees.
                     Analysis of air exchange processes demonstrates that the air velocity near the beehive entrance
                     is 0.03...0.1 meters per second, and in the central inlet – 0.12...0.17 meters per second. The
                     highest air velocity values – exceeding 0.19 meters per second – are achieved inside of the bees
                     aggregation. Humidity level within beehives is uneven. Identity of thermal fields obtained with
                     thermal camera and results of the simulation demonstrates the high level of its concordance.

1. Introduction
To overcome winter season is crucial for beekeeping - efficiency of bee family during the rest of a
year, particularly spring honey harvest, depends on it. There are many studies devoted to this topic [1-
7]. Thorough analysis done with the help of modern software was carried out by V.A. Toboev,
E.K. Yeskov, M.S. Tolstov [8-12]. The peculiarity of winter condition of bees is its ability for
aggregation and maintaining of the internal temperature at the level of 24...32°C in spite of the wide
range of outer temperature fluctuations. At the end of winter season brood appears, and bees increase
internal temperature up to 34°C. Rise of the temperature happens because of honey consumption by
bees and permanent ventilation of its aggregation. In spite of huge amount of studies around this topic,
the further investigation of in-hive physical processes is required. The necessity of a complete picture
of bees life activity is caused by the need to increase the honey production in Russia. Up to now, there
are no exact recommendations concerning the amount of honey required for supporting of bees vital
activity during the winter season, how the in-hive ventilation system should be designed, etc. It is
especially important for winter heating due to the necessity to choose a proper operation mode of
heaters. The optimal mode is important because overheating could invoke redundant honey
consumption, and provoke a queen for oviparity during cold season which will lead towards death of a
whole family. Thus, such investigation should be carried on in order to create optimal conditions for
bee families during the winter, and to prevent high temperature fluctuations inside of beehives. There
are huge differences in ways of wintering depending of geographical location of bee families. For
example, peculiarities of bees wintering at North Caucasus are the following: late bees aggregation,

              Content from this work may be used under the terms of the Creative Commons Attribution 3.0 licence. Any further distribution
              of this work must maintain attribution to the author(s) and the title of the work, journal citation and DOI.
Published under licence by IOP Publishing Ltd                          1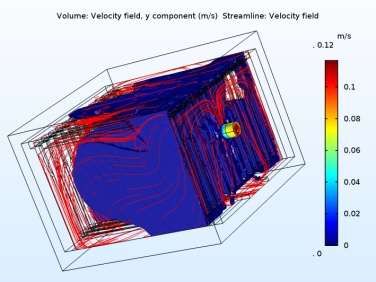
VSPID2018 IOP Publishing
IOP Conf. Series: Journal of Physics: Conf. Series 1278 (2019) 012028 doi:10.1088/1742-6596/1278/1/012028
wide range of temperature fluctuations during autumn and winter, early appearance of brood. The
objective of the study is to develop the models of in-hive physical processes, examine results of
simulation and compare it with thermal camera shots.
2. Theoretical analysis
For analysis of in-hive physical processes we have considered 15000 bees located in Dadant beehives
equipped with 12 wax frames. During the winter season bees are collected together as a sphere. We
have represented a winter bee-aggregation as separate cylinders of different sizes which, assembled
together, resemble a sphere. During the winter bees permanently ventilate its aggregation in order to
eliminate excess of moisture - a result of honey consumption. As soon as the ambient temperature is
increased, the density of the bees aggregation decreases, and the distance between bees is increased. In
order to simulate the air flow through the aggregation, the pathways between frames (further in the
text - pathways) were split onto air cylinders (two cylinders per a pathway) with varied height. The
volume of these cylinders is equivalent to the overall volume of air per pathway where bees are
located. We have assumed that there is a linear relation between the density of bees and outside
temperature. The correspondent equation will look as follows:
bee 243 8 T0
where T0 — temperature of outside air, bee — density of bees aggregation.
Heat transfer coefficient of bees bee depends on density of its aggregation – if the coefficient
increases, then thermal conductance also increases, on average from 7.6·10-2 W/(m·K) to
0.126 W/(m·K) [6, 7, 13]. It means that heat transfer coefficient also will change linearly, in
accordance with the equation:
bee 0.076 0.0017 T0
We can assume that heat transfer of bees in cells will be influenced by heat conductivity only, and
heat transfer of bees located on pathways – through heat conductivity and internal convection in the
beehive.
The peculiarity of such analysis is consideration of changing volume of bees aggregation during
wintering. In winter density of the aggregation changes, which means that the radius of the
aggregation sphere changes due to the ambient temperature fluctuations.
It is well known, that the plot heating power versus ambient temperature is parabola [6, 13, 14]. For
the observed case (15000 bees) the approximation equation looks as following:
Pbee 0,016 T02 0,1 T0 4,61
For the further analysis the power density created by bees is required. We have divided (3) by
aggregation volume and obtained the equation for intensity of heat generation:
Pbee 0,016 T02 0,1 T0 4,61
Qbee 3,2 T02 20 T0 922
Vbee 0,005
where Vbee – volume of the aggregation, Vbee = 0.005 m3.
Knowing that at the honey consumption rate of 0.32 g/h the power of 1 W is released [6, 15], the
equation for feed consumption rate in winter time is the following:
Gbee 0,005 T02 0,032 T0 1,475
In [7, 13] the equation for required air flow for moisture elimination is demonstrated:
q H 2O
Qair
Aout Ain
where q H 2O – share of moisture released during the feed oxidation, g/h; Aout , Ain – absolute
moisture content of outgoing and incoming air flow respectively, g/m3.
Amount of water released during the feed oxidation could be calculated as following:
q H 2O 0,68 Gbee
2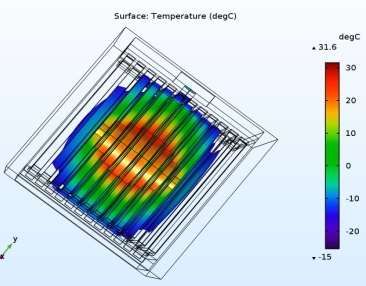
VSPID2018 IOP Publishing
IOP Conf. Series: Journal of Physics: Conf. Series 1278 (2019) 012028 doi:10.1088/1742-6596/1278/1/012028
Using the charts for transformation relative moisture into absolute moisture, we have obtained the
following approximation equation for calculation of required air flow (m3/h):
0,0034 T02 0,0216 T0 1 0,0034 T02 0,0216 T0 1
Qbair
Aout100 Ain80 (0,007 T0 11,5) (0,0065 T02 0,3 T0 4,03)
Simulation of in-hive physical processes was carried out in Comsol 5.3 Multiphysics. The initial
and boundary conditions for modeling were also established there. The obtained equations for
calculation of geometrical and physical parameters were entered into the respective program blocks.
The whole analysis was done for the stationary mode. The generic mathematical model describing
in-hive thermal processes is represented as following:
air1 c air1 u airr1 VT air2 c air2 u air2 VT Vq air1 Vq air2
q wood q hc q emptyhc qbee Nu Qbee
bee 0,0076 0,0017 T0 ; bee 243 8 T0
Q 3,2 T 2 20 T 922
bee 0 0
where air1 , air2 – density of incoming (block 1) and passing through the bees aggregation (block 2)
air flow respectively; cair1 , cair2 – thermal capacity of air flow in block 1 and air flow in block 2
respectively; u airr1 , u air2 – velocity fields of air flow in block 1 and air flow in block 2 respectively;
qair1 , qair2 , qwood , qhc , qemptyhc , qbee – densities of waste heat flows caused by heat transfer in air
block 1 and air block 2, wooden elements, honey cells, empty cells and bees aggregation respectively,
W/m2; Nu – Nusselt number.
The equation (9) describes the heating processes within beehive and within bees aggregation as
well. The temperature inside the club is always positive.
In stationary laminar mode the mathematical model of air mass movement could be represented as
follows:
u u 0
air1 air1 air1 air1
2 2
0 u air1 u air1 u air1 I u air2 u air 2 u air2 I
T T
3 3
2
0,0034 T0 0,0216 T0 1
u in
(0,007 T0 11,5) (0,0065 T02 0,3 T0 4,03) 1,44 10 3
p1 pI u air in 2 u air in 2 T 2 u air in 2 I
3
p pI u 2
air out2 u air out2 u air out2 I
T
2
3
where p - pressure, Pa; — dynamic viscosity, Pa∙s; I – unit vector; u in – air velocity at the
entrance in a beehive; p1 , p 2 – pressures at the incoming and outgoing surfaces of the air block;
u air in 2 , uair out2 – air velocity at the entrance to and exit out of a bee aggregation.
The pressure values, p1 and p2 were determined by preliminary iterations of different outdoor
temperature values. The criterion for fixing the pressure values is the temperature at certain points of
the club. As a result of such iterative calculations, approximations for the pressure at the entrance to
the bee club were obtained.
p1 2 10 6 T06 10 6 T05 6 10 6 T04 0,0001 T03 0,001 T02 0,19 T0 0,159 (11)
Using this equation, the modeling of the main thermophysical processes occurring in the hive and
in the bee club was carried out. The temperature at the edge of the club did not fall below 10-12 °С,
and inside the club was no higher than 30-33 °С, which corresponds to the data given by numerous
authors.
3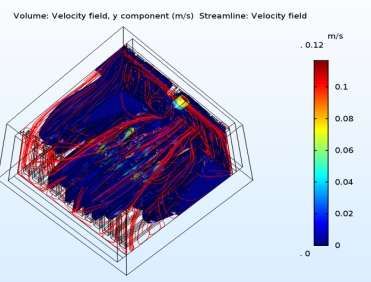
VSPID2018 IOP Publishing
IOP Conf. Series: Journal of Physics: Conf. Series 1278 (2019) 012028 doi:10.1088/1742-6596/1278/1/012028
Simulation of humidity changes was carried out considering convection, diffusion and adsorption
based on Fick law, Navier-Stoks equation, Darcy’s law. The generic model of humidity changes
considering diffusion and convection could be represented as following:
с water
t Dwaterс water u c water 0
j1 Dwaterс water u c water 0
c
t b Pwater
D e с water ; b
1 p
j D с
2 e water
where сwater , Dwater – concentration and diffusion coefficients of water respectively; j1 , j 2 -
diffusion flows in gas and solid phases respectively; cPwater – concentration of moisture in solid phase;
b – equivalent density of solid matter, b 1 p ; p – porosity of the material; De – efficient
share of diffusion coefficient.
We have obtained three mathematical models (9), (10), (12) which are interconnected via physical
parameters. These models describe generic in-hive processes: heating, humidity, air flow.
3. Research results and discussion
We have carried out simulation of the stationary mode for several values of critical temperatures of
ambient air: –28ºС, –20ºС, –10ºС, –5ºС, 0ºС, +5ºС, 15ºС [16-18]. For the temperature – 28°C the
following temperature fields were obtained – figure 1. At the figure 1 it is visible that the significant
in-hive space is covered by sufficient negative temperatures – from –15°C to –20°C. At the same time
the temperature of bee aggregation is maintained at the value of +29°C.
Figure 1. Temperature fields of a beehive.
4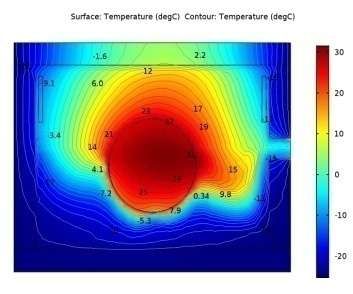
VSPID2018                                                                                     IOP Publishing
IOP Conf. Series: Journal of Physics: Conf. Series 1278 (2019) 012028   doi:10.1088/1742-6596/1278/1/012028

   At the sections of a beehive done perpendicularly to the front wall or parallel to it (figure 2) it is
visible that heat partially goes out through the central inlet together with eliminated air. At the figure 2
the zones of maximal temperature are visible as well. These pictures prove assumptions that low
temperature is concentrated at the bottom part of a beehive, and higher temperature is located in upper
part of a beehive.

                          Figure 2. Temperature fields of a beehive at sections.

   The studies described below were devoted to the analysis of in-hive air flow. At the figure 3 the air
velocity and air path are represented from different observation points for the ambient temperature of
– 25°C. It was defined that air velocity at the beehive entrance is 0.01...0.02 m/s, and at the exit from
the beehive (central inlet) – 0.12 m/s. Trajectories of incoming air show that air comes in through the
bottom inlet and is distributed further between frames and moves along the rear wall.

                       Figure 3. Beehive views demonstrating in-hive air velocity.

    Analysis of the trajectories and air velocity in separate zones of the bees aggregation shows that air
velocity within the aggregation is uneven – there are zones where air velocity is 0.15...0.17 m/s, which
is a quite high value. The smallest value of air velocity is observed at the periphery of the aggregation
as well as at the upper part of the latter – 0.04...0.06 m/s. It is reasonable from the biological point of
view: at the edge of the aggregation bees are exposed to the low ambient temperature and its vital
processes are slowed-down. Nevertheless, there are zones of high air velocity at the edge of the
aggregation – these are zones of incoming air. Within the aggregation temperature is high, and bees
actively ventilate it.
    Studies of moisture distribution within a beehive shown how ambient air with humidity of 0.04
moles per cubic meter comes inside the beehive from the bottom inlet. At the upper point of the

                                                       5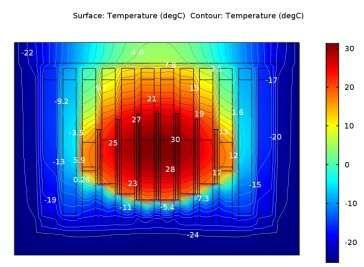
VSPID2018                                                                                     IOP Publishing
IOP Conf. Series: Journal of Physics: Conf. Series 1278 (2019) 012028   doi:10.1088/1742-6596/1278/1/012028

beehive moisture concentration reaches the values of 0.5...0.6 moles per cubic meter, which is a result
of moisture elimination out of the aggregation. At the figure 4 the central section of a beehive is
shown with moisture distribution field. It is visible that the highest moisture concentration is located
inside the bees aggregation as well as at the point where humid air leaves the aggregation. Incoming
air as well as bottom zone of the beehive have the lowest moisture concentration.

                Figure 4. Central section of the beehive with moisture distribution field.

    Analysis of moisture distribution considering properties of constructive elements of the beehive
(wood) proves that wooden parts are saturated with moisture of boundary air. Absorbed at wooden
parts moisture is visible, especially at the upper part of the beehive – this phenomena meets reality (it
is observed in spring time while opening beehives).
    Based on obtained simulation results the following conclusions were done. Results of simulation
and analytical expressions for thermal parameters are in concordance with the thermograms done by
other research groups [15, 19, 20].
    Experimental studies of microclimate within beehives were done at the apiary located at
Mostovskoy district, Krasnodar region. Thermal fields were studies at a beehive of Dadant type with
12 frames, in autumn season the bee family was located at 10 frames. The next stage of the experiment
was thermal shot of ceiling of the beehive without lid. Thermal shot was done during winter season at
the different levels of ambient temperature. The thermogram done at the temperature –3°C was
compared with results of the simulation relevant for the same temperature (figure 5).

                                                       6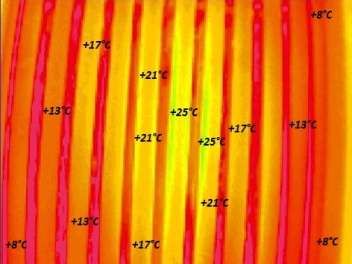
VSPID2018                                                                                     IOP Publishing
IOP Conf. Series: Journal of Physics: Conf. Series 1278 (2019) 012028   doi:10.1088/1742-6596/1278/1/012028

   Figure 5. Thermograms of the beehive surface without lid (on the left) and results of simulation
                                         (on the right).

   Concordance of thermograms and results of the simulation was verified for the beehive without
rear wall. Thermal shots as well as simulation were carried out at the ambient temperature –8°C. At
the figure 6 the obtained thermograms are presented. It is visible that temperature fields are similar,
but the zone where bees are located looks wider at the thermal shot. This difference could witness that
bees cover more frames, and most likely that aggregation was expanded parallel to the bottom of the
beehive. At the same time it is visible that temperature values at the thermogram and simulation
picture are equal, and heat distribution has similar character.

      Figure 6. Thermograms of the beehive surface without rear wall (on the left) and results of
                                     simulation (on the right).

   Experimental study of the temperature field within bees aggregation was carried out in accordance
with the following method. Due to the possible harmful impact onto bee families in winter season, the
temperature analysis was done through taking out edge frames from the beehive, and rapid thermal
shot was done (a frame containing honey has a significant thermal capacity). At the figure 7
thermograms obtained though thermal shot and simulation are represented for the ambient temperature
+2°C. It is visible that thermal fields are identic, but experimental shot shows wider zone occupied by
bees.

                                                       7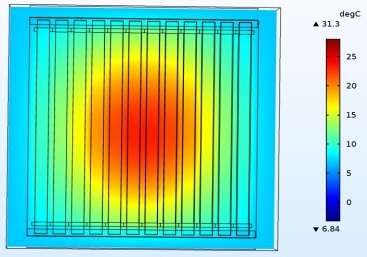
VSPID2018                                                                                     IOP Publishing
IOP Conf. Series: Journal of Physics: Conf. Series 1278 (2019) 012028   doi:10.1088/1742-6596/1278/1/012028

    Figure 7. Experimental thermograms (on the left) and results of simulation (on the right) of the
                                             frame.

4. Conclusion
The set of equations describing the interconnection of geometrical and physical parameters of bees
winter aggregation and ambient temperature is adequate to the real behaviour of bees family. Obtained
equations describe the microclimate parameters within bees aggregation considering the changes of its
dimension and internal ventilation. Pictures of thermal fields prove the high thermal insulating ability
of bees, and it is visible how temperature changes within and outside of bees aggregation. The section
of the temperature filed at the fourth frame (counting in the direction from the centre towards walls)
demonstrates that significant share of heat is lost through the central inlet together with outgoing air.
Analysis of temperature changes inside the bees aggregation confirms the assumption that the lowest
temperature is on the bottom surface of the aggregation which corresponds to [13]. Analysis of the in-
hive air flow demonstrates that minimal air velocity is observed at the entrance to the beehive, and
maximal air velocity is observed at the exit (central inlet) of the beehive. The highest air velocity –
over 0.17 m/s – is observed inside of a bee aggregation. Obtained values of air velocity in the separate
fragments of the bees aggregation are reasonable from the biological point of view – at the edge of the
aggregation bees are exposed to the lower temperatures and its vital processes are slowed-down. At
the same time within the aggregation temperature is higher, bees are more active and ventilate more
actively. In winter season the moisture distribution is uneven: incoming air at the bottom of the
aggregation contains 0.04 mole per cubic meter of moisture, and at the top of the aggregation moisture
content is 0.5...0.6 moles per cubic meter. It is caused by the process of moisture elimination out of the
aggregation.
    Experimental studies of thermal fields within beehives show that obtained thermograms are similar
to the results of simulation. Comparison of temperatures in different zones of a beehive has shown that
the temperature difference was not more then 2°C. Identity of the thermograms proves the possibility
of application of the obtained models for in-hive microclimate analysis also at the other setup
parameters (geometry, physical parameters, ambient temperature, quantity of bees). The further
development of the models should be done considering a heating device at the bottom of a beehive. An
adaptive energy efficient heating system for beehives could be developed on the basis of the obtained
models.

References
[1] Korge V N 2008 Basics of Beekeeping [in Russian – Osnovy pchelovodstva]( Rostov-upon-
        Don: Phoenix)
[2] Lebedev V I, Kasianov A I 2011 Thermal Mode and Energetic of Bee Families J. Beekeeping 2
        16-19
[3] Lebedev V I, Kasianov A I 2004 Thermogenesis and Thermal Mode of Bee Family (Rybnoe:
        Research Institute of beekeeping) p 178
[4] Triphonov A D 1990 Feed Consumption during the winter J. Beekeeping 11 21-23

                                                       8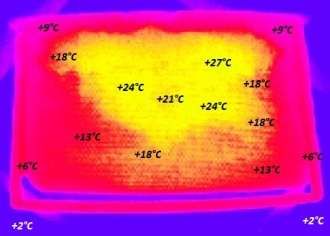
VSPID2018                                                                                     IOP Publishing
IOP Conf. Series: Journal of Physics: Conf. Series 1278 (2019) 012028   doi:10.1088/1742-6596/1278/1/012028

[5]    Triphonov A D 1991 Thermal exchange between a beehive inhabited by bees and environment
          J. Beekeeping 9 28-31
[6]    Kasianov A I 2003 Biology of heating of bee nests J. Beekeeping 2 16–21
[7]    Rybochkin A F, Zakharov I S 2004 Computer Systems in Beekeeping (Kursk: Kursk State
          Technological University) p 420
[8]    Yeskov E K 1983 Microclimate in Beehives (Moscow: Rosselkhozizdat)
[9]    Yeskov E K, Toboev V A 2011 Seasonal dynamics of thermal processes between frames of
          wintering bees Apis millifera J. Zoological 90 335–341
[10]   Yeskov E K, Toboev V A 2009 Mathematical modeling of thermal fields distribution in cold
          aggregation of insects J. Biophysics 54 114–119
[11]   Toboev V A, Tolstov M S 2014 Simulation of thermal processes in aggregation of wintering
          bees Conf. Physical Processes in Bio-systems 97–102
[12]   Toboev V A, Tolstov M S 2014 Simulation of convectional transfer in aggregation of honey
          bees J. of the Interdisciplinary Institute for "Science and Education” 3 116–119
[13]   Oskin S V, Ovsyannikov D A 2015 Electrotechnological Ways and Equipment for Increasing of
          Labour Efficiency in Beekeeping at North Caucasus (Krasnodar: Kron) p 198
[14]   Triphonov A D 1991 Ventilation of bees nests J. Beekeeping 6 15–18
[15]   Toboev V A 2006 Contemporary methods of studying of thermal homeostasis J. Beekeeping 10
          44–46
[16]   Oskin S V, Potapenko L V, Blyagoz A A 2016 Necessity of application of electrotechnological
          means for maintaining of microclimate for bee families J. Agritechnique and Power Supply 1
          12–21
[17]   Oskin S V, Potapenko L V, Pustovoytova E V, Rassolov N G 2017 Simulation of thermal mode
          of a beehive in winter period Proc. Int. Conf. Physical and Technical Issues of Development
          of New Technologies in Agriculture 206–210
[18]   Oskin S V, Potapenko L V, Ovsyannikov D A, Ilchenko Y A 2017 Adaptive technology of
          winter heating for bees J. of Kuban State Agrarian University 132 277–287
[19]   Omholt S 1987 Thermoregulation in the winter clusters of honeybee Apis mellifera J. of
          Theoretical Biology 128 219-231
[20]   Watmough J, Camazine S 1995 Self-organized thermoregulation of honeybee clusters J. of
          Theoretical Biology 176 391-402

                                                       9
You can also read