Climate and water resources Seasonal update - Greater Wellington ...
←
→
Page content transcription
If your browser does not render page correctly, please read the page content below
Climate and water resources
Seasonal update
Winter 2017 summary
Spring 2017 outlook

September 2017

Alex Pezza, Mike Thompson, Mike Harkness and Jon Marks
Environmental Science Department

For more information, contact the Greater Wellington Regional Council:
Wellington                     Masterton
PO Box 11646                   PO Box 41
                                                                         September 2017
T 04 384 5708                  T 06 378 2484
F 04 385 6960                  F 06 378 2146
www.gw.govt.nz                 www.gw.govt.nz                            www.gw.govt.nz
                                                                         info@gw.govt.nz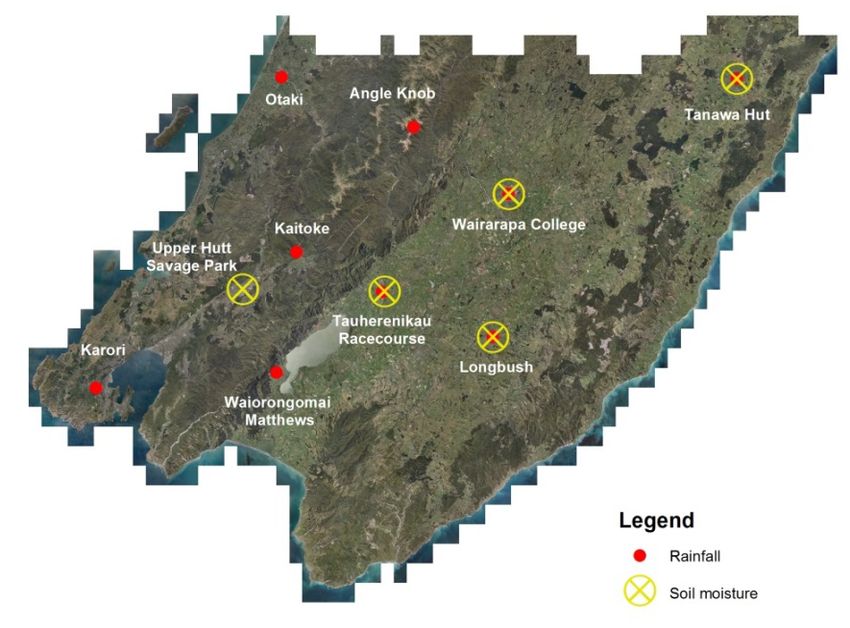
DISCLAIMER
This report has been prepared by Environmental Science staff of Greater Wellington Regional Council (GWRC) and as
such does not constitute Council policy.
In preparing this report, the authors have used the best currently available data and have exercised all reasonable skill
and care in presenting and interpreting these data. Nevertheless, GWRC does not accept any liability, whether direct,
indirect, or consequential, arising out of the provision of the data and associated information within this report.
Furthermore, as GWRC endeavours to continuously improve data quality, amendments to data included in, or used in
the preparation of, this report may occur without notice at any time.
GWRC requests that if excerpts or inferences are drawn from this report for further use, due care should be taken to
ensure the appropriate context is preserved and is accurately reflected and referenced in subsequent written or verbal
communications. Any use of the data and information enclosed in this report, for example, by inclusion in a subsequent
report or media release, should be accompanied by an acknowledgement of the source.
Overview
Winter 2017
Following from a highly unsettled summer and autumn, the wet and changeable weather
continued throughout winter in the Wellington region. The temperatures were slightly
colder than normal in June and July and warmer than normal in August. Rainfall in the
eastern Wairarapa was slightly below average, in contrast to the wet pattern elsewhere.
The rainfall distribution was also very irregular, with the driest June on record on the
Kapiti coast contrasting with heavy downpours in July and August, including the second
wettest Wellington day at the airport since 1958. In the central Wairarapa much of the
seasonal rainfall was shaped by a single July event, which alone brought about half of
the total seasonal accumulation. This erratic behaviour seems to be getting more
common in the region, and is in agreement with climate change predictions.

Climate drivers
The El Niño - Southern Oscillation (ENSO) phenomenon has been neutral and is
projected to remain so at least until the beginning of next year. The Southern Annular
Mode (SAM) has been predominately positive, with a large high pressure anomaly to
the southeast of New Zealand associated with weaker westerlies and increased
northerlies, bringing more humid air over the country. Sea ice extent around Antarctica
has been a near record low for this time of the year, and the sea surface temperatures
(SST) around New Zealand have been warmer than normal. Therefore the overall
situation has been variable conditions with increased moisture available due to the warm
waters surrounding the country and the northerly winds. Several climate models from
international climate forecasting centres are predicting the warm waters to persist
around New Zealand. The models are also predicting the establishment of a blocking
high south-east of New Zealand with a similar pattern to the one observed during winter
continuing, increasing the chance of more northerlies over the North Island, with a
circulation similar to a “mini La Niña”, even though the ENSO is forecast to remain in
the neutral range.

Climate outlook for spring 2017
Based on the neutrality of the climate drivers and the warm waters around New Zealand
with increased northerlies, we expect the unsettled climate pattern to continue
throughout Spring. The odds favour warmer than average conditions and variable
rainfall, tending to be on the wet side in the west and drier in the Wairarapa, but mostly
depending on individual events that can bring large amounts of rain in a short period of
time.
Contents
Overview                                                                     i
Winter 2017                                                                  i
Climate drivers                                                              i
Climate outlook for spring 2017                                              i

1.      Climate drivers                                                     1
1.1     El Niño – Southern Oscillation (ENSO)                               1
1.2     Sea ice extent and oceanic temperatures                             1
1.3     Southern Annular Mode (SAM)                                         2

2.      What is the data showing?                                            4
2.1     Regional temperature                                                 4
2.2     Regional wind                                                        5
2.3     Regional soil moisture assessment                                    5
2.4     Regional rainfall                                                    6
2.5     Observed rainfall and soil moisture conditions for selected sites    7
2.5.1   Rainfall accumulation for hydrological year (1 June to 31 May)       8
2.5.2   Soil moisture content (1 June to 31 May)                            12

3.      Outlook for spring 2017                                             13

Acknowledgments                                                             16
1.    Climate drivers
1.1   El Niño – Southern Oscillation (ENSO)
      The ENSO phenomenon has been neutral (slightly on the cool or La Niña side), and
      is expected to remain so at least until the beginning of next year (Figure 1.1). Most
      international models agree with the neutral pattern shown by the Australian model
      POAMA depicted in Figure 1.1, although bordering weak La Niña conditions.

      Figure 1.1: ENSO projections until May 2018 show conditions are tracking around
      neutral based on the Australian model. Most international models also indicate neutral
      conditions. Source: Australian Bureau of Meteorology.

1.2   Sea ice extent and oceanic temperatures
      The Sea Surface Temperature (SST) anomalies and the total sea ice extent (in white)
      are shown in Figure 1.2 for 7 September 2017. The Antarctic sea ice extent
      continues to track well below average for this time of the year especially south of
      New Zealand, with the August value being amongst the lowest on record over the
      period 1979-2017. The SSTs remained above average around New Zealand during
      winter and seem to be getting progressively warmer, although with some oscillating
      patches of colder than average water influencing the east coast at times. In the
      Equatorial Pacific a slight cool tongue is observed, even though the ENSO indicators
      remain neutral (the SOI index has been only slightly positive since mid-July). Most
      climate models are predicting warmer than average waters to persist over the next
      few months around New Zealand, with a possible “mini La Niña” pattern in the
      equatorial Pacific that is not expected to reach true La Niña strength. Therefore, any
      ENSO related influence would be only very minor.

                                                                             PAGE 1 OF 16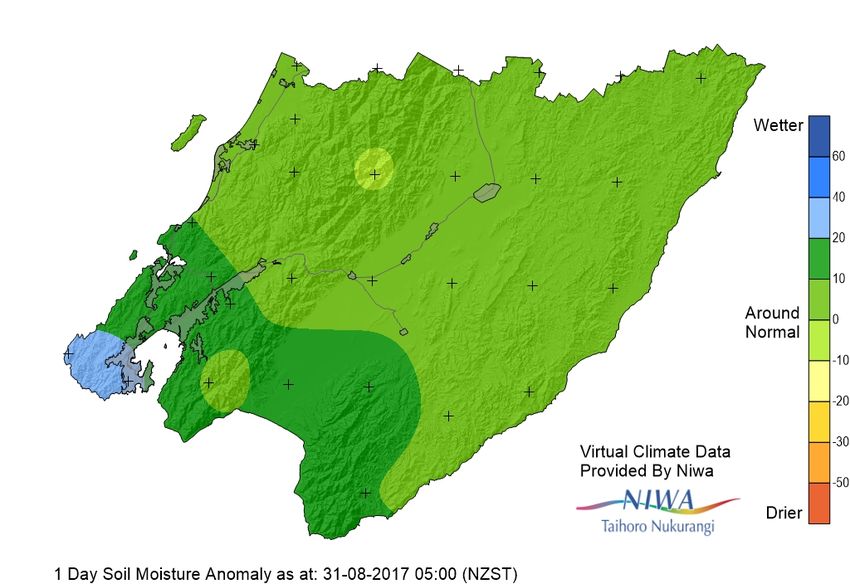
Figure 1.2: Sea surface temperature (SST) anomalies for 7 Sep 2017. Sea ice coverage is
           shown in white. Colder than average waters are seen in the high latitude belt around
           Antarctica (just north of the sea ice), while warmer than average values are seen around
           New Zealand. A mini La Niña pattern is also seen around the Equator, although all ENSO
           indicators remain neutral. Source: NOAA.

1.3        Southern Annular Mode (SAM)
           The SAM is the natural pressure oscillation between mid-latitudes and the Antarctic
           region. Normally positive SAM is associated with high pressures around the north
           island of New Zealand, keeping the weather stable and dry/cloud-free (especially in
           summer), whereas the opposite is expected when the SAM is in the negative phase.
           Figure 1.3 shows that the SAM was more on the positive side in winter, with a very
           strong high pressure southeast of New Zealand (indicated by ‘H’) and low pressures
           around Antarctica. This area of blocking high pressure was far from New Zealand
           and had only a small influence in blocking the flow, albeit with increased northerlies
           and increased moisture over the country during the last season.

PAGE 2 OF 16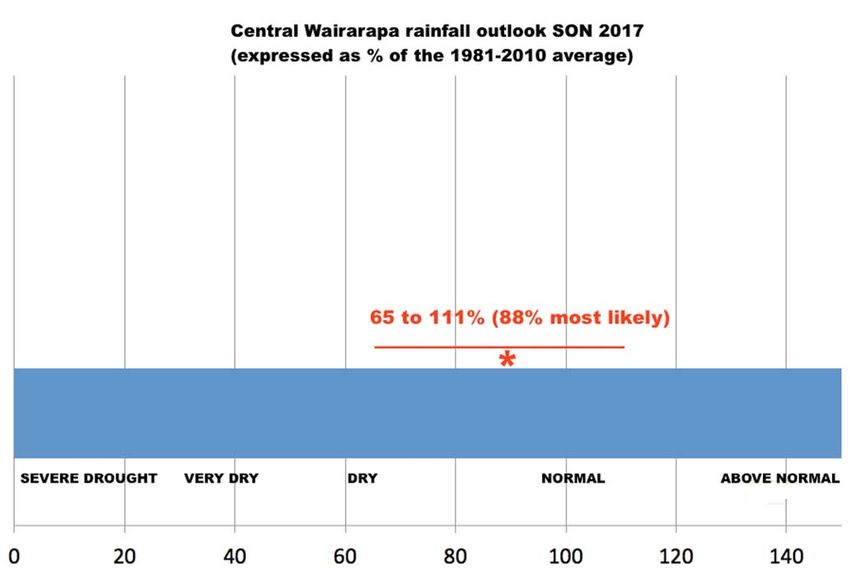
Figure 1.3: Sea level pressure anomalies for JJA 2017. The H indicates the area of
blocking high pressure east of New Zealand that helped bring more northerlies over
the North Island. Source: NCEP Reanalysis.

                                                                    PAGE 3 OF 16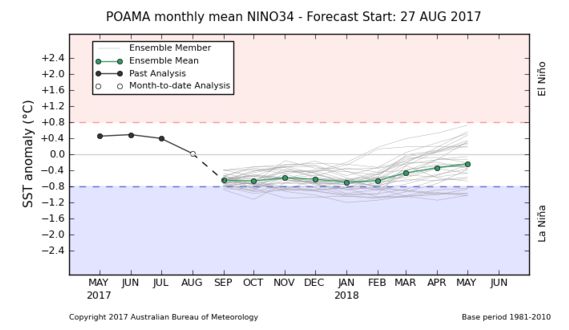
2. What is the data showing?
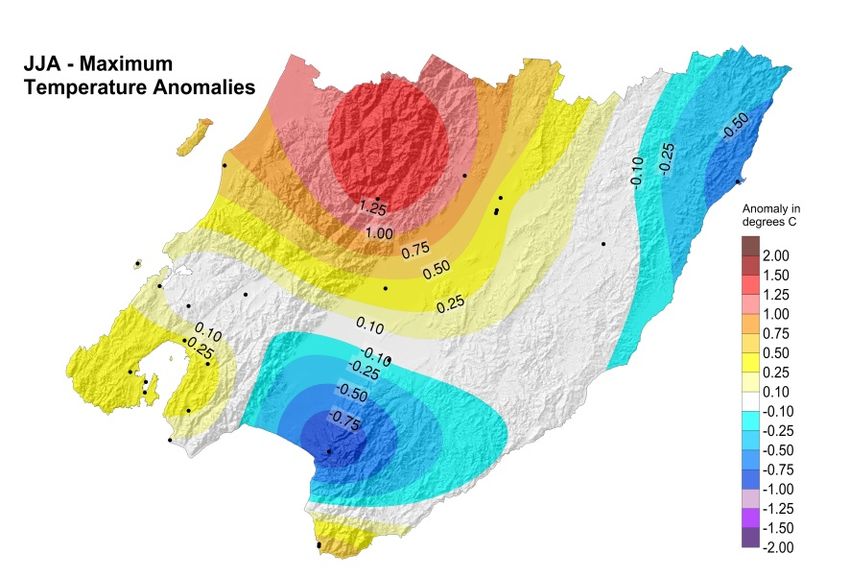
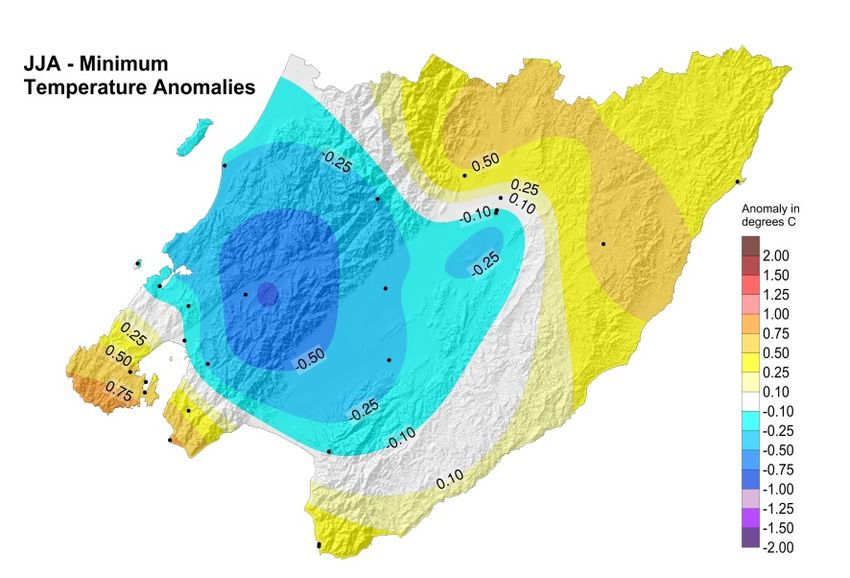
2.1 Regional temperature
Figure 2.1 shows the minimum and maximum temperature anomalies (against the
1981-2010 reference period) for the region based on all monitoring sites available
from GWRC, NIWA, Metservice and New Zealand Rural Fire Authority (all
meteorological stations indicated by dots). We can see an interesting pattern with
cooler than average minimum (night-time) temperatures from the west coast to
central Wairarapa, and cooler than average maximum (daytime) temperatures in
parts of the Wairarapa. This helps explain why winter felt cold for many, although
August was generally warmer than average. Figure 2.1 also shows a few areas with
above average temperatures including Wellington and the northern ranges, although
the excessive rainfall and lack of sun have “won over” the temperature, making it
feel colder than what it was.
Figure 2.1: Daily Average Min and Max temperature anomalies for JJA. All anomalies
calculated against the 1981-2010 reference period. Source: GWRC, using station data
from the GWRC, NIWA, MetService and NZ Rural Fire Authority networks.
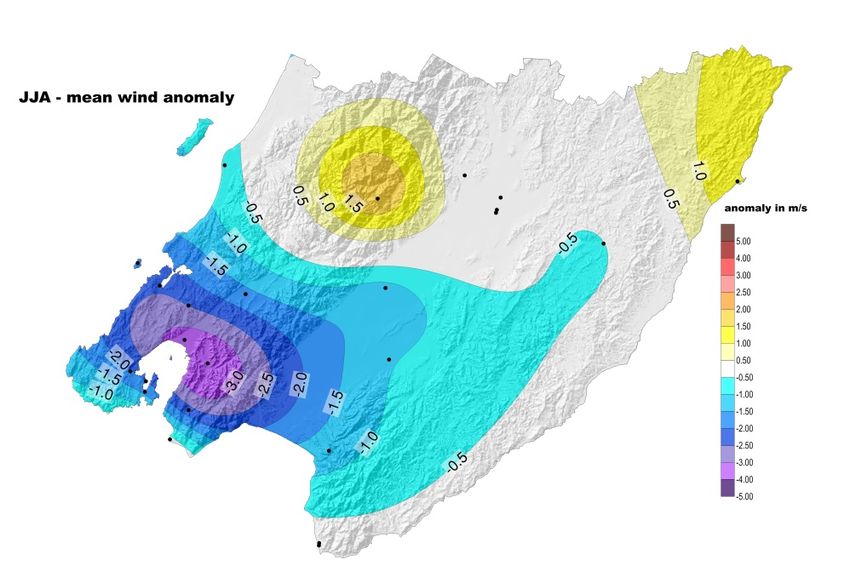
PAGE 4 OF 162.2 Regional wind
Figure 2.2 shows the mean wind anomalies (against the 1981-2010 reference period)
based on a similar network of stations as shown for temperature. We can see an
interesting pattern with overall weaker winds than normal in the southern part of the
region and normal or slightly stronger than normal in the northern part of the region.
As discussed before, the climate drivers were favourable for slightly weaker
westerlies than normal, but this new map makes it possible to see small variations
within the region, responding to local topographic features that could not be derived
by global reanalysis models. It highlights the importance of having a reasonably
high density of reliable measuring stations.
Figure 2.2: Daily mean wind anomalies (in m/s) for JJA. All anomalies calculated
against the 1981-2010 reference period. Source: GWRC, using station data from the
GWRC, NIWA, MetService and NZ Rural Fire Authority networks.
2.3 Regional soil moisture assessment
Figure 2.3 shows the soil moisture anomaly map for the region at the end of winter,
as of 31 August 2017. Most of the southern part of the region shows above average
soil moisture. There is no area of soil water deficit observed anywhere in the region
at present, as a result of the above average rainfall during the last three consecutive
seasons.
PAGE 5 OF 16Figure 2.3: Soil moisture anomaly for 31 August 2017. Moisture levels show above
normal conditions for most of the region, especially in the south. Source: GWRC, using
selected Virtual Climate Station Network (VCSN) data kindly provided by NIWA. Note that
this data is indirectly calculated by modelling and interpolation techniques, and does
not necessarily reflect the results obtained by direct measurements. This map should
only be used for a general indication of the spatial variability.
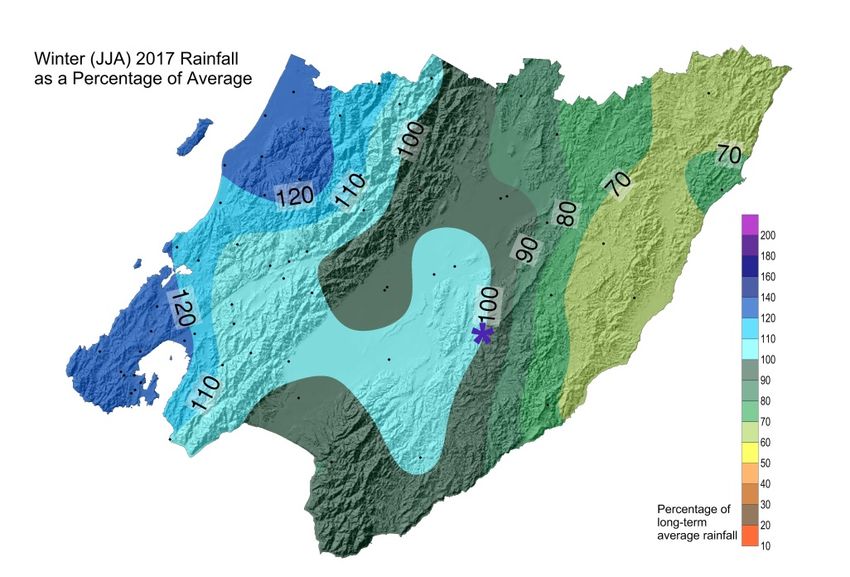
2.4 Regional rainfall
Figure 2.4 shows the regional winter rainfall expressed as a percentage of the long-
term average. Most of the region shows greater than average rainfall totals with only
the north-eastern Wairarapa showing totals below average.
The asterisk shows the location of the reference rainfall station (Waikoukou farm)
used to produce the climate analogues rainfall projection for the Wairarapa (see
section 3). The farm had about 110% of the 1981-2010 rainfall average over the
winter period.
PAGE 6 OF 16Figure 2.4: Rainfall for winter 2017 as a percentage of the long-term average. Above
average rainfall is seen for most of the region, except the north-eastern Wairarapa. The
asterisk shows the location of the rainfall time series at Waikoukou, Longbush, used
for the climate analogues rainfall projection (see Section 3). Source: GWRC.
2.5 Observed rainfall and soil moisture conditions for selected sites
Figure 2.5 shows the location of selected GWRC rainfall and soil moisture
monitoring sites. Plots of accumulated rainfall and soil moisture trends are provided
in the following pages.
Figure 2.5: Map of GWRC rainfall and soil moisture monitoring locations
PAGE 7 OF 162.5.1 Rainfall accumulation for hydrological year (1 June to 31 May)
The following rainfall plots show total rainfall accumulation (mm) for the
hydrological year for several years. For comparative purposes, cumulative plots for
selected historic years with notably dry summers in the Wairarapa have been
included, as well as the site average. Many of the GWRC telemetered rain gauge
sites in the lower lying parts of the Wairarapa (ie, not Tararua Range gauges
installed for flood warning purposes) have only been operating since the late 1990s
so the period of data presented is limited to the last two decades. For each historical
record plotted, an indication of ENSO climate state (El Niño, La Niña or neutral) at
that time is also given. GWRC does not operate a rain gauge in the southern-most
parts of the Wairarapa Valley that is suitable for presenting data in this report. This
means that we cannot be confident that the rainfall patterns seen elsewhere extend to
this part of the region other than the satellite and VCN data already presented.
Overall, accumulations for the year that has just started (ie, June 2017 to May 2018,
labelled 2017 on the plots) have been normal to above normal in the west and in the
Tararua range and normal to below normal in the east Wairarapa. In the Wairarapa,
about half of the winter rain fell in one event towards the middle of July. This
pattern, where a large event determines the average, is becoming the norm in the
Wairarapa, and agrees with climate change predictions for the region which
highlight the increasing irregularity of rainfall patterns.
Kapiti Coast
1600
Otaki Depot (Coastal Plain)
1400
1200
1000
Cummulative mm
800
600 1997 (El Nino)
2002 (El Nino)
400 2007 (La Nina)
2012 (Neutral)
2014 (Neutral)
200 2015 (El Nino)
2016 (Neutral)
0 Mean (1990-2015)
2017 (Neutral)
-200
Jun Jul Aug Sep Oct Nov Dec Jan Feb Mar Apr May Jun
PAGE 8 OF 16Southwest (Wellington city)
1800
Karori Sanctuary (Wellington City)
1600
1400
1200
Cummulative mm
1000
800
600
1982 (El Nino)
1997 (El Nino)
400 2007 (La Nina)
2012 (Neutral)
200 2014 (Neutral)
2015 (El Nino)
2016 (Neutral)
0
Mean (1990-2015)
2017 (Neutral)
-200
Jun Jul Aug Sep Oct Nov Dec Jan Feb Mar Apr May Jun
Hutt Valley and Tararua Range
3000
Kaitoke Headworks (Hutt River catchment)
2500
2000
Cummulative mm
1500
1000 1997 (El Nino)
2002 (El Nino)
2007 (La Nina)
500 2012 (Neutral)
2014 (Neutral)
2015 (El Nino)
0 2016 (Neutral)
Mean (1990-2015)
2017 (Neutral)
-500
Jun Jul Aug Sep Oct Nov Dec Jan Feb Mar Apr May Jun
PAGE 9 OF 1610000
Tararua Range (Angle Knob)
8000
6000
Cummulative mm
4000
1997 (El Nino)
2002 (El Nino)
2000 2007 (La Nina)
2012 (Neutral)
2014 (Neutral)
2015 (El Nino)
0 2016 (Neutral)
Mean (1990-2015)
2017 (Neutral)
-2000
Jun Jul Aug Sep Oct Nov Dec Jan Feb Mar Apr May Jun
Wairarapa
2000
Waiorongomai at Matthews
1800
1600
1400
1200
Cummulative mm
1000
800
600
2012 (Neutral)
2013 (Neutral)
400
2014 (Neutral)
2015 (El Nino)
200
2016 (Neutral)
Mean (1990-2015)
0
2017 (Neutral)
-200
Jun Jul Aug Sep Oct Nov Dec Jan Feb Mar Apr May Jun
PAGE 10 OF 161400
Tauherenikau at Alloa/Racecourse
1200
1000
Cummulative mm
800
600
400 2002 (El Nino)
2007 (La Nina)
2012 (Neutral)
200
2014 (Neutral)
2015 (El Nino)
0 2016 (Neutral)
Mean (1990-2015)
2017 (Neutral)
-200
Jun Jul Aug Sep Oct Nov Dec Jan Feb Mar Apr May Jun
1200
Masterton (Wairarapa College)
1000
800
Cummulative mm
600
400
2002 (La Nina)
2007 (La Nina)
200 2012 (Neutral)
2014 (Neutral)
2015 (El Nino)
0 2016 (Neutral)
Mean (1990-2015)
2017 (Neutral)
-200
Jun Jul Aug Sep Oct Nov Dec Jan Feb Mar Apr May Jun
PAGE 11 OF 161600
Whareama at Tanawa Hut
1400
1200
1000
Cummulative mm
800
600
1997 (El Nino)
400 2002 (El Nino)
2007 (La Nina)
2012 (Neutral)
200 2014 (Neutral)
2015 (El Nino)
0 2016 (Neutral)
Mean (1990-2015)
2017 (Neutral)
-200
Jun Jul Aug Sep Oct Nov Dec Jan Feb Mar Apr May Jun
1200
Waikoukou at Longbush
1000
800
Cummulative mm
600
400
2007 (La Nina)
2012 (Neutral)
200 2013 (Neutral)
2014 (Neutral)
2015 (El Nino)
0 2016 (Neutral)
Mean (1990-2015)
2017 (Neutral)
-200
Jun Jul Aug Sep Oct Nov Dec Jan Feb Mar Apr May Jun
2.5.2 Soil moisture content (1 June to 31 May)
The soil moisture plots for selected individual locations will be updated in the next
climate briefing covering spring. For a regional view refer to section 2.3. No areas of
significant moisture deficit were observed throughout the region over the last season.
PAGE 12 OF 163. Outlook for spring 2017
ENSO likely to remain neutral, with a slight flavour of a mini La Niña possible,
but with very little influence;
Sea surface temperatures mostly warmer than average around New Zealand with
increased moisture available for heavy rainfall events;
Fewer and weaker frosts due to elevated air and soil moisture;
Slightly weaker westerlies, possible enhanced northerlies with warmer than
average temperatures;
Around average rainfall, some dry spots in the Wairarapa and wetter in the west.
Total accumulation likely determined by a few extreme weather events
Whaitua* Variables Climate outlook for spring 2017
Temperature: Above average, weaker frosts due to elevated soil
Wellington moisture.
Harbour & Hutt
Valley
Rainfall: Average or above.
Temperature: Above average.
Te Awarua-o-
Porirua
Rainfall: Average or above.
Temperature: Above average.
Kapiti Coast
Rainfall: Average or above.
Average or above, weaker frosts due to elevated soil
Temperature: moisture.
Ruamahanga Average or below. Dry periods alternated by heavy
rainfall events. Chance of below average according to
Rainfall: climate analogues for the central-eastern area
(Longbush): 65 to 111% of the 1981-2010 average,
with 88% most likely – see graph below
Temperature: Average or above.
Wairarapa Coast
Rainfall: Average or below. Dry periods alternated by heavy
rainfall events.
*See http://www.gw.govt.nz/assets/Environment-Management/Whaitua/whaituamap3.JPG for whaitua areas
PAGE 13 OF 16Statistical rainfall projections for central Wairarapa via climate analogues
This is a new, experimental analysis that gives the likely rainfall range for the
coming season based on ‘climate analogues’. In this technique, a long and reliable
rainfall time series (ideally 100 years of data) is used as a reference to find how
much it rained during years in which the ENSO and oceanic temperatures around
New Zealand behaved similarly to what is actually happening in the current year.
Below we give details of the ‘analogue’ years used, the area of validity and the
previous scores. The analogue years will change from time to time depending on the
behaviour of the climate drivers.
Likely SON rainfall range: 65% to 111% (88% most likely) of the 1981-2010
average (see Figure 3.1). Confidence: LOW (no perfect analogue, weak climate
drivers and climate change signal).
Current analogue years: 1959, 1967, 1980, 1984, 1996, 2004 and 2011. The
current analogue years represent transition years without a strong ENSO signature.
Area of validity: This projection has been prepared based on long-term rainfall data
for Waikoukou (Longbush). The station is strategically located in central-eastern
Wairarapa, where rainfall can be regarded as an average of inland conditions (see
Figure 2.4 under main body of report). As such, the projected range should be valid
for most of the area south of Masterton and eastern of Lake Wairarapa, excluding
the coast.
Previous Scores: JJA predicted: 126% to 141% (134% most likely), using different
analogue years; JJA actual observation: 110% of the 1981-2010 average. Hence, the
observed conditions for JJA were above average as predicted, even though they fell
outside the predicted range using climate analogues.
Note to users: If you have historical rainfall data measured in your property within
the area of validity, you can calculate the most likely (actual) rainfall in mm by
directly applying the percentage range to your own long-term average. If you live
outside the validity area, you can still calculate the average (or ideally the median)
and standard deviation of the observed rainfall during previous years using the
climate analogues provided, to determine your own likely range for the current
season. This projection is a statistical guidance and assumes that previous years’
rainfall behaviour will more or less repeat, which may not be necessarily true, even
less so in light of climate change. Hence, these projections should be used with
caution and as general guidance of where the climate might be heading. The forecast
should be interpreted together with the text discussed in the whaitua tables above.
GWRC accepts no responsibility for the accuracy of these forecasts.
PAGE 14 OF 16Figure 3.1: Climate analogue statistical rainfall projection using data for Waikoukou,
Longbush (see Figure 2.4 for exact location), expressed as percentage range of likely
seasonal rainfall compared to the 1981-2010 average. Due to the erratic behaviour of
the climate drivers as well as the impacts of climate change there is low confidence in
the most likely value for this prediction.
PAGE 15 OF 16Acknowledgments We would like to thank NIWA for providing selected VCSN data points for the calculation of the regional soil moisture map. PAGE 16 OF 16
You can also read