Exercise 6: Muscle Physiology II - Twitch & Summation
←
→
Page content transcription
If your browser does not render page correctly, please read the page content below
Exercise 6: Muscle Physiology II – Twitch &
Summation
Text Reading: Silverthorn, 5th ed. 412 – 419, 425 – 427; 6th ed. pg. 410 – 420

       In this exercise, we will investigate the physiology of contraction in the gastrocnemius
muscle of a frog. The Biopac system will produce the electrical stimulus to bring about muscle
contraction and indirectly measure the force the muscle is able to generate under different
conditions.
        There are several similarities between the excitability of neural tissue and the excitability
of muscle tissue. Like a single neuron, a single muscle fiber will not respond to any stimulus
impulse that is below threshold. Any single stimulus impulse above threshold will produce a
contraction, or single twitch (see Fig. 1),
of the same strength. There are no
gradations in the strength of the muscle
response for a single twitch. Muscles
outside the laboratory, however, do not
use single twitches to produce motion.
        A muscle twitch is usually
divided into three phases: 1) the latent
period; 2) the contraction period; 3) the
relaxation period (see Figure 4). The
latent period is the time from when the
stimulus is delivered to the first
indications of contraction in the muscle.
The contraction period, or contraction
time, is the time it takes the muscle to
reach its peak contraction after the latent
period. The relaxation period is the time
the muscle takes to return to resting
tension after reaching its peak
contraction.
        Muscles rely on two physiological Figure 1. A Single Twitch: An action potential
principles to bring about productive          on the muscle fiber is followed by contraction
motion: recruitment and summation.
Recruitment is increasing the number of
motor units responding to a single stimulus, which results in the increase in tension in whole
muscle. Summation is the increase in tension that results when a muscle fiber is unable to relax
between twitches. Individual twitches overlap and produce a continuous, smooth contraction of
increasing strength.
       Recruitment requires increasing stimulus amplitude. Below threshold stimulus, there is
no response from the muscle. As stimulus amplitude increases, only the muscle fibers with the

March 29, 2013                                                                       page 65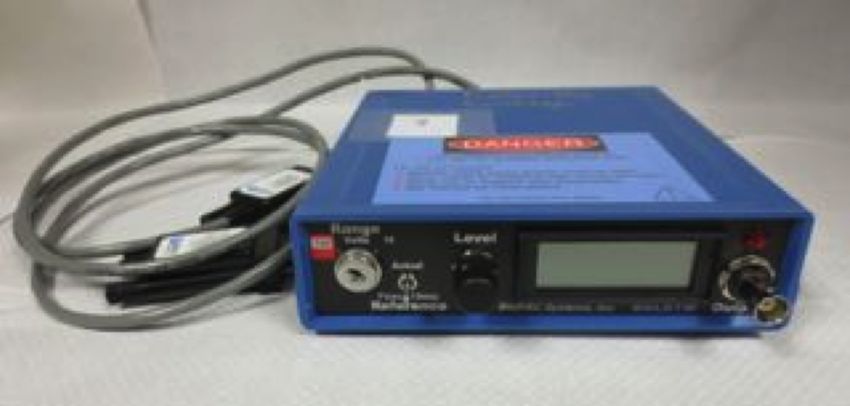
lowest threshold initially respond and contract. As the stimulus amplitude continues to increase,
an increasing number of motor units will be recruited so that the strength of the contraction, or
tension, increases as well. Once all motor units in a muscle have been recruited, an increase in
the stimulus amplitude will not result in any increase in tension. The contraction of a whole
muscle can produce strong, weak or intermediate contractions depending upon how many motor
units are stimulated.
                                                                 Summation requires increasing
                                                         stimulus frequency. At low frequency,
                                                         the muscle fiber will relax before the
                                                         next stimulus impulse occurs. As the
                                                         stimulus frequency increases and the
                                                         time between the stimuli decreases, the
                                                         muscle fiber cannot fully relax before
                                                         the next stimulus occurs (see Fig. 2).
                                                         This loss of relaxation between stimuli
                                                         is called tetanus. We say a muscle is in
                                                         incomplete tetanus if the muscle fiber is
                                                         able to partially relax between stimulus
                                                         impulses (see Fig. 3). A muscle fiber is
   Figure 2. A single twitch (left) and two summated
                        twitches
in complete tetanus if there is no
relaxation at all between stimulus
impulses.

         We can explain the
phenomena of summation and
tetanus by examining the
molecular events that bring about
muscle contraction. Remember
that tension is generated in a
muscle fiber when Ca+2 is released
from the sarcoplasmic reticulum
(SR), triggering formation of
actin-myosin cross-bridges. In
order for relaxation to occur, Ca+2
must be pumped back into the SR. Figure 3. Summation leading to incomplete tetanus, or
Summation occurs because each          unfused tetanus
subsequent stimulus releases
additional Ca+2 from the SR, which in turn increases the number of actin-myosin cross-bridges
that form. As cytoplasmic Ca+2 increases, tension will increase until all possible actin-myosin
cross-bridges have formed. At this point, the muscle fiber will reach maximal tension. This is
illustrated in Figure 3. The black arrows along the X-axis indicate the occurrence of each
stimulus, or action potential. With each stimulus, tension increases as Ca+2 accumulates in the
muscle fiber until maximal tension is achieved.

March 29, 2013                                                                    page 66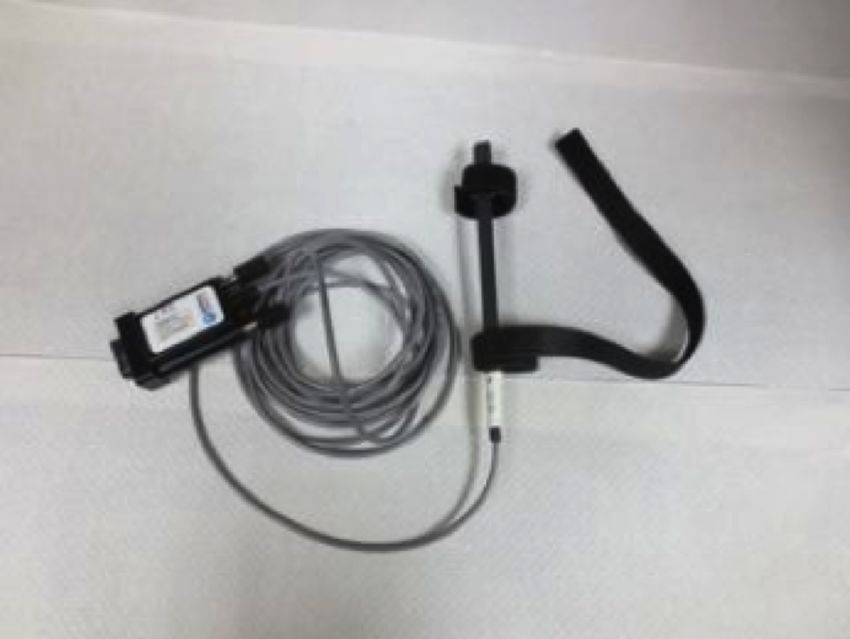
Today’s Objectives
1. Analyze the phases of a single muscle twitch.
2. Investigate the effect of stimulus strength on whole muscle response.
3. Investigate the effect of stimulus frequency on whole muscle response.
4. Correlate the molecular events within a muscle cell with your observations.
Setup
I. Equipment
The equipment for today’s experiment is listed below. Instructions for set up will follow.
Do not turn on any equipment until you have finished reading the entire set up instructions.
1. Computer
2. BIOPAC MP35 Acquisition unit
(big blue box). This will be
referred to as "the MP35 unit".
3. Finger Twitch Transducer
(SS61L). This will be referred to
as "the transducer" (see Figure 4).
Figure 4. Finger Twitch Transducer (SS61L)
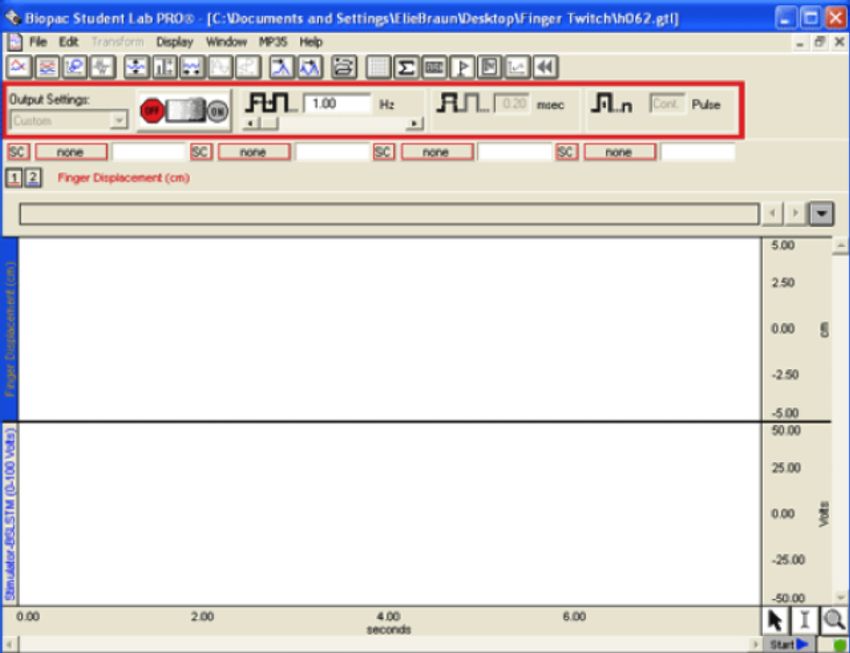
4. BSLSTM Stimulator
(small blue box).
This will be referred
to as "the stimulator"
(see Figure 5). The
stimulator has two
connector cables.
One cable is labeled
BSLSTMB reference
output and the other
cable is labeled
BSLSTMB trigger. Figure 5. BSLSTM Stimulator
March 29, 2013 page 67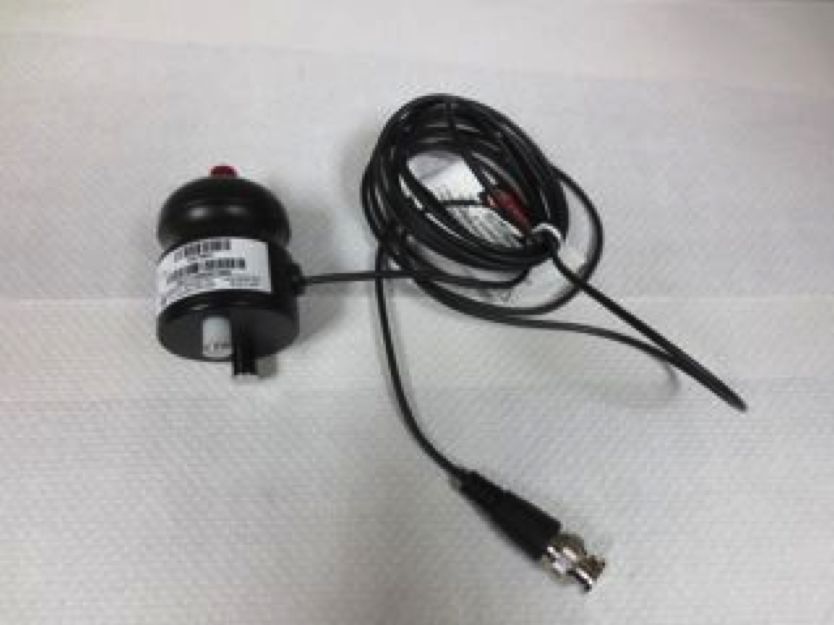
5.   Human-safe Stimulating Electrode
         (HSTM01). This will be referred to as
         "the electrode" (see Figure 6).

    You should be able to explain the purpose of
        each of these pieces of equipment.

                                                         Figure 6. Stimulating Electrode (HSTM01)

II. Equipment Set Up:
1. Turn the computer on.
2. Plug the finger twitch transducer into Channel 1 of the big blue box.
3. Set up the stimulator. NOTE: DO NOT PLACE THE STIMULATOR ON TOP OF THE
   MP35 UNIT. Figures 7 & 8 are to reference cable placement only.
    a. Plug the BSLSTM Reference Output into Channel 2 (see Fig. 7)
    b. Plug the BSLSTM Trigger into Analog Out port on the back of the MP35 unit (see Fig.
       8)
    c. Plug the electrode into the Stimulus Output port on the front of the simulator by
       positioning the small metal knob on the front of the box in the metal groove of the
       connector and rotating the metal connector, not the rubber part, clockwise.
    d. Settings on the front of the stimulator:
    •    Turn the Level knob counterclockwise until it stops (this is the 0 volts setting)
    •    Check that Range is set at 100V (the key hole should be pointing to the left). If it is not,
         use the key attached to the cable and set the Range.
    •    Check that the Reference switch to set to Fixed (the toggle switch should be pointing in
         the down position).

March 29, 2013                                                                       page 68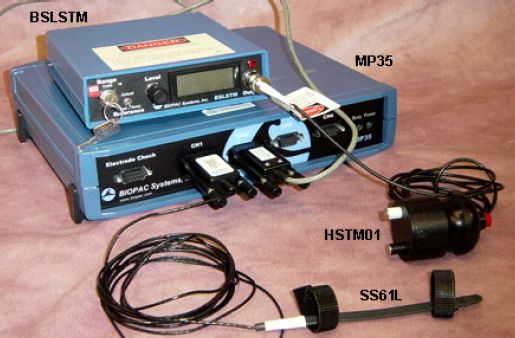
Figure 7. Front of the stimulator and MP35 unit

                         Figure 8. Back of the stimulator and MP35 unit

4.   After the computer has finished booting up, turn on both the MP35 unit and the stimulator.
5.   When the busy light on the MP35 unit goes off, launch the appropriate Biopac application.
        •   Mac users will launch the BSL PRO 3.7 application, NOT the BSL Student Lessons
            like last week. The icon for launching can be found on the right side of the dock.
        •   PC users will launch the usual BSL 3.7.7 application by double-clicking on the BSL
            3.7.7 icon on the desktop (NOT the BSL PRO icon).
6.   The file you need to open is called "h06a.gtl".
        •   For Mac users, you may need to transfer the h06a.gtl file from the thumb drive
            provided by the instructor. Once it is downloaded to the desktop, double click the
            h06.gtl icon.
        •   For PC users, click the "PRO" tab located to the right of the "BSL Lessons" tab and
            below "Choose a file to open:". Double click on "H06 Finger Twitch (SS61L).gtl".
            The stimulator window will open (see Fig. 9).

March 29, 2013                                                                    page 69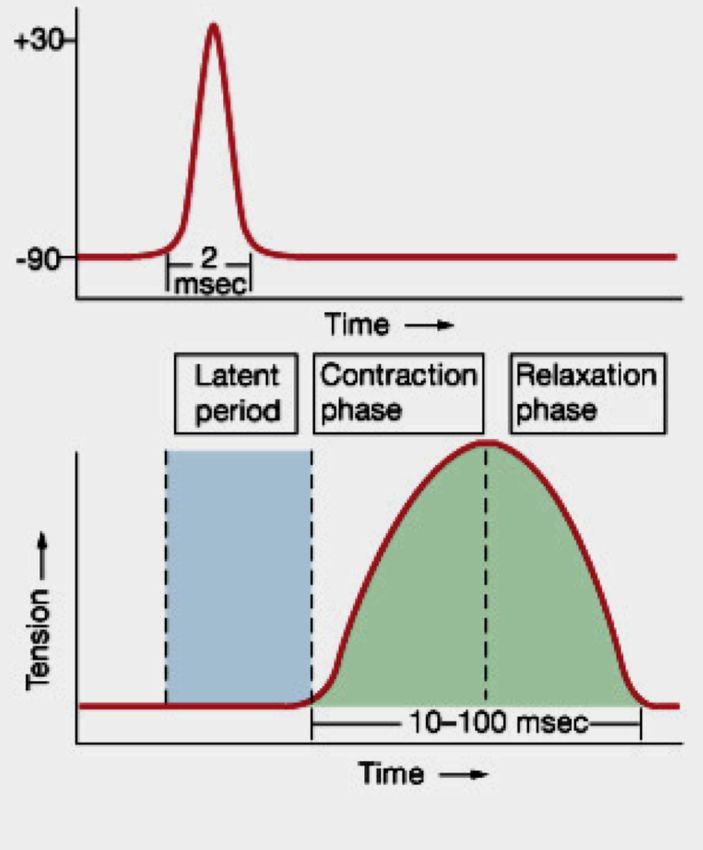
Figure 9. Stimulator Window (ho6a.gtl)

III. Getting the subject ready:
    •   Attach the transducer to the palmer surface of the nondominant hand (see Fig. 10) with
        the "UP" label facing out. Make sure the "UP" label is positioned so that the transducer
        bends towards the label. Secure the transducer to the finger by positioning the Velcro
        between the middle and distal phalanges.
    •   The transducer can be placed on either the pointer or middle finger. The finger chosen
        will determine where the electrode should be positioned on the forearm.

                         Figure 10. Palmar placement of the transducer

March 29, 2013                                                                    page 70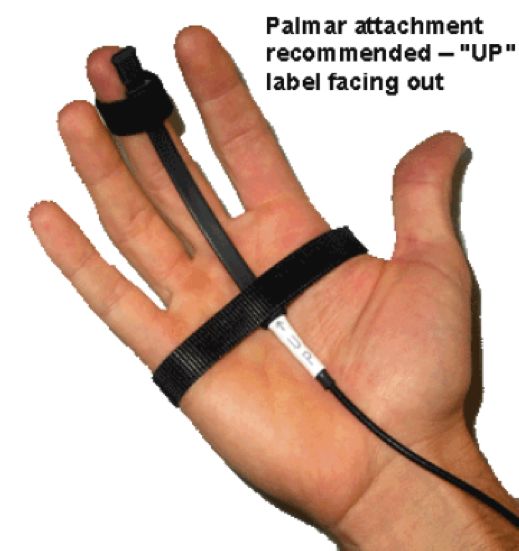
IV. Calibration of Transducer (SS61L)
1.   From the pull down menus at the top of the computer screen, select MP35 > Setup
     Channels, then click the Channel 1 wrench icon and choose Scaling at the bottom of the
     window. A calibration window will open (see Fig. 11).
2.   The Input Value is the electrical signal produced by the twitch transducer. The Scale Value
     is in units of centimeters (cm). For the zero point in your calibration, the Scale Value is set
     to 0. Lay the subject's hand palm up with the entire forearm resting on the table and the hand
     relaxed. The transducer should be relatively straight, although the relaxed palm may cause it
     to curve a bit. Click Cal1.
3.   Set the Cal2 Scale value to 5 cm by highlighting 8.89 in the second Scale Value text box
     and typing in "5". Have the subject bend his or her finger until the twitch transducer is at a
     90º angle (perpendicular to the palm) and click Cal2.
     NOTE: if you get an error message, check that the transducer is correctly attached to the
     hand. The bar must bend towards the "UP" label. The input value should be a positive
     number.
4.   Click OK to close the calibration window and the Input Channel Parameters window. Close
     the Set Up Channels window. NOTE: the transducer must be recalibrated each time you
     open a new h06a.gtl file.

             Figure 11. Scaling Window for calibrating the SS61L twitch transducer

V. Electrode (HSTM01) Preparation
1.   Controlling the stimulator:
     The ON/OFF switch for the stimulator is found at the top of computer screen in the red box
     labeled "Output Settings" (see Fig. 9). This red box is the Stimulator Window. To the right
     of the ON/OFF switch is the frequency setting. Confirm that frequency of the stimulator is
     set to 1.00 Hz. Recording of the stimulus and response is controlled by the START button
     located at the bottom right corner of the screen. The stimulator and the recorder are
     independent of each other.
     The voltage level is controlled by turning the knob on the front of the stimulator. Adjust this
     setting to 15 V to begin with. When you turn on the stimulator by clicking the ON switch, a
     stimulus will be produced at a frequency of 1 stimulus per second and a red light will flash

March 29, 2013                                                                       page 71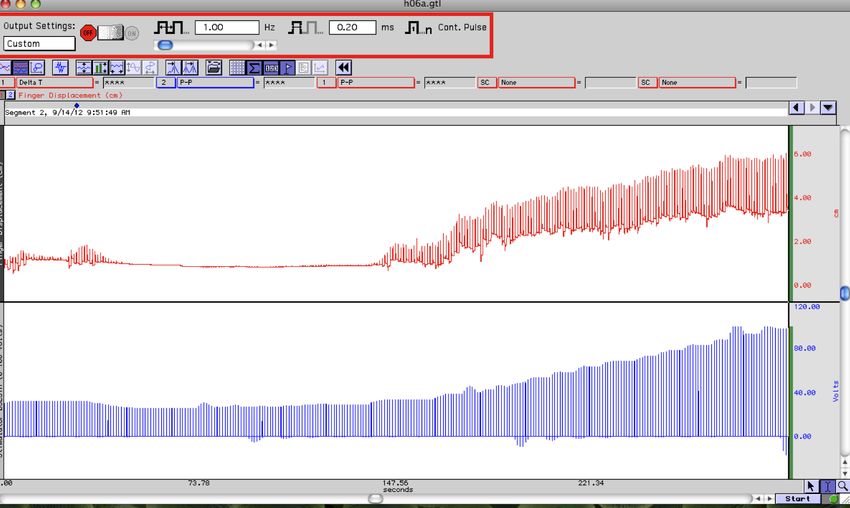
on the front of the stimulator in time with the stimulus pulse. The stimulus will be delivered
     to the electrode when the subject depresses the red button.
2.   The subject will hold the electrode in their dominant hand and control the stimulus by
     depressing the red button. With the subject's forearm resting on the table and palm up, smear
     some electrode gel in the center of the forearm to lubricate the electrodes. A glob of gel is
     better than a smooth thin layer. Gently press the electrodes against the skin with the two
     stimulating electrodes positioned lengthwise, parallel with the tendons of the wrist and
     forearm.
3.   Click the ON switch and slowly turn up the voltage of the stimulator. The subject must
     depress and hold down the red button on the electrode to deliver the stimulus to the forearm.
     The subject can stop the stimulus at any time by releasing the red button. When the
     subject can feel the stimulus, slowly move the electrode around the forearm, maintaining the
     two points of the electrode in a lengthwise orientation, until the finger wearing the
     transducer begins to twitch. A typical stimulus needed to produce a twitch is between 25 V
     and 30 V. Adjust the stimulus level to a voltage setting that produces a twitch without being
     uncomfortable for the subject. Try not to move the electrode, however, in order to maintain
     the correct position for the finger twitch.

                           Recording The Single Twitch
1.   Remember that the stimulator and the recorder are controlled independently of each other.
     The recorder is turned on when you click the word START, found at the bottom right corner
     of the screen. The stimulus will be recorded in the bottom half of the window (blue trace)
     and the finger twitch response will be recorded in the upper half of the window (red trace).
     The finger twitch response is measured in centimeters of displacement or bending of the
     finger, which indirectly reflects the force of the twitch. The actual tension generated in the
     muscle, usually measured in gram or kilogram units, cannot be measured with this type of
     transducer.
2.   When you are ready, click START and record for about 10 seconds so that you have a good
     sampling to analyze. Click the word STOP to stop the recording. Don't forget to have your
     subject stop the stimulation once you have stopped recording!
3.   Your data can be analyzed immediately after recording when using the Biopac PRO
     software. Select three individual twitches to analyze, using the zoom tool. Choose Autoscale
     Waveforms in the Display menu to fit the peaks in the recording window.
4.   At the top of the screen and below the red Stimulator Window, change the first channel box
     from SC to either Ch. 1. To the right of the channel box, set the measurement function box
     to Delta T to measure time on the X-axis.
5.   Use the I-beam tool to measure the time of each segment of the twitch (see Fig. 1 to review
     the twitch segments). Record your data in Table 1. Measure each period for three separate
     twitches and average the values.

March 29, 2013                                                                      page 72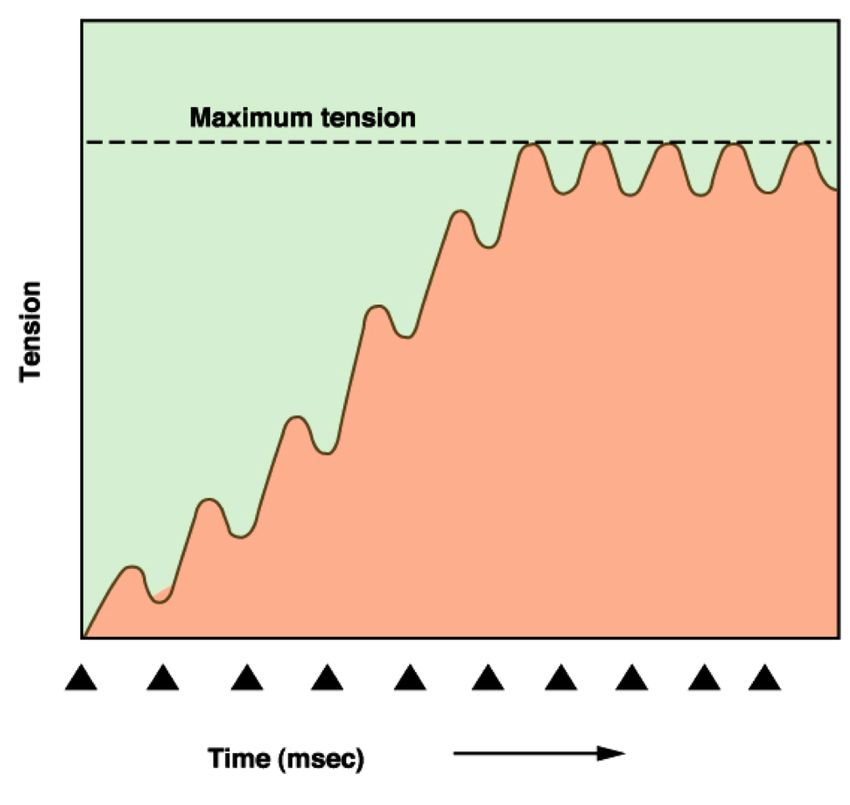
•   The latent period, which is the time between the stimulus, recorded in the bottom
        window, and the beginning of the twitch response, recorded in the upper window.
    •   The contraction time, which is the time between the start of the twitch and the peak.
    •   The relaxation time, which is the time between the peak of the twitch and complete
        relaxation. It will be difficult to tell where to end the relaxation period. Just eyeball it
        the best you can.
        Note that the units of time may change from msec to sec when the values increase
        above 100 msec.

                             Table 1. Data for Muscle Twitch
                                     #1                 #2                 #3             Average
Latent Period
Contraction Time
Relaxation Time
Time of Total Contraction

Questions:

1. What were the two pieces of equipment used by the subject and what did they
   do?

2. How does direct electrical stimulation produce contractions of the muscle?

3. How closely did the Delta T values (time periods) you measured compare to
   the time values of a twitch as described in the textbook?

4. Describe the molecular events in the muscle fiber that produce a twitch in
   response to the stimulus voltage. Specifically, what molecular events occur
   during the latent period? Which events occur in the contraction period? Which
   events occur in the relaxation period? Be sure to include the role of calcium in
   your description.

March 29, 2013                                                                         page 73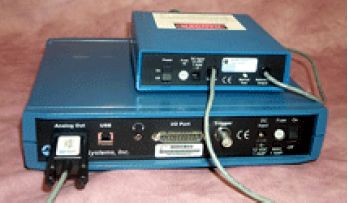
Stimulus Strength and Recruitment
In this section, we will demonstrate the response to increasing stimulus intensity (progressively
higher voltage). Remember that motor units within a whole muscle have variable thresholds. The
slow twitch motor units have the lowest threshold and will be the first to respond as the voltage
of the stimulus is increased. Intermediate motor units are recruited next. The fast twitch motor
units have the highest thresholds and are the last to be recruited. As more motor units are
recruited with increased stimulus voltage, the tension produced by each twitch increases.
1.   Click the ON button in the Stimulator Window if the stimulator is not already on. Adjust the
     voltage setting and check that the position of the electrode is generating a finger response
     before you begin to record.
2.   Determine Threshold:
     Restore your recording window using Autoscale Horizontal and Autoscale Waveforms.
     Click the START button to begin recording (bottom right corner). Watch the subject's finger
     for the twitch. Slowly reduce the voltage until the twitch is no longer observed, then increase
     the voltage one volt at a time until the twitch occurs again. Record the observed voltage that
     corresponds to the reoccurrence of the twitch in Table 2. The is the observed Threshold
     Stimulus.

                                   Table 2. Recruitment Data
                                       Threshold                            Maximum
                               Stimulus         Response        Voltage (volts)    Response (cm)
                                (volts)           (cm)
     Observed Threshold
     Measured values:
     Twitch #1
     Twitch #2
     Twitch #3
     Average

3.   Demonstrate Recruitment:
        •   Increase the stimulus in approximately 5 V increments, allowing five or six twitches
            to occur before increasing the stimulus voltage again.
        •   Observe response of the subject's finger as the voltage increases. The voltage can be
            increased until the finger does not appear to bend any further (full recruitment) or as

March 29, 2013                                                                      page 74
high as the subject chooses, up to a maximum voltage of 100V. Most people can
tolerate anywhere from 65 V to 90 V. Remember, the subject can stop the stimulus at
any time by releasing the red button on the electrode.
• Once the finger appears to be fully recruited or the subject chooses to stop, click
STOP to end the recording and the OFF button to turn off the stimulator. Reduce the
stimulus voltage to 20 V.
• Your data should look something like Figure 12.
Figure 12. Recruitment data
ANALYSIS
1. Below the red Stimulator Window, set the channel boxes and function boxes for analysis:
• The first measurement function box has already been set to Delta T.
• Change the second channel box from SC to Channel 2 (blue) and set the
measurement function box P-P (point to point measures the difference between the
lowest point and the highest point in a highlighted region). This measures the
stimulus in volts.
• Change the third channel box to Channel 1 (red) and the measurement function box
P-P. This measures the magnitude of the twitch response in centimeters.
2. Measure Threshold:
• Expand your display by choosing first Autoscale Horizontal, then Autoscale
Waveforms from the Display menu.
March 29, 2013 page 75• Use the zoom tool to select the area where threshold appears to occur. Choose
Autoscale Waveforms to adjust your image, if necessary. Use the I-beam to
highlight the stimulus that corresponds with the smallest measureable response.
• Record in Table 2 the values that appear in the measurement function boxes for the
threshold voltage (Ch. 2 – blue) and the threshold response (Ch. 1 – red) for first
three adjacent twitches that occur at threshold. Two significant digits are sufficient.
3. Recruitment:
Once again expand your display by choosing first Autoscale Horizontal, then Autoscale
Waveforms. Use the zoom tool to select an area where maximum recruitment appears to
occur. Measure and record the stimulus and response for three maximal twitches.
NOTE: It may be difficult to quantitate (measure) the increase in force produced during
recruitment, but you will see a qualitative increase in strength of the twitches as the stimulus
is increased when you look at the recording as a whole. Expand your trace using Autoscale
Horizontal, Autoscale Waveforms and print a copy of your data window.
4. If printing is not possible from your computer, take a screen shot of the stimulator window
and transfer a copy of it to a USB thumb drive. Your instructor can print from the
instructor's computer.
• For Macs, hold down shift-command-4, then click and drag the crosshairs that appear to
draw a box around the part of the screen you would like to include in your screen shot.
The screen shot will be automatically saved to the desktop, but will be erased when the
computer is shut down.
• For PCs, use the screenshot key at the top of the number pad. This puts the screenshot
in the clip board. Paste the image into the Paint application found under Programs, then
name and save the image to the desktop.
Questions:
5. Explain why the muscle doesn’t respond to low stimulus voltages.
6. How does the twitch response vary with increasing voltage? Include the
concepts of both threshold and recruitment in your discussion.
March 29, 2013 page 76Stimulus Frequency and Summation
In this section, we will demonstrate how a muscle responds to increases in stimulus
frequency (the number of stimuli per second). The stimulus voltage will remain constant
throughout this experiment. As frequency increases, summation and tetanus will begin to occur.
Summation can be measured as the increase in the muscle response along the Y-axis. Tetanus
will be observed as the loss of relaxation between twitches.
1. Open a new window using the h06a.gtl template file. Calibrate the finger twitch transducer
as you did previously.
2. Set the voltage on the stimulator to the lowest voltage needed to produce a small finger
twitch, about 20 V to 25 V. Frequency should be set to 1 Hz (1 stimulus per second) in the
Stimulator Window.
3. Click the ON button in the Stimulator Window. Have the subject depress the red button on
the electrode and adjust the electrode so that a twitch is produced. Click Start to begin
recording.
4. Let the recorder run for about 10 seconds before beginning to increase the frequency.
Increase the stimulus frequency in 1 Hz increments by clicking on the right pointing arrow
underneath the frequency setting window. Typing a number into the frequency setting
window WILL NOT change the frequency. Observe how the subject's finger responds to the
increasing frequency. Continue to increase the frequency at approximately 5 to 10 second
intervals.
5. When the recording plateaus, stop stimulating the finger by releasing the red button and
allow the finger to relax before you stop recording. The subject should take care not to move
their hand. Maximum summation usually occurs somewhere around 11 Hz.
6. Click Autoscale Horizontal to display the entire recording in the window. Print a copy of
your data. It should resemble Figure 13.
• On your printout, use an arrow to indicate where summation begins.
• Indicate where unfused tetanus becomes fused. Remember, the terms fused and unfused
are interchangeable with the terms complete and incomplete.
March 29, 2013 page 77Figure 13. Summation Data
So What Happened?
Remember what causes contraction in a muscle fiber. An action potential causes calcium
ions to be released from the sarcoplasmic reticulum into the sarcoplasm. This allows myosin to
form cross bridges with actin filaments of the sarcomere and generate the movement associated
with the contraction. The more cross bridges formed, the stronger the contraction.
Relaxation is brought about by the removal of the Ca++ from the sarcoplasm. If a second
stimulus is delivered to a fiber before all of the Ca++ are removed (the fiber has not relaxed),
more Ca++ are released and the fiber starts a second contraction without completely relaxing from
the first.
If there is no relaxation at all between stimuli, but rather a smooth sustained contraction,
it is called “Fused Tetanus”, “Complete Tetanus” or just plain “Tetanus.” If there is some
relaxation between the stimuli, the contraction is referred to as “Unfused Tetanus" or
Imcomplete Tetanus". If a muscle completely relaxes in between successive stimuli, there is no
tetanus at all.
As a muscle responds to successive stimuli, the contractions increase in strength. This
property is called “Summation of Contractions,” or simply "summation." Summation makes
sense when you remember that the increased frequency of stimuli causes increased amounts of
Ca2+ to be deposited in the sarcomeres. The increased Ca2+ means there will be increased
numbers of myosin-actin cross bridges, and thus, an increase in the strength of contraction.
Sample data can be seen in Figure 6. The data has been squished into one window so that
the results for each increase in frequency can be compared side by side. Note the difference in
the amplitude of the single twitches on the left versus the amplitude of the contractions showing
March 29, 2013 page 78fused tetanus on the right. The I-bar added to the figure indicates summation, or the increase in force that results from fused tetanus. Questions: 7. What do the terms unfused and fused tetanus refer to? What do the terms incomplete and complete tetanus refer to? 8. Define the terms tetanus and summation. 9. Explain the cellular mechanism that produces tetanus and summation. March 29, 2013 page 79
You can also read