Climate and Water Resources Summary for the Wellington Region - Winter 2018 summary Spring 2018 outlook - Greater Wellington Regional Council
←
→
Page content transcription
If your browser does not render page correctly, please read the page content below
Climate and Water Resources Summary
       for the Wellington Region

            Winter 2018 summary
            Spring 2018 outlook

Release date: 13 September 2018

Alex Pezza, Mike Thompson, Mike Harkness and
Jon Marks

Environmental Science Department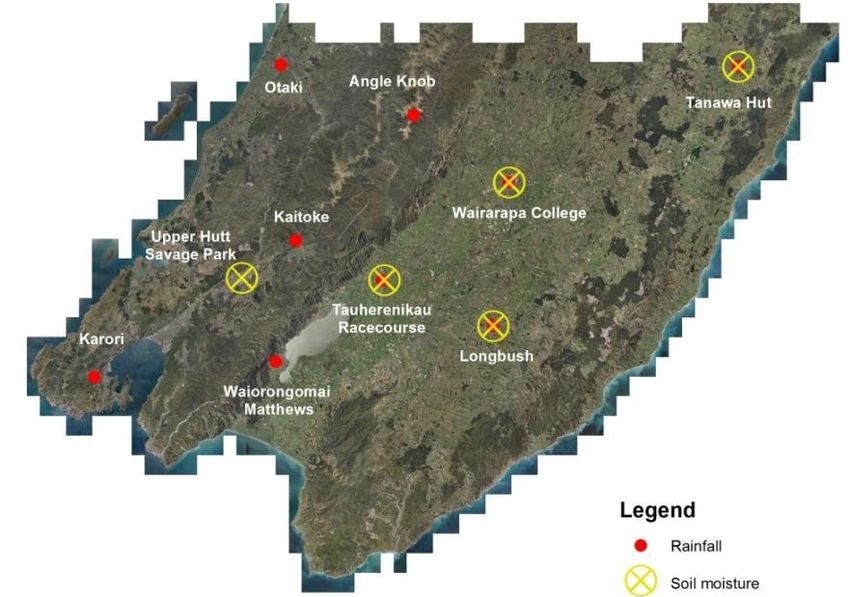
A very strong subtropical low brings a vigorous easterly circulation,
  with heavy rain over the eastern coast in June. Source: MetService
  Twitter

DISCLAIMER
This report has been prepared by Environmental Science staff of Greater Wellington Regional Council (GWRC) and as
such does not constitute Council policy.
In preparing this report, the authors have used the best currently available data and have exercised all reasonable skill
and care in presenting and interpreting these data. Nevertheless, GWRC does not accept any liability, whether direct,
indirect, or consequential, arising out of the provision of the data and associated information within this report.
Furthermore, as GWRC endeavours to continuously improve data quality, amendments to data included in, or used in
the preparation of, this report may occur without notice at any time.
GWRC requests that if excerpts or inferences are drawn from this report for further use, due care should be taken to
ensure the appropriate context is preserved and is accurately reflected and referenced in subsequent written or verbal
communications. Any use of the data and information enclosed in this report, for example, by inclusion in a subsequent
report or media release, should be accompanied by an acknowledgement of the source.
Contents

Overview
Winter 2018
Like autumn, winter 2018 was marked by very unsettled weather patterns, starting very
wet and cold and then moving towards a more normal rainfall pattern in the second half
of the period. July was particularly warm, with Wellington hitting the 3rd highest mean
July temperature on record, since 1927. Overall, Wellington had the third-equal
warmest, and Martinborough had the 4th warmest winter on record.

Climate drivers
The El Niño - Southern Oscillation (ENSO) phenomenon has been in a neutral phase,
therefore, this driver would have contributed towards normal conditions.

The Southern Annular Mode (SAM) has been predominantly negative, contributing
towards a wet and unsettled winter pattern overall.

A large anomalous area of low pressure south of Australia also contributed to a
predominantly north-westerly regime over New Zealand, alternating with significant
easterly events such as the impressive subtropical low in June (featured above), with
abundant rainfall in the Wairarapa.

Climate outlook for spring 2018
The ENSO phenomenon is now shifting towards an El Niño phase. However, the
predicted event is so far of only small magnitude, and its manifestation is looking
atypical, in that not all indicators are consistently “El Niño-like”. This is known as the
“Modoki” variation of El Niño (or pseudo-El Niño), in which the oceanic warming
affects the central Equatorial Pacific, but it doesn’t affect the western coast of South
America. The name was coined by Japanese researchers after the classical Japanese
word “Modoki”, which means “a similar but different thing”.

As a result, we expect only a small ENSO influence during spring, and even then not
necessarily in the traditional sense. Based on a range of different climate models, we
expect a spring with near to above normal temperatures and about average rainfall,
without any particularly strong odds either way (i.e. towards strong positive or negative
anomalies). The models still show an enhanced probability of significant easterly
rainfall events (such as the one we had in June), even though this is not normally
expected during the development phase of El Niños.

Live regional climate maps (updated daily): Real-time climate maps for regional
rainfall and soil moisture (updated daily) are provided online at GWRC’s environmental
data webpage (graphs.gw.govt.nz/#dailyClimateMaps)

Interactive climate change maps: Easy to plot climate change mapping, available
for every season, for mid and late century. A total of 21 climate variables can be plotted,
for every greenhouse gas emission scenarios modelled by the IPCC. Dynamical
downscaling provided by NIWA: https://mapping1.gw.govt.nz/gw/ClimateChange/
Contents

Contents
Overview                                                                     i
Winter 2018                                                                  i
Climate drivers                                                              i
Climate outlook for spring 2018                                              i

1.      Climate drivers                                                     1
1.1     El Niño – Southern Oscillation (ENSO)                               1
1.2     Sea Surface Temperature anomalies                                   1
1.3     Southern Annular Mode (SAM)                                         2

2.      What is the data showing?                                            4
2.1     Regional temperature                                                 4
2.2     Regional wind                                                        5
2.3     Regional soil moisture                                               6
2.4     Regional rainfall                                                    7
2.5     Climate change and variability indicators                            8
2.6     Observed rainfall and soil moisture conditions for selected sites   10
2.6.1   Rainfall accumulation for hydrological year (1 June to 31 May)      10
2.6.2   Soil moisture content (since 1 June 2018)                           13

3.      Outlook for spring 2018                                             15

Acknowledgments                                                             16

Appendix                                                                    17
Climate Drivers

1.    Climate drivers
1.1   El Niño – Southern Oscillation (ENSO)
      The ensemble projections of the Australian climate model below show that the
      ENSO phenomenon is now predicted to reach El Niño threshold during our spring.

      However, the intensity of the event being predicted is only weak, and not all climate
      indicators (e.g. oceanic winds) are responding as would have been expected during
      the onset of a classical El Niño. As such, we are not expecting pronounced impacts
      over our region during spring, pending a revision for late spring and the summer
      ahead, depending on how the phenomenon might evolve.

      Figure 1.1: Averaged modelled projections (in green) show ENSO is expected to
      progress to the El Niño phase during spring. However, the prediction at this stage is
      only for a weak event. Source: Australian Bureau of Meteorology.

1.2   Sea Surface Temperature anomalies
      The Sea Surface Temperature (SST) anomalies and the total sea ice extent (in white)
      are shown in Figure 1.2 for 3 September 2018. The pattern shows normal or slightly
      cooler than normal waters southwest of New Zealand, and warmer than normal
      waters to the east. This pattern has remained unchanged throughout most of the
      winter.

      In terms of ENSO, the evolution of a potential El Niño is not yet evident, but more
      warming is expected towards the central Pacific. This is typical of what has been
      coined El Niño “Modoki”, which is a variation of the classical ENSO pattern (or
      “pseudo-El Niño”), in which the oceanic warming affects the central Equatorial
      Pacific, but not the western coast of South America. The name was coined by

                                                                               PAGE 1 OF 17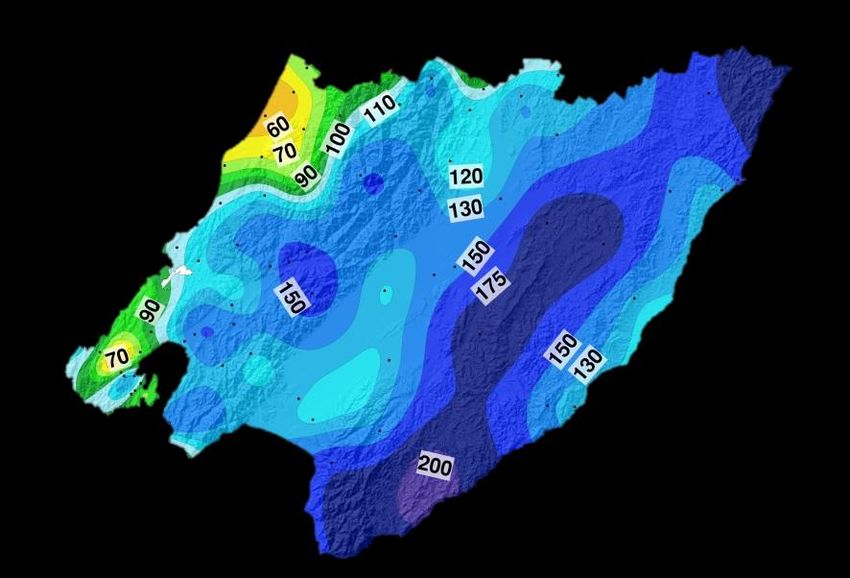
Climate Drivers

      Japanese researchers after the classical Japanese word “Modoki”, which means “a
      similar but different thing”.
      (http://www.jamstec.go.jp/frsgc/research/d1/iod/publications/modoki-ashok.pdf)

      Figure 1.2: Sea surface temperature (SST) anomalies for 3 September 2018. Sea ice
      coverage is shown in white. Waters around New Zealand remain slightly cooler than
      average to the west, and warmer to the east. The Equatorial Pacific is in the neutral phase
      (neutral ENSO) progressing towards a new El Niño. Source: NOAA.

1.3   Southern Annular Mode (SAM)
      The SAM is the natural pressure oscillation between mid-latitudes and the Antarctic
      region. Normally, positive SAM is associated with high pressures around the North
      Island, keeping the weather stable and dry/cloud-free (especially in summer),
      whereas the opposite is expected when the SAM is in the negative phase.

      Figure 1.3 shows a large area of anomalous low pressure south of Australia,
      projecting an area of influence over New Zealand. This pattern, which was
      associated with the negative phase of the SAM, contributed to a more frequent
      north-westerly regime. The influence of these anomalies is evident in the rainfall
      anomalies (section 2.4), showing that overall the western coast had above average
      rainfall.

      The blocking highs to the east of New Zealand, although not very strong, also
      contributed to produce both south-easterly and north-easterly events. Overall, both
      the low and the highs combined have reduced the frequency of southerly winds,
      helping explain the warm temperature anomalies observed over most of the country.

                                                                              PAGE 2 OF 17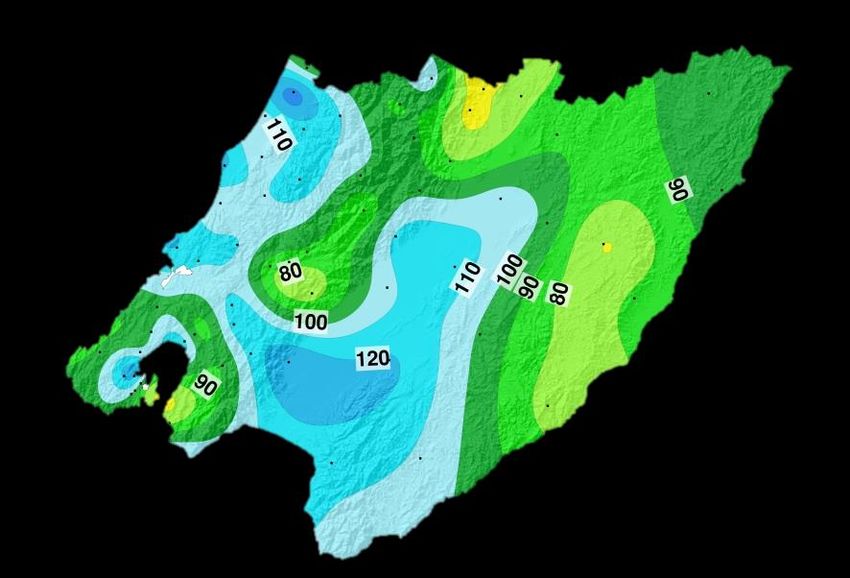
Climate Drivers

     Figure 1.3: Mean sea level pressure anomaly (hPa) for JJA 2018. The ‘H’ indicates the
     areas of blocking high pressure east of New Zealand, and ‘L’ corresponds to an area of
     lower than average pressure south of Australia. This large low pressure area affected
     New Zealand, bringing more westerlies during winter. Source: NCEP Reanalysis.

                                                                            PAGE 3 OF 17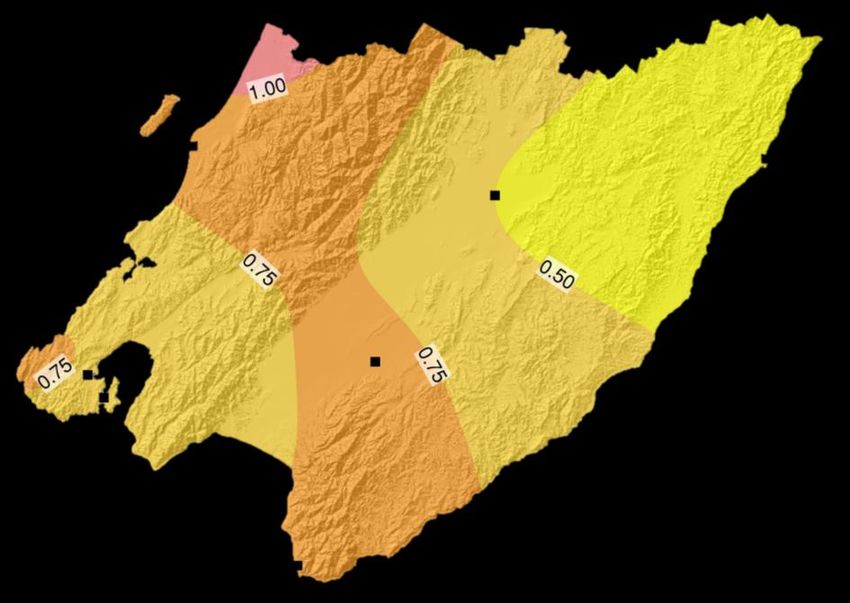
What is the Data Showing?

2.         What is the data showing?
2.1        Regional temperature
           Figure 2.1 shows the minimum and maximum temperature anomalies (against the
           1981-2010 reference period) for the region based on all monitoring sites available
           from GWRC, NIWA, MetService and New Zealand Rural Fire Authority (all
           meteorological stations indicated by dots).

           We can see that warmer than average temperatures prevailed for the most part,
           especially for the western part of the region. Over Masterton, clear nights with
           radiative cooling (heat lost into space under clear skies) kept minimum temperatures
           slightly below average.

                                                                       JJA 2018 - Minimum
                                                                       Temperature Anomalies

       JJA 2018 - Maximum
       Temperature Anomalies

      Figure 2.1: Daily Average Min and Max
      temperature anomalies for JJA 2018.
      All anomalies calculated against the 1981-2010 reference period.
      Source: GWRC, using station data from GWRC, NIWA, MetService and NZ Rural Fire Authority networks.

                                                                                   PAGE 4 OF 17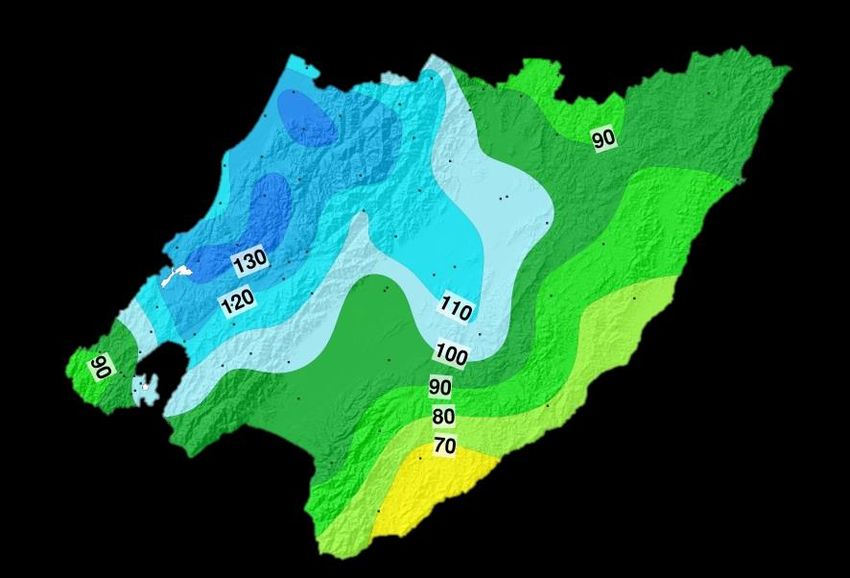
What is the Data Showing?

2.2   Regional wind
      Figure 2.2 shows the mean wind anomalies (against the 1981-2010 reference period)
      based on a smaller network of stations than for temperature. We can see that the
      region had a pattern of lower than normal wind speeds over the winter months, in
      connection to the blocking areas of high pressure to the east of New Zealand shown
      in Figure 1.3.

         JJA 2018
         Windspeed Anomalies

      Figure 2.2: Daily mean wind anomalies (in m/s) for JJA 2018. All anomalies calculated
      against the 1981-2010 reference period. Source: GWRC, using station data from NIWA and
      MetService.

                                                                             PAGE 5 OF 17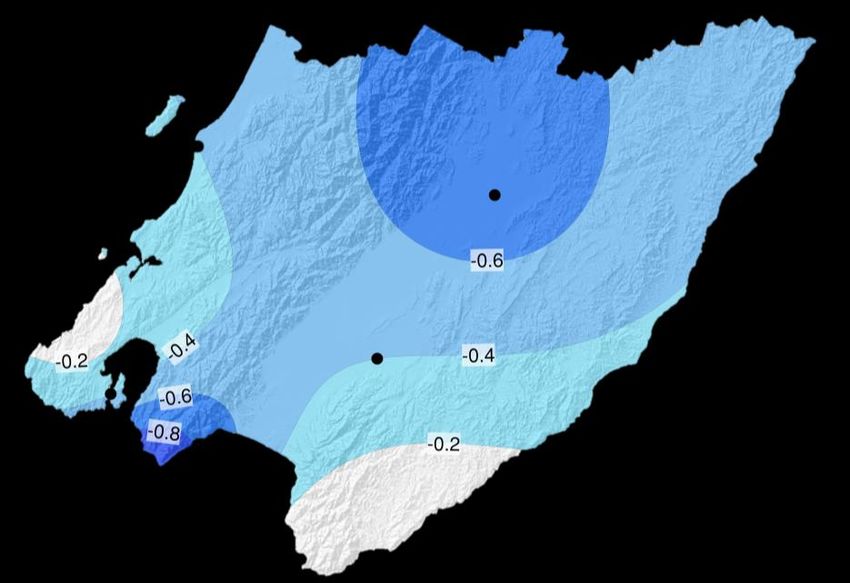
What is the Data Showing?
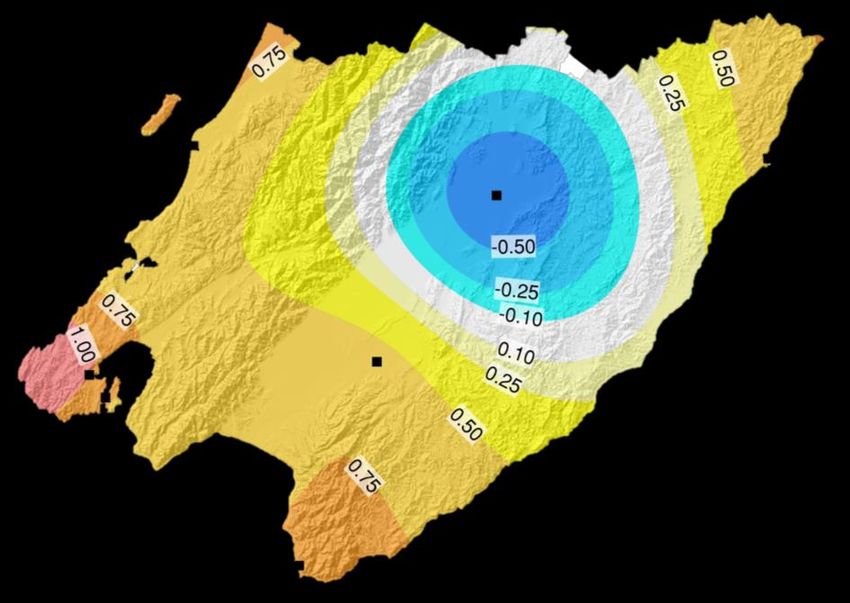
2.3 Regional soil moisture
Figure 2.3 shows the winter 2018 soil moisture anomaly map for the region. Most of
the region experienced around or above normal soil moisture levels – a pattern
consistent with positive rainfall anomalies observed over the last few months.
Live regional climate maps (updated daily): Real-time climate maps for regional
rainfall and soil moisture (updated daily) are provided online at GWRC’s
environmental data webpage (graphs.gw.govt.nz/#dailyClimateMaps)
JJA 2018 – Soil
Moisture Anomalies
Figure 2.3: Winter (JJA 2018) soil moisture anomaly. Moisture levels show normal or
above normal conditions for most of the region. Source: GWRC, using selected Virtual
Climate Station Network (VCSN) data kindly provided by NIWA. Note that this data is
indirectly calculated by modelling and interpolation techniques, and does not
necessarily reflect the results obtained by direct measurements. This map should only
be used for a general indication of the spatial variability.
PAGE 6 OF 17What is the Data Showing?
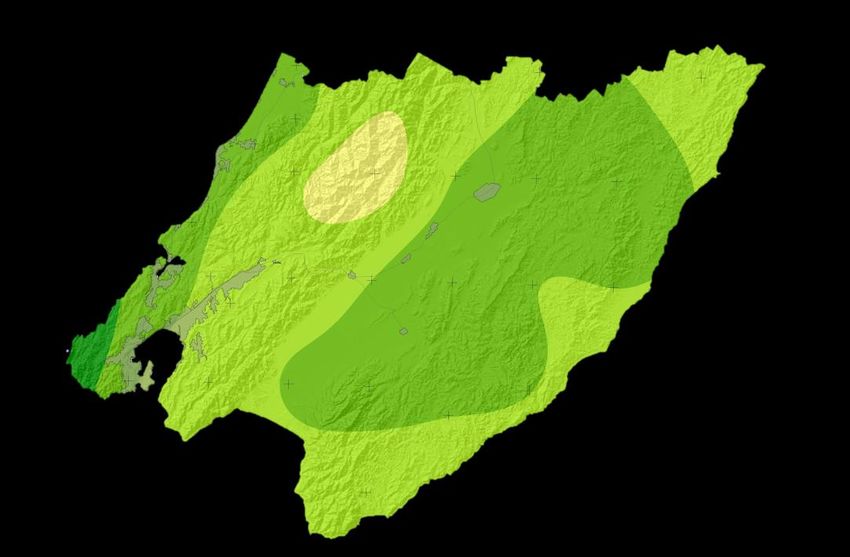
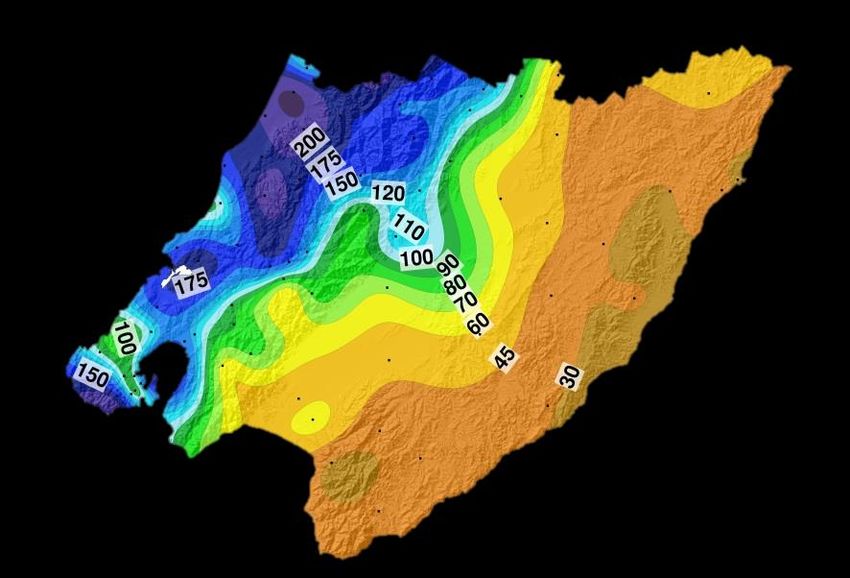
2.4 Regional rainfall
Figure 2.4 shows the regional month by month (and winter) rainfall expressed as a
percentage of the long-term average. We can see that the pattern was extremely
variable, with very wet conditions in the east for June, and very wet in the west
during July. For the seasonal total, the influence of the westerly pattern led to
abundant positive anomalies on the west coast, as a result of the negative Southern
Annular Mode discussed in 1.3.
June
July
August
WINTER
JJA
Figure 2.4: Rainfall for June, July, August and JJA 2018 as a percentage of the long-
term average. Rainfall was extremely variable, very wet in the east in June, very wet in
the west in July, and near normal in August. Source: GWRC and NIWA.
PAGE 7 OF 17What is the Data Showing?
2.5 Climate change and variability indicators
The graphs below (Figure 2.5) show summaries of seasonal climate change and
variability for Wellington and the Wairarapa using reference climate stations, chosen
based on length of data record and availability.
The key climate variables shown are: mean temperature, total sunshine hours, mean
wind, total rainfall and total number of rain days (above 0.1 mm). Temperature
measurements go back to the 1910s, allowing for a meaningful analysis of climate
change trends. Most other variables also have long periods of measurement greater
than 50 years, except sunshine hours and wind for the Wairarapa; these are only
available for less than two decades, which is a very short period climatologically and
doesn’t allow for an analysis of trends.
The red and blue bars show the extreme years of the entire measurement period. Red
indicates seasons that were warmer, drier, sunnier and less windy than average (a
sense of extreme hot/dry), and blue indicates seasons that were colder, wetter,
cloudier and windier than average (a sense of extreme cold/wet). The reference
climatological average (1981-2010) is shown by a horizontal bar where available.
All maps are grouped together for convenience of style, using the same scale
between Wellington and Wairarapa whenever possible (except for wind which is
much lower over the Wairarapa). The last bar in all graphs is the season covered in
this report; unless there are data missing (in which case a blank space is shown).
An analysis of linear trends associated with climate change is plotted onto the graph
only when the trends are statistically significant at 99% level according to the t-
Student test.
The climate change and variability summary for winter is:
Statistically significant trends are seen only for temperature, but they are fairly
strong (1.3oC per century in Kelburn and 1.2oC per century in Masterton over
the period 1910-2018);
Winter 2018 temperature was well above average for both Wellington and the
Wairarapa;
Sunshine hours were very low for Wellington, but near normal for the
Wairarapa;
Wind speed was slightly below average;
Rainfall and rain days were above average in Wellington.
PAGE 8 OF 17What is the Data Showing?
Figure 2.5: Climate change and variability graphs for winter in Wellington and the Wairarapa.
The thick horizontal line shows the 1981-2010 average (when available), and the dashed line shows
the linear trend. Trends are plotted only when statistically significant at 99% confidence level. For all
graphs, the bright red and blue bars show the extreme min and max values for each time series (red for
PAGE 9 OF 17What is the Data Showing?
warm, dry, sunny and calm and blue for cool, wet, cloudy and windy). The key variables shown are:
mean temperature, total number of sunshine hours, mean wind speed, total rainfall and total number of
rain days (>0.1mm). Missing bars means that no reliable mean seasonal data was available for that
particular year. The last bar of each graph shows the last available data for the currently analysed
season, unless there are missing data.
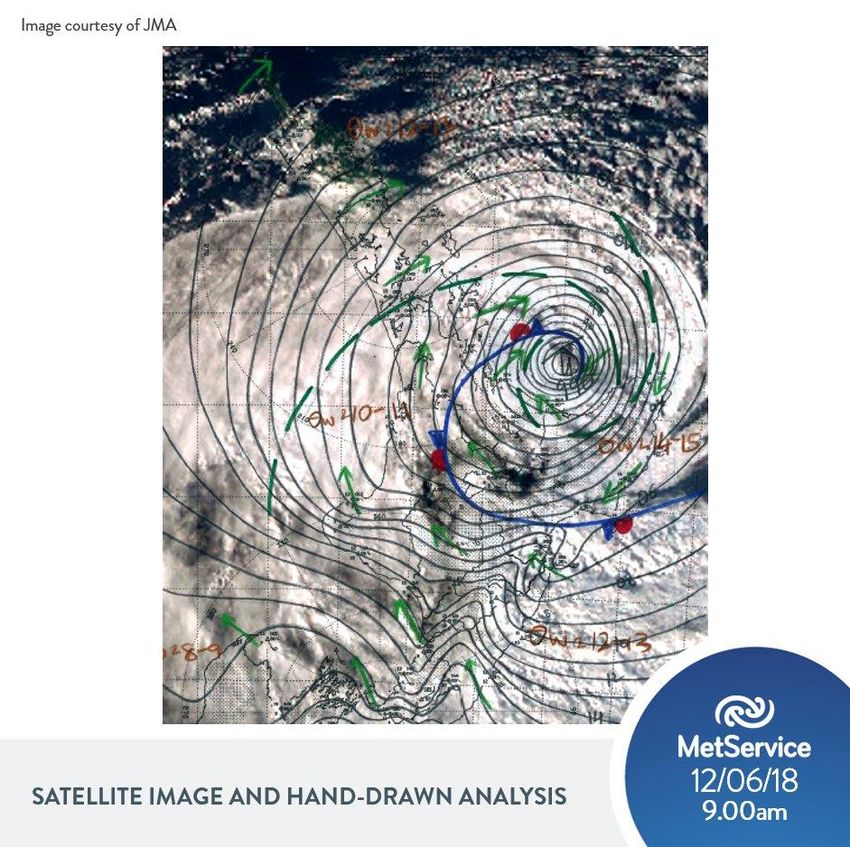
2.6 Observed rainfall and soil moisture conditions for selected sites
Figure 2.6 shows the location of selected GWRC rainfall and soil moisture
monitoring sites. Plots of accumulated rainfall and soil moisture trends are provided
in the following pages.
Figure 2.6: Map of GWRC rainfall and soil moisture monitoring locations
2.6.1 Rainfall accumulation for hydrological year (1 June to 31 May)
The following rainfall plots show total rainfall accumulation (mm) for the
hydrological year at several locations. For comparative purposes, cumulative plots
for selected historic years with notably dry summers have been included as well as
the site average.
Many of the GWRC telemetered rain gauge sites in the lower lying parts of the
Wairarapa have only been operating since the late 1990s so the period of data
presented is limited to the last two decades. For each historical record plotted, an
indication of ENSO climate state (El Niño, La Niña or neutral) at that time is also
given.
PAGE 10 OF 17What is the Data Showing?
GWRC does not operate a rain gauge in the southern-most parts of the Wairarapa
Valley that is suitable for presenting data in this report. This means that we cannot
be confident that the rainfall patterns seen elsewhere extend to this part of the region
other than the satellite and VCN data already presented.
Overall, rainfall accumulations for the year starting in June 2018 (labelled 2018 on
the plots) are trending from average to above average.
The above average rainfall experienced in the eastern hills during June is evident in
the steep accumulations at the Tanawa Hut and Longbush sites. Likewise, the very
wet July conditions over the Kapiti Coast are evident in the Otaki Depot graph.
Kāpiti Coast and Southwest (Wellington city)
1400 1600
Otaki Depot (Coastal Plain) Karori Sanctuary (Wellington City)
1200 1400
1200
Cummulative Rainfall (mm)
1000
1000
800
800
600
600
1982 (El Nino)
400 1997 (El Nino)
2002 (El Nino) 1997 (El Nino)
400 2007 (La Nina)
2007 (La Nina)
200 2014 (Neutral) 2014 (Neutral)
2015 (El Nino) 200 2015 (El Nino)
2016 (Neutral) 2016 (Neutral)
0 2017 (Neutral) 0 2017 (Neutral)
Mean (1990-2015) Mean (1990-2017)
-200 2018 -200 2018
Hutt Valley and the Tararua Range
3000 8000
Kaitoke Headworks (Hutt River catchment) Tararua Range (Angle Knob)
7000
2500
6000
2000
5000
Cummulative mm
1500 4000
1000 1997 (El Nino) 3000 1997 (El Nino)
2002 (El Nino) 2002 (El Nino)
2007 (La Nina) 2000 2007 (La Nina)
500 2014 (Neutral) 2014 (Neutral)
2015 (El Nino) 1000 2015 (El Nino)
2016 (Neutral) 2016 (Neutral)
0 2017 (Neutral)
2017 (Neutral) 0
Mean (1990-2017) Mean (1990-2017)
-500 2018 -1000 2018
PAGE 11 OF 17What is the Data Showing?
Wairarapa
1800 1200
Waiorongomai at Matthews Tauherenikau at Alloa/Racecourse
1600
1000
1400
1200 800
Cummulative mm
1000
600
800
400 2002 (El Nino)
600 2013 (Neutral) 2007 (La Nina)
2014 (Neutral) 2017 (Neutral)
400 200
2015 (El Nino) 2014 (Neutral)
200 2016 (Neutral) 2015 (El Nino)
2017 (Neutral) 0 2016 (Neutral)
0 Mean (2009-2017) Mean (1990-2017)
2018 2018
-200 -200
1000 1400
Masterton (Wairarapa College) Whareama at Tanawa Hut
900
1200
800
1000
700
Cummulative rainfall (mm)
600 800
500
600
400 1997 (El Nino)
2002 (La Nina)
400 2002 (El Nino)
300 2007 (La Nina) 2007 (La Nina)
2014 (Neutral) 2014 (Neutral)
200
2015 (El Nino) 200 2015 (El Nino)
100 2016 (Neutral) 2016 (Neutral)
2017 (Neutral) 0 2017 (Neutral)
0
Mean (2002-2017) Mean (1992-2017)
-100 2018 -200 2018
PAGE 12 OF 17What is the Data Showing?
1200
Waikoukou at Longbush
1000
800
Cummulative rainfall (mm)
600
400
2007 (La Nina)
2013 (Neutral)
200 2014 (Neutral)
2015 (El Nino)
2016 (Neutral)
0
2017 (Neutral)
Mean (1990-2017)
-200 2018
Live cumulative plots (updated daily): Real-time graphs for cumulative rainfall
are available online at GWRC’s environmental data webpage
(http://graphs.gw.govt.nz/). Select a rainfall monitoring site, then choose Cumulative
Historic from the Interval selector, then optionally change the period from the last
12 months to the hydrological year (July – June) as required
2.6.2 Soil moisture content (since 1 June 2018)
The following soil moisture graphs show the seven day rolling average soil moisture
content (%) since 1 June 2018. This is plotted over an envelope of the range of historic
recorded soil moisture data (and the median) at the site to provide an indication of how
the current soil moisture compares with that for a similar period in past years.
While the soil moisture plots are useful for tracking change within the current season
and comparing relative differences between years, the absolute moisture content (%)
for any given site and date should not be considered accurate. Many of the GWRC soil
moisture sites have not yet been fully calibrated to provide accurate absolute measures
of soil moisture.
The soil moisture behaviour at the four sites in the Wairarapa has shown largely above
average levels for the first three months of the 2018/19 year.
Levels at the Upper Hutt site have been tracking about average as of September.
PAGE 13 OF 17What is the Data Showing?
(a) Wairarapa
45 70
Southeast Wairarapa hills (Waikoukou) Northeastern Wairarapa hills (Tanawa Hut)
40
60
Soil Moisture Content (%) - 7 day average)
35
50
30
25 40
20 30
15
20
10
Historic range (min to max)
Historic range (min to max)
20th to 80th percentile 10 20th to 80th percentile
5 Median (2003-2017)
Median (2007-2017)
2018/19 2018/19
0 0
70 35
Masterton (Wairarapa College) Tauherenikau Racecourse
60 30
Soil Moisture Content (%) - 7 day average)
50 25
40 20
30 15
20 10
Historic range (min to max) Historic range (min to max)
10 20th to 80th percentile 5 20th to 80th percentile
Median (2002-2017) Median (2013-2017)
2018/19 2018/19
0 0
(b) Hutt Valley
40
Upper Hutt (Savage Park)
Soil Moisture Content (%) - 7 day average)
35
Live soil moisture plots (updated daily):
Real-time “envelope” graphs for soil moisture
30 are available online at GWRC’s environmental
data webpage
25 (http://graphs.gw.govt.nz/). Select a soil
moisture monitoring site, then choose
20
Envelope Graph from the Interval selector,
then optionally change the period from the last
Historic range (min to max) 12 months to the hydrological year (July –
15 20th to 80th percentile June) as required.
Median (2003-2017)
2018/19
10
PAGE 14 OF 173. Outlook for spring 2018
ENSO entering a new El Niño phase, but likely only weak and non-
conventional (so-called El Niño “Modoki”, or “pseudo El Niño”);
Sea Surface Temperature cooler to the west and warmer to the east of New
Zealand contributes to counteract potential ENSO impacts;
Possibly more easterly regime, which is opposite to the expected during
“normal” El Niños (low confidence);
Abrupt cold outbreaks in between long warmer periods (high confidence);
Rainfall: About average, heavy easterly events likely (low confidence for
average total);
Temperatures: Average to above (moderate confidence);
Whaitua* Variables Climate outlook for spring 2018
Temperature: Average to above. Abrupt cold spells between longer
Wellington warmer periods.
Harbour & Hutt
Valley About average for the season, but very variable month
Rainfall: to month.
Temperature: Average to above. Abrupt cold spells between longer
warmer periods.
Te Awarua-o-
Porirua
About average for the season, but very variable month
Rainfall: to month.
Temperature: Average to above. Abrupt cold spells between longer
warmer periods.
Kāpiti Coast
About average for the season, but very variable month
Rainfall: to month.
Temperature: Average to above. Abrupt cold spells between longer
warmer periods.
Ruamāhanga
About average for the season, but very variable month
Rainfall: to month. Significant easterly events possible.
Temperature: Average to above. Abrupt cold spells between longer
warmer periods.
Wairarapa Coast
About average for the season, but very variable month
Rainfall: to month. Significant easterly events possible.
*See http://www.gw.govt.nz/assets/Environment-Management/Whaitua/whaituamap3.JPG for whaitua
catchments
PAGE 15 OF 17Acknowledgments
We would like to thank NIWA for providing selected VCSN data points for the calculation of
the regional soil moisture map and for supplementing the rainfall percentage maps in data
sparse areas.
PAGE 16 OF 17Appendix
GWRC online climate mapping tools
Live regional climate maps (updated daily): Real-time climate maps for regional
rainfall and soil moisture (updated daily) are provided online at GWRC’s environmental data
webpage (graphs.gw.govt.nz/#dailyClimateMaps)
Drought check: http://www.gwrc.govt.nz/drought-check/
Interactive climate change maps: Easy to plot climate change mapping, available for
every season, for mid and late century. A total of 21 climate variables can be plotted, for
every greenhouse gas emission scenarios modelled by the IPCC. Dynamical downscaling
provided by NIWA: https://mapping1.gw.govt.nz/gw/ClimateChange/
GWRC Climate change webpage
http://www.gw.govt.nz/climate-change/
GWRC Seasonal climate variability and water resources webpage
http://www.gw.govt.nz/seasonal-climate-and-water-resource-summaries-2/
Reports
Main climate change report (NIWA 2017)
http://www.gw.govt.nz/assets/Climate-change/Climate-Change-and-Variability-report-
Wlgtn-Regn-High-Res-with-Appendix.pdf
Main climate drivers report (Climate Modes) (NIWA 2018)
http://www.gw.govt.nz/assets/Our-Environment/Environmental-monitoring/Environmental-
Reporting/GWRC-climate-modes-full-report-NIWA-3-Sep-2018-compressed.pdf
PAGE 17 OF 17You can also read