Investor presentation - May 2020 - pfandbrief.market

Page created by Andre Rios
 
CONTINUE READING
Investor presentation - May 2020 - pfandbrief.market
Investor presentation
May 2020
Investor presentation - May 2020 - pfandbrief.market
4.4                      DKB at a
    1990                                million
  FOUNDING YEAR
     100% subsidiary
       of BayernLB
                                      CLIENTS
                            Local authorities, companies and
                                      retail clients
                                                               glance
                                                               •   Leading lender for green and
                                                                   social infrastructure
 EUR 84                      EUR 70
         billion                       billion
                                                               • Second largest
BALANCE SHEET TOTAL                CLIENT LOANS
  One of the top 20 banks            in Germany                  Onlinebank in Germany
       in Germany

                                                               • Industry Leader in
                                                                 sustainability
                            EUR 951
  4,148                                 million
     EMPLOYEES              NET INTEREST INCOME
Investor presentation - May 2020 - pfandbrief.market
Highlights 2019
Strengthening the position among the TOP 20 banks in Germany

Business                                                            Results
 Strong growth in core business - EUR 3.6 billion                   Net interest income of EUR 951 million was slightly above
  increase in loans and advances to customers                         the previous year's figure (2018: EUR 945 million)
 Significant growth in total assets by more than                    Earnings with EUR 298m in line with previous year´s FY
  EUR 6 billion to EUR 84 billion                                     profit
 Expansion of digital distribution channels in the                  Investments in digitization and growth as main cost drivers
  business customer segment

Risk                                                                Ratios
 Further enhancement of asset quality                               Return on equity:         9.5%
 Significantly improved risk result                                 Cost-Income-ratio:       56.7%
 NPL ratio at a historical low (0.8%)                               Equity ratio:            11.2%

3 I Investor presentation I May 2020 I IFRS-data as of 31/12/2019
Investor presentation - May 2020 - pfandbrief.market
DKB and the Corona-crisis
Interim status as of 31/03/2020

 Germany                                                                Business development
 Comprehensive package of measures by the                               No extraordinary developments in core activities at
  German government and federal states to                                 present
  combat the economic consequences of corona                             Stable deposits and growing lending business
 Public authorities and development banks as                            Support of borrowers with the help of promotional
  financiers and guarantors for many aid
                                                                          loans and other tools
  programmes

                                                                    !
Credit risk                                                             Market risk
 DKB business focused in Germany
                                                                         Equity exposure in the low three-digit million range
 Consequences for borrowers cannot be fully
  assessed yet                                                           Bond exposure almost exclusively in LCR-eligible
                                                                          bonds of core European issuers
 Task Force for monitoring and management of the
  Corona crisis established

4 I Investor presentation I May 2020 I IFRS-data as of 31/12/2019
Investor presentation - May 2020 - pfandbrief.market
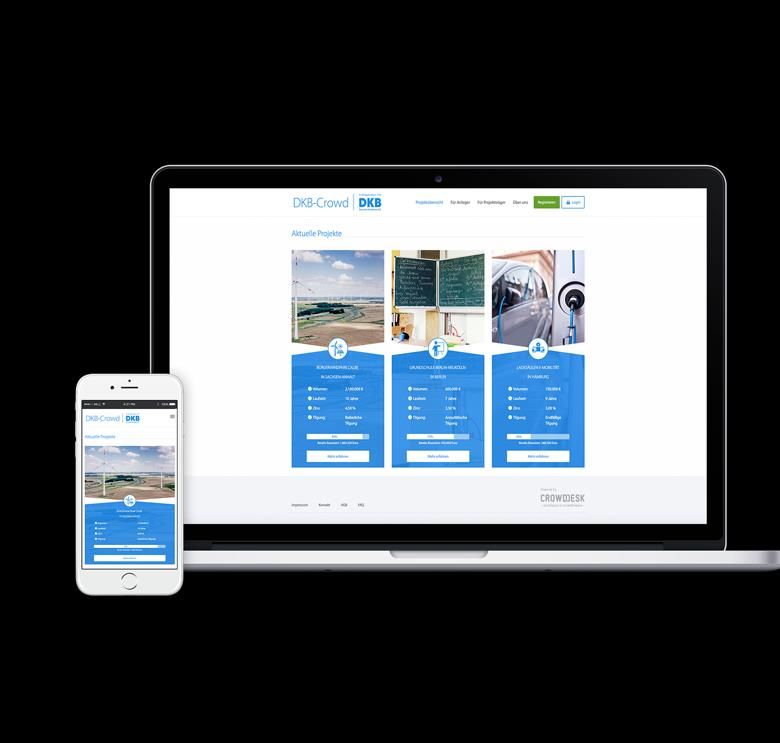
Corona-impact due to DSGV-scenario analysis
As of 01/04/2020 (for corporate and individual clients only)

Loan Volume (EURbn)                                                                                               Corona impact scenario
30                                                                                                                German Savings Banks
                                                                                                                   Association (DSGV) has
                                                                                                                   published a scenario analysis
                             Housing                                                                               regarding the impact of Covid-19
                              22,7
20                                                                                                                Based on economic sectors and
                                                                                                                   DSGV industry forecast
                         Local authorities & social
                               infrastructure                                                                     Considers supply shortfalls, the
                                    13,8                                                                           drop in demand and the
                                                        Environmental
                                                         technologies
                                                                                                                   government interventions
10
                                                             8,6
                                                                                                                  Impact index (6 = strong impact
                        Food &                                           Individual clients
                       agriculture                                              2,7
                                                                                                                   of crisis, 1 = low)
                                                                                           Other corporates
                           3,7                         Energy & supply
                                                             6,5
                                                                                            (incl. tourism)       “Translation” of the impact index
                                                                                                   1,4
                                                                                                                   into DKB client groups
 0
     0             1                 2             3                4         5               6        Impact index

Source: DSGV and DKB
5 I Investor presentation I May 2020 I IFRS-data as of 31/12/2019
Investor presentation - May 2020 - pfandbrief.market
Investor presentation
Agenda

      1         DKB´s position in BayernLB group

      2         Business model

      3         Sustainability

      4         Facts and figures

      5         Funding

      6         Contacts

6 I Investor presentation I May 2020 I IFRS-data as of 31/12/2019
Investor presentation - May 2020 - pfandbrief.market
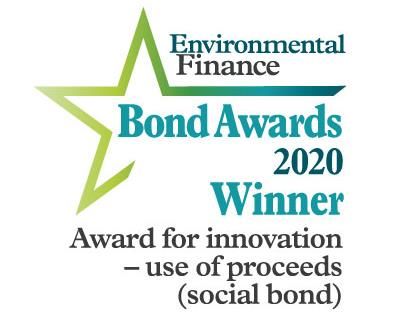
Investor presentation
  1       DKB´s position in BayernLB group

7 I Investor presentation I May 2020 I IFRS-data as of 31/12/2019
Investor presentation - May 2020 - pfandbrief.market
Ownership structure
Wholly-owned subsidiary of BayernLB

                 Free State of Bavaria                                                             Association of Bavarian Savings Banks
                      ≈ 75 %
                                                            BayernLB Holding AG                                    ≈ 25 %

                                                                                                            Binding letter of comfort and
                                                                                                            profit/loss transfer agreement

                                                                          Real Estate &
            Corporates & Markets
                                                                    Savings Banks/Association

     Specialized bank for the future issues                     Reliable and strong real estate         Innovative Tech-Bank with
           of the German economy                                           financier                        industry know-how
                                                            Central Bank of the Bavarian savings
                                                                           banks

8 I Investor presentation I May 2020 I IFRS-data as of 31/12/2019
Investor presentation - May 2020 - pfandbrief.market
Realignment of Bayerische Landesbank
Focus, efficiency, growth

                                                                    Transformation programme until 2024

                               Key note                                                            Investments
 Specialisation in high-growth future fields                                   Investment offensive at DKB
 Sustainable banking and responsibility for society                            Expansion in real estate financing business
                                                                                Investments in infrastructure and IT

                                  Focus                                                                Costs
 Concentration in business with corporate                                       Significant cost reduction in BayernLB core bank
    customers and in capital market business on                                  Simplification and streamlining of IT
    profitable and sustainable areas
 Expansion of real estate business and structured
    financing

Source: Excerpt from the presentation "Strategic realignment of BayernLB" (as of 19.12.2019)
9 I Investor presentation I May 2020 I IFRS-data as of 31/12/2019
Investor presentation - May 2020 - pfandbrief.market
Current corporate concept of DKB
Sustainable growth

                          Client                                     Market
                           Excellence in all touchpoints             > 8m clients until end of 2023
                           Convincing customer experiences           Corresponding growth in the
                                                                       loan portfolio
                           Sustainability as USP

                          Organisation                               Processes
                           Crossfunctional organisation              Scalability and acceleration of
                            structures                                 the business
                           New type of cooperation and target        Conversion of the current
                            culture                                    process landscape

10 I Investor presentation I May 2020 I IFRS-data as of 31/12/2019
2
Investor presentation
  2         Business model

11 I Investor presentation I May 2020 I IFRS-data as of 31/12/2019
Business model
Lending business as the core of the bank - sustainable and low-risk

              Second biggest
               Online Bank in                                                         Infrastructure
               Germany                             Retail clients                          43.0         Financing of services for the
                                                       12.8
                                                                                                         public welfare
              Market leader
               regarding
               current
               accounts

              Biggest renewable
               energy portfolio in
                                                                                                        Projects usually with a
               Germany                                Corporate                                          municipal background
                                                       clients
              Market leader in                         13.5
               agricultural                                            Loan volume
               business                                                      =
                                                                     84% of total assets

12 I Investor presentation I May 2020 I IFRS-data as of 31/12/2019
Business units
Focus on only a few business lines - low risk and sustainable

                                  Business customers                                            Retail clients
  26 branches
     across                                                                                                                 Online
   Germany
                   Infrastructure                            Corporate clients                                             approach
                                        6.5bn                            8.6bn                     7.8bn
             22.7bn

                                      Energy &                       Environmental
                                       supply                         technology
                                                                                     3.7bn     Mortgage loans    2.3bn
                                       13.8bn
            Housing                                                                              2.7bn
                                                                                                                Personal
                                                                     1.4bn        Food &
                                                                                                                 loans
                                                                                 agriculture

                                Local authorities &                                             Individual
                                      social                       Other                       clients and
                                  infrastructure                 corporates                        other

13 I Investor presentation I May 2020 I IFRS-data as of 31/12/2019
Retail clients
Growth and digitisation drivers                                            3.2m accounts

                                                                                     2.8m accounts

                                                                                               1.7m accounts

                Digital (further) development and cooperation
                     with Fintechs as a long-term strategy

                                                                     Market leader in current accounts
                                                                      among the top3 online banks*

*Source: Annual reports, corporate press releases for 2019
14 I Investor presentation I May 2020 I IFRS-data as of 31/12/2019
Growth strategy
Currently 4.4m clients, goal 8m customers
                                                                                              8m clients until 2023

 9,0
                                                                     Scalability of
 8,0                                                                 Lending
 7,0
                                                                     business

 6,0

 5,0                                                DKB Broker
 4,0

 3,0                                                                                  Expansion of
                                                                                      product range
 2,0
                                                   DKB Cash
 1,0

 0,0
         2007 2008 2009 2010 2011 2012 2013 2014 2015 2016 2017 2018 2019 2020 2021 2022 2023

15 I Investor presentation I May 2020 I IFRS-data as of 31/12/2019
Digitization within DKB
Innovations across all customer segments

                            DKB Crowd

                                                                                          Own Fintech

                                                                     Stake in municipal
                                                                      funding platform

16 I Investor presentation I May 2020 I IFRS-data as of 31/12/2019
Investor presentation
  3         Sustainability

17 I Investor presentation I May 2020 I IFRS-data as of 31/12/2019
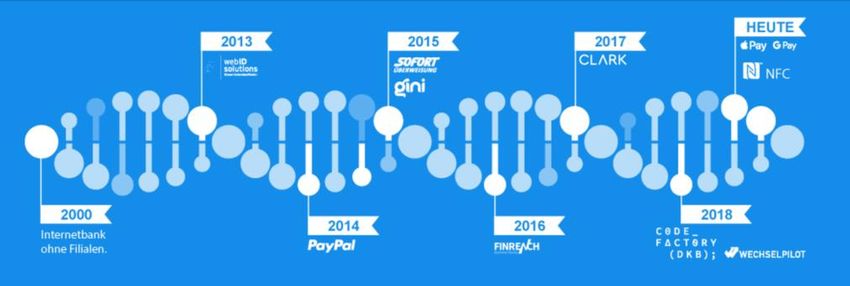
Sustainability anchored in business model
Implemented regarding clients, products and processes

      1996                         2001                     2004                             2014                2016                  2018
      First wind                   Launch of the                                             Account opening     First green bond      First social bond
                                                            Establishment of
      turbine                      online bank.                                              process becomes     issued.               issued.
                                                            DKB STIFTUNG.
      financed.                                                                              100% digital.

         1998                         2002                   2009                              2015
                                      First day-care
         First public-                                       Sustainability                    Industry
                                      centre for children
         private                                             management                        Leader with
                                      (Kita).
         partnership                                         embedded                          ISS-oekom for
         project.        2000              2003              directly in the   2013            the first time.     2017                     2019
                                           First             Board of          DKB Bürger-                         New forms of             Rated as
                         First
                                           PV plant          Management.       sparen                              work through             outstanding by
                         biogas
                                           financed.                           scheme.                             “Projekt Arbeiten        Focus Money.
                         plant.
                                                                                                                   4.0” project.

18 I Investor presentation I May 2020 I IFRS-data as of 31/12/2019
Blue Sustainability
DKB‘s sustainability concept

   Differentiation                                                     Blue sustainability

• Expansion of the
                                                                     • Ecological + social
  concept of sustainability
                                                                     • Orientation towards
• Sustainable
                                                                       people's needs
  Development Goals
  (SDGs) as a strategic                                              • Positioning
  foundation                                                           sustainability in the
                                                                       mainstream
• Inclusive instead of
  exclusive

19 I Investor presentation I May 2020 I IFRS-data as of 31/12/2019
Sustainability@ DKB
Our four central goals for the future

                                                            Lead the most convincing sustainable product range
                          until 2023
                                                            among the TOP-20 banks

                          until 2030                        EUR 80bn in sustainable financing

                          until 2030                        Become carbon neutral in our office operations

                          until 2050                        Meet the 2-degree-goal with all DKB products
                                                            (under Paris Climate Convention on Global Warming)

20 I Investor presentation I May 2020 I IFRS-data as of 31/12/2019
Signpost sustainability
SDG-Mapping of the balance sheet

                                                                     77.8%
          77.8% of our customer
        loans (EUR 54.1bn) have
         a significant contribution

Source: DKB Annual Report 2019 (Data as of 31.12.19)
21 I Investor presentation I May 2020 I IFRS-data as of 31/12/2019
Outstanding ratings for sustainable performance
Industry leader among commercial banks

      Industry Leader in sustainability                              Best Green Bond Ratings worldwide

22 I Investor presentation I May 2020 I IFRS-data as of 31/12/2019
Investor presentation
  4         Facts and figures

23 I Investor presentation I May 2020 I IFRS-data as of 31/12/2019
Overview
Annual comparison*

 Key figures                                              2019          2018      2017      2016      2015      2014
 Total assets                                                  83.8bn    77.3bn    77.3bn    76.5bn    73.4bn    71.6bn

 Customer receivables                                          69.5bn    65.9bn    64.5bn    63.2bn    61.6bn    59.6bn

 Customer deposits                                             60.8bn    54.4bn    53.9bn    53.4bn    48.6bn    47.3bn

 Net interest income                                            951m      945m      935m      795m      790m      670m

 Profit after tax                                               298m      301m      263m      327m      225m      165m

 Cost income ratio (CIR)                                       56.7%     51.5%     50.8%     45.8 %    48.0 %    56.1 %

 Return on equity (ROE)                                          9.5%    10.2%      9.6%     12.4 %     9.6 %     6.1 %

 Equity ratio                                                  11.2%     11.1%     10.5%     10.0 %     9.1 %     9.9 %

* DKB Group in accordance with IFRS, in EUR
24 I Investor presentation I May 2020 I IFRS-data as of 31/12/2019
Business performance
Successful new loan business and diversified liability structure

                           Loan volume (EURbn)                                        Customer deposits (EURbn)
                                                   +3.6       69.5
             64.5           +1.4        65.9                                                                                   60.8
                                                                                                                    +6.4
              0.2                        0.1
                                                                0.2           53,9           +0.5       54.4
                                                               12.8                                                              3.6
              13.0                      12.4                                                              4,0
                                                                               4.3
                                        13.2                   13.5
              13.7
                                                                                                                                40.8
                                                                               31.5                      35.0

              38.0                      40.2                   43.0
                                                                               2.6                        2.4                    2.3
                                                                               15.5                      13.0                   14.1

             2017                       2018                   2019            2017                      2018                   2019

                     Infrastructure   Corporates   Retail   Other                     Infrastructure   Corporates   Retail   Other

   Growth driver: Infrastructure segment, especially housing          Rise of liabilities equivalent to asset growth, mainly driven
                                                                        by retail unit
   Private and corporate customer segments also show
    growth                                                             Slight increase in deposit volumes in the corporate
                                                                        customer segment

25 I Investor presentation I May 2020 I IFRS-data as of 31/12/2019
Key Figures and ratios
Net interest income exceeding previous year level

      Net interest income (EURm)                                       Cost Income Ratio               LCR
                                                                                      56.7%
                                                                     50.8%   51.5%
                                        951                                                   31.12.2019     164%
                          945
           935
                                                                                              30.06.2019     145%

          2017           2018           2019                         2017     2018     2019

        Net profit after tax (EURm)
        Tourismus                                                       Return on equity         Leverage Ratio

                                                                     9.6%    10.2%     9.5%
                          301            298                                                  31.12.2019     3.71%
          263
                                                                                              30.06.2019     3.88%

          2017           2018            2019                        2017     2018     2019

26 I Investor presentation I May 2020 I IFRS-data as of 31/12/2019
Risk figures
Improved loan book quality, NPL-ratio at hostorical low

        RWAs based on SA* (EURbn)                                      Risk result (EURm)            Equity ratios (SA*)
                           65.9                  69.5                                            10.5%          11.1%           11.2%
          64.5                                                                                                                   9.3%
                                                                                                  8.8%          9.4%
                                                                     -127
                                                                              -112
          30.9                 31.5               33.2
                                                                                        -56       8.6%          9.1%             9.1%

          2017             2018                  2019                2017     2018     2019       2017          2018            2019
                                                                                                         Equity ratio
                 Loan book                      RWAs                                                     Core capital ratio (T1)
                                                                                                         Common equity tier (CET1)

              Loan book quality                                       Non performing loans          Capital measures
       2.4% 0.8%
                                Investmentgrade (up to BBB-)
      12.5%                                                                                     Strengthening of equity in 2019
                                Non-Investmentgrade (up to BB-)
                                                                     0.9%     0.9%      0.8%     through intra-group subordinated
               84.4%            Non-Investmentgrade (up to C)                                    transaction
                                Non Performing Loans

                                                                     2017     2018      2019
* Standardised approach (SA)

27 I Investor presentation I May 2020 I IFRS-data as of 31/12/2019
Investor presentation
  5         Funding

28 I Investor presentation I May 2020 I IFRS-data as of 31/12/2019
Ratings of DKB
Stable credit and sustainability ratings

                                                                                  Public                      Mortgage         Senior
          Agency                         Type of rating
                                                                                Pfandbriefe                  Pfandbriefe      Unsecured
          Moody‘s                   Covered Bond Rating                                 Aaa                       Aaa

                                    LT issuer rating                                                                               A1

                                    Junior Senior
                                    Unsecured                                                                                      A2
                                    (senior non-preferred)*

                                    Adjusted BCA                                                                                 baa1

                                    Outlook                                                                                      stable

          ISS-ESG                   Sustainability rating                                 -                        -           B- (Prime)

             imug                   Sustainability rating                     Very positive (A)              Positive (BBB)   Positive (BB)

* Updated rating as of 20/08/2018 due to new law in Germany introducing senior (non-) preferred liabilties
29 I Investor presentation I May 2020 I IFRS-data as of 31/12/2019
Funding of DKB
Diversified refinancing options

                                           Primary funding source, diversified                        5% 1%
Customer deposits                                                                               11%
                                           through all client segments

Development                                Pass-through and global loans
banks                                      (e.g. from KFW, EIB, Rentenbank)               15%         Liabilities**        68%

                                           Since 2006 mainly via Pfandbriefe,
Capital markets                            2016 and 2017 Green Bonds respectively,
funding                                    Since 2018 Social Bonds, first Retail Social
                                           Bond as well as first Blue Social Bond                     Customer deposits*
                                                                                                      Development Banks
                                                                                                      Capital market
                                                                                                      Equity capital
                                                                                                      Other
*Treasury perspective without registered bonds held by non-banks
** In relation to total assets
30 I Investor presentation I May 2020 I IFRS-data as of 31/12/2019
Capital market funding
Focus on secured funding and sustainable bonds

                                                Capital markets funding depends on deposit growth and maturities
                                                Since 2006 focus on secured funding, around EUR 17bn total volume printed so far
Funding strategy                                Two Senior unsecured Green Bond benchmarks outstanding since 2016 (EUR 500m each)
                                                Three Social Bond issues: First social covered bond (2018) and first Blue Social Bond
                                                 worldwide (2019) EUR 500m each and first Retail Social Bond (2019)

                   Placement volume (EURm)                                                         Maturity profile (EURm)
 2.500                                                                      2.500
 2.000                                                                      2.000
 1.500                                                                      1.500
 1.000                                                                      1.000
   500                                                                       500
     0
          2010 2011 2012 2013 2014 2015 2016 2017 2018 2019                         2020 2021 2022 2023 2024 2025 2026 2027 2028 2029

          Pfandbriefe    Senior unsecured (Green Bond)      Social Bond              Pfandbriefe    Social Bond   Senior unsecured (Green Bond)

31 I Investor presentation I May 2020 I IFRS-data as of 31/12/2019
Green Bond Programme
Green Bonds to refinance renewable energy project business

    Renewable energy portfolio: EUR 10.8bn

   10.000
    8.000                                                                    2016   500 Mio. EUR, senior unsecured
    6.000
    4.000
                                                                             2017   500 Mio. EUR, senior unsecured
    2.000
         0
             2012 2013 2014 2015 2016 2017 2018
                Wind     Photovoltaics     Biogas                    Green
                                                                     Bonds

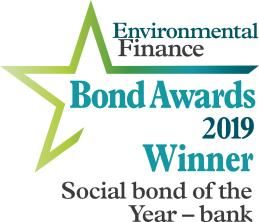
32 I Investor presentation I May 2020 I IFRS-data as of 31/12/2019
Social Bond Programme
First Social Pfandbrief (covered bond) – also for retail clients

                                                                              2018   EUR 500m, Social covered bond

                             Social                                           2019   EUR 500m, Blue Social Bond
                         infrastructure

                                                                              2019   Retail Social covered bond

                                                                     Social
                                                                     Bonds

33 I Investor presentation I May 2020 I IFRS-data as of 31/12/2019
Public pfandbrief cover pool
Overview
                                                                                Federal
                                                                               Republic of
                                                                      Other     Germany
                                                                      2.4%       0.3%      Federal
 Cover assets                        Number      Volume*                                States (GER)
                                                                                            7.6%
 German federal government                18            21

 German federal states                   159       1.036

 German cities and municipalities      5.716       7.766
                                                                           Cities and                   100% German assets
 Other cover assets                       42           197                municipalities

 Total                                 5.935       9.020
                                                                            (GER)
                                                                            89.7%                       High granularity
 * EURm                                                                                                  (Ø-volume EUR 1.5m)
                                                                                                        Rating over-collateralization
                                                                                                         requirements significantly
 Key figures*                                                                                            exceeded
 Outstanding bond volume (EURm)                 3.500
                                                                                                        Collateral score stable on
 Rating Moody's                                  Aaa                 Private
                                                                                    Bearer               low level
                                                                     place-
                                                                                    bonds
 Over-collateralization required by Moody‘s     1.0%                  ment
                                                                                     48%
                                                                      52%
 NPV over-collateralization                    156.8%

 Collateral score                               2.7%
* As of December 2019
Source: Moody’s

34 I Investor presentation I May 2020 I IFRS-data as of 31/12/2019
Public cover assets in comparison
By region*
                           Germany      Greece          Ireland         Italy       Portugal          Spain         Rest of Europe       Others

            Deutsche Kreditbank                                                                                                                     In line with our
       Stadtsparkasse Hannover
      Stadtsparkasse Düsseldorf                                                                                                                     business model
            Sparkasse KölnBonn
                   M M Warburg
                                                                                                                                                    100% German
              Landesbank Berlin                                                                                                                     cover assets
            Kreissparkasse Köln
                       BayernLB
                         NordLB
                          LBBW
                         Helaba
DB Privat0 u. Firmenkundenbank
                  Unicredit Bank
                 Münchener Hyp
                       DSK Hyp
                      Berlin Hyp
    Hamburg Commercial Bank
                         DZ Hyp
                      DekaBank
                         SaarLB
                     Aareal Bank
                  Deutsche Hypo
                  Commerzbank
              Dt. Pfandbriefbank

                              0%     10%         20%          30%         40%          50%          60%          70%             80%   90%   100%

* in % of the cover pool (without “further cover assets” according to para. 20 (2) No. 1 and 2 Pfandbrief Act and derivatives)
Source: BayernLB Research, as of 31/12/2019
35 I Investor presentation I May 2020 I IFRS-data as of 31/12/2019
Mortgage pfandbrief cover pool
Overview
                                                                                          Thuringia 6%
                                                                                                           Baden-Württemberg 4%
Cover assets                         Number    Volume                  Schleswig Holstein 2%                        Bavaria 4%

Residential loans                    39.220      2.146                 Saxony-Anhalt 8%
                                                                                                                            Berlin 13%

Housing-industry investors            3.343      4.621                 Saxony 11%

                                                                                                                           Brandenburg 12%
Other cover assets                       8        310                Saarland 0%

Total                                42.571      7.077                                                                                        100% German assets
                                                            Rhineland-Palatinate 1%
                                                                                                                         Bremen 1%
Volumen in Mio. EUR                                                                                                                           Very high granularity
                                                                 Northrhine-Westphalia
                                                                          14%                                          Hamburg 3%
                                                                                                                                              Housing-industry investors
                                                                           Lower Saxony 5%                            Hesse 7%
                                                                                                     Meckenburg Western                        are mainly residential
                                                                                                       Pomerania 9%
                                                                                                                                               property companies
Key figures*
                                                                                                                                              Rating over-collateralization
 Outstanding bond volume (EURm)               4.409
                                                                                           Private                                             requirements significantly
                                                                                           Place-
 Rating Moody's                                Aaa
                                                                                            ment
                                                                                                           Bearer                              exceeded
                                                                                                           Bonds
Over-collateralization required by                                                          51%             39%
                                              9.5%
Moody‘s
 NPV over-collateralization                   57.7%
 Collateral score                             6.7%
* As of December 2019
Source: Moody’s

36 I Investor presentation I May 2020 I IFRS-data as of 31/12/2019
Mortgage cover assets in comparison
By type of use*
                                       Residential                             Commercial                                Others
               Deutsche Kreditbank
     Bausparkasse Schwäbisch Hall
                                                                                                                                               Share of residential
             PSD Bank Rhein Ruhr
               PSD Bank Nürnberg
                                                                                                                                               housing > 90%
                           INGDiBa
                     Commerzbank
         SantanderConsumer Bank
           Wüstenrot Bausparkasse
                    Münchener Hyp
   DB Privat0 u. Firmenkundenbank
          Stadtsparkasse Hannover
               Kreissparkasse Köln
Deutsche Apotheker0 und Ärztebank
               Sparkasse KölnBonn
         Stadtsparkasse Düsseldorf
                    Hamburger Spk
                     Unicredit Bank
                            NordLB
                 Landesbank Berlin
                            DZ Hyp
                             LBBW
                         Berlin Hyp
                          DSK Hyp
                             Helaba
                     Deutsche Hypo
                      M M Warburg
        Hamburg Commercial Bank
                 Dt. Pfandbriefbank
                          BayernLB
                        Aareal Bank
             Natixis Pfandbriefbank
                            SaarLB
                         DekaBank

                                 0%   10%         20%          30%         40%         50%         60%         70%          80%   90%   100%

* in % of the cover pool (without “further cover assets” according to para. 20 (2) No. 1 and 2 Pfandbrief Act and derivatives)
Source: BayernLB Research, as of 31/12/2019
37 I Investor presentation I May 2020 I IFRS-data as of 31/12/2019
Investor presentation
  6         Contacts

38 I Investor presentation I May 2020 I IFRS-data as of 31/12/2019
Personal
Uwe Jurkschat
Head of Funding and Investor Relations
Tel.: +49 (0)30 12030-2924
E-Mail: uwe.jurkschat@dkb.de

Anna Stawowy
Funding and Investor Relations
Tel.: +49 (0)30 12030-2910
E-Mail: anna.stawowy@dkb.de

www.dkb.de | Bloomberg DKRE 

Folgen Sie uns

                     @DKB_de
Disclaimer
The information in this presentation constitutes neither an offer nor an invitation to subscribe to or purchase securities. It does not
represent a recommendation to buy, sell or hold any securities. The information in this presentation is solely intended for
informational purposes and does not serve as a basis for any kind of obligation, contractual or otherwise. The presentation may not
be copied in whole or in part, distributed, forwarded or sent directly or indirectly by any means to a third party without prior written
consent.

Statements in this presentation represent solely the opinion of Deutsche Kreditbank AG. All the information contained in this
presentation has been compiled with care. However, Deutsche Kreditbank AG does not expressly or silently guarantee the
accuracy, completeness or suitability of the information in this presentation for any particular purpose. Deutsche Kreditbank AG
assumes no direct or indirect liability from this presentation. Furthermore, investors should bear in mind that statements concerning
past performance do not indicate or represent a guarantee of future performance or returns. Deutsche Kreditbank is under no
obligation to update or regularly review the information in this presentation.

This presentation may be subject to legal restrictions in some jurisdictions. All persons in possession of this presentation are
explicitly advised to personally inquire about any restrictions that may apply and to comply with them. The information may not be
used in foreign jurisdictions without permission.

40 I Investor presentation I May 2020 I IFRS-data as of 31/12/2019
You can also read