DDOS Attacks Analysis Based On Machine Learning in Challenges of Global Changes
←
→
Page content transcription
If your browser does not render page correctly, please read the page content below
DDOS Attacks Analysis Based On Machine Learning in
 Challenges of Global Changes

 Roman Lynnyk1, Victoria Vysotska2[0000-0001-6417-3689], Yurii Matseliukh3[0000-0002-1721-
 7703]
 , Yevhen Burov4[0000-0001-6124-3995], Lyubomyr Demkiv5[0000-0002-2802-3461], Andrij
Zaverbnyj6[0000-0001-7307-536X], Anatoliy Sachenko7[0000-0002-0907-3682], Inna Shylinska8[0000-
 0002-0700-793X]
 , Iryna Yevseyeva9[0000-0002-1627-7624], and Oksana Bihun10[0000-0001-6358-9607]
 1-6
 Lviv Polytechnic National University, Lviv, Ukraine,
 7-8
 Ternopil National Economic University, Ternopil, Ukraine
 9
 De Montfort University, Leicester, UK
 10
 Mathematics University of Colorado, Colorado Springs, USA

 roman.lynnyk.sa.2017@lpnu.ua1, Victoria.A.Vysotska@lpnu.ua2,
 indeed.post@gmail.com3, 40anzas@gmail.com4

 Abstract. This article will allow users to search for the necessary information
 about DDOS attacks around the world and predict future attacks, check whether
 their network protection is working, and help to debug it. The purpose is to in-
 vestigate possible DDOS attacks, predict possible attacks on specified IP ad-
 dresses, attack duration, server load. The object of work is DDOS attacks in the
 world. The subject of work is the research of DDOS attacks collected from
 around the world during 2019. The main task of this work is to develop soft-
 ware implementation of the product, machine learning methods that will help to
 investigate and predict the activities of DDOS attacks. The program should help
 predict and predict DDOS risks based on previous hacker attacks; predict attack
 time, number of packets transmitted, server load, etc. This subject area is now,
 no matter how, but remains one of the most relevant topics from the beginning
 of the 21st century to the present day and will most likely be relevant in the
 coming years.

 Keywords: DDoS Attacks, Machine Learning, Data Analysis, Classification.

1 Introduction

One of the most popular analogs of research and work is Microsoft's DDoS Protection
Attack Analytics and rapid response for the Microsoft Azure cloud service. As the
frequency of DDoS attacks continues to rise, affecting almost two out of five compa-
nies. DDoS attacks are the most common reason for disabling the service.
 Another analog is «Secure Watch Analytics». Corero SecureWatch® Analytics is
a powerful security analytics web portal that provides a comprehensive and easy-to-
read security dashboard. The information panels are based on specialized distributed
denial of service (DDoS) channels from the SmartWall Corero defense system. Co-
Copyright © 2020 for this paper by its authors.
Use permitted under Creative Commons License Attribution 4.0 International (CC BY 4.0).
rero uses Splunk's big data and advanced visualization software to convert complex
security event data into a toolbar available through the SecureWatch-Analytics-
Dashboard-Thumbnail-ImageSecureWatch portal. This analytics portal provides host-
ing providers, service providers and businesses with a window for DDoS attacks and
cyber threats targeted at their online services. Real-time security dashboards on the
portal provide unprecedented visibility to the organization's network and security
activities to respond quickly to these threats [1-7].

2 Related Work

In this work, the existing data sets are comprehensively used and the new proposed
system for DDoS-attacks is used [3]. A new data set, named CICDDoS2019, was
generated. It eliminates all current shortcomings. A new approach to family identifi-
cation and classification based on a set of network flow functions is proposed using
the generated data set. It also provides the most important feature sets for detecting
different types of DDoS attacks with the appropriate weight.
 Basic Attributes of the selected Dataset are such ones:

• Stream ID
• Flow duration
• Timestamp
• Protocol;
• Destination port
• Destination IP address
• Source Port
• IP source
• Packet transmission over time
• Total time for packet transmission
• The total number of packets that were transmitted
• Notes (Flags)

Besides, there are other signs of dataset selection. Additional information about the
data set are as follows:

• The number of instances of objects is> 1,000,000 for different types of servers.
• Related tasks: Classification, clustering, regression.
• Published by the Canadian Institute of Cyber Security in the 4th quarter of 2019
 with data collected from various companies.
• This dataset contains 54 attributes.
• Data was collected from different IP servers using different ports, collected data on
 the length of packet transmission, time spent on packet transmission, etc.
• Data were also collected based on different machines (OS) such as Ubuntu,
 Fortinet, Win 7, 8, 8.1, 10, and on different days.
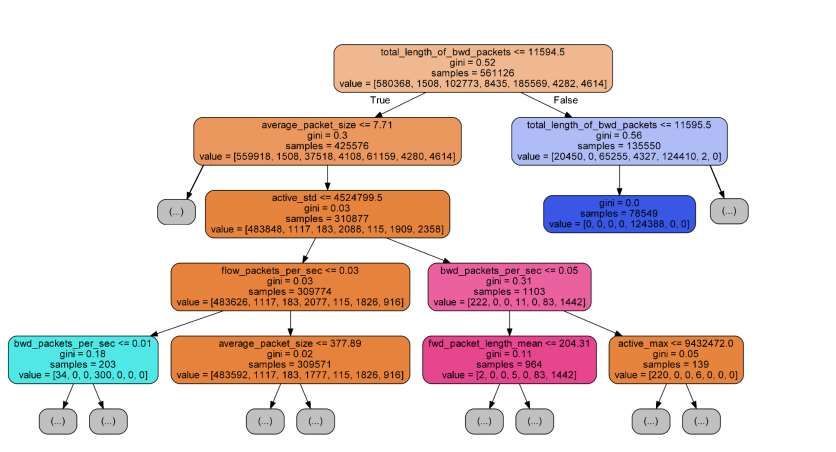
The Data set supports classification, clustering, and regression methods. The decision
tree method, which is implemented here, is the classification tree one. The tree struc-
ture contains the following elements: "leaves" and "branches" [1] (Fig. 1).

Fig. 1. The decision tree method structure.
Each leaf shows the target variable value changed by moving from root to leaves.
Each internal node corresponds to one of the input variables [1, 8-15]. Dividing the
target variable sets into subsets based on testing attribute values is used at the classifi-
cation tree. This process is repeated on each of the resulting subsets. The recursion
ends when the subset at the node achieves the same target variable values. Therefore,
it does not add value to the predictions [1, 16-21] The top-down induction of decision
tree (TDIDT) belongs to an absorbing "greedy" algorithm and is currently the most
common decision tree strategy for data [2, 22-28]. In data mining method, decision
trees can be used as mathematical and computational methods to help describe, classi-
fy, and generalize a set of data that can be written as follows: Implementation: C #
(WPF / Class TreeView) [2, 29-34].

3 Case Study

Firstly, let us load the data into pandas Dataframe:
pd.set_option("display.max_rows", None, "display.max_columns", None)
df = pd.read_csv('C:/Users/monuel/Desktop/01-12/DrDoS_DNS.csv', sep=",")

Secondly, let's describe it and check for zero values, etc.:

Thirdly, let's select the attributes needed to work with the model (see Fig.2):
Fig. 2. The DataSet Description Next, let's construct charts to illustrate how attribute values depend on their values and peaks (see Fig.3-8): sns.distplot(df['Total Length of Fwd Packets'], kde=False, bins=30, color='blue') plt.show() sns.distplot(df[' Total Fwd Packets'], kde=False, bins=30, color='blue') plt.show() sns.distplot(df[' Total Backward Packets'], kde=False, bins=30, col- or='blue') plt.show() plt.figure(figsize=(15, 6)) sns.countplot(x='Total Length of Fwd Packets', data=df, hue=None, pal-
ette='GnBu')
plt.show()

Fig. 3. The diagram of the total length of Fwd packets

Fig. 4. The diagram of the total length BackWard packets
Fig. 5. The diagram of the total number of Fwd packets

Fig. 6. The number distribution of sent packets versus to certain time intervals

plt.figure(figsize=(8, 6))
sns.scatterplot(x=' Flow Duration', y=' Total Fwd Packets', data=df,
hue=None)
plt.show()

plt.figure(figsize=(8, 6))
sns.scatterplot(x=' Flow Duration', y=' Total Backward Packets', da-
ta=df, hue=None)
plt.show()
Fig. 7. The scattering diagram of the duration of sending Fwd packets

Fig. 8. The scattering diagram of the duration of sending BackWard packets
Next, let's break the data into learning and test [8-9]. This can be achieved by a scaler
train test split model.

Next, let's scale the data:

Next, let's create a linear regression model using the available data. Let's create an
instance of the LinearRegression class, which will represent a regres-sion model [8-
11]:
model = LogisticRegression(solver='liblinear', max_iter=99999, ran-
dom_state=0)

Using .fit () let's calculate the optimal values of the weights ₀ and ₁, using the exist-
ing input and output (x and y) as arguments. In other words, .fit () corresponds to the
model.
model.fit(X_train, y_train)
print(model.classes_)

Next, let’s derive the accuracy of the predicted model and other data (Fig.9).

Fig. 9. The model accuracy

The Intercept and coefficient models are shown in Fig.10:
modelIntercept = model.intercept_
print(modelIntercept)
modelCoef = model.coef_
print(modelCoef)
Fig. 10. The coefficient model

Next, let’s run a test probation of the model (Fig.11):
predictProbationOfModel = model.predict_proba(X_train)

Fig. 11. The test probation of the model at 1

Next, let’s test the model at 0 and 1 (Fig.12):
predictOfModel = model.predict(X_train)

Fig. 12. Probation of the model at 0 and 1

Obtained results of the model are shown in Fig.13:
Fig. 13. The model results

Next, let’s build a Confusion matrix (Fig.14).

Fig. 14. The confusion matrix

Next, let’s build a report on the classification as a string or dictionary:

Next, let’s build a report on the classification as a line or dictionary.

Next, let’s improve the model:

As results, we get the accuracy of the improved model and other data (Fig.15):

Fig. 15. The accuracy of the improved model
4 Conclusions

In this article, we looked at DDos attacks in the world, looked at the growth of DDos
and the relevance of this topic. We researched the dataset of the Canadian University
of Cybersecurity and described it. We considered how long it takes to send Fwd and
Backward packets. Also, the number of packet transmissions over a period has been
investigated. The distribution and confusion matrices for given attributes have been
built. An accuracy of 0.08 has got, but that is because we used a small amount of data.
Also the result to 0.09. has been improved. Python tools, namely: pandas, matplotlib,
numpy, sklearn have been used for creating a model, learning, data storage, and visu-
alization.

References
 1. Shpyrko, V., Koval, B.: Fraud detection models and payment transactions analysis using
 machine learning, SHS Web of Conferences (2019)
 2. Kupin, A., Muzyka, I., Ivchenkm R.: .Information Technologies of Processing Big Indus-
 trial Data and Decision-Making Methods", 2018 International Scientific-Practical Confer-
 ence Problems of Infocommunications. Science and Technology (PIC S&T) (2018)
 3. DDoS Evaluation Dataset, https://www.unb.ca/cic/datasets/ddos-2019.html.
 4. What is DDos Attacks, https://aws.amazon.com/ru/shield/ddos-attack-protection/
 5. Bublyk, M., Rybytska, O., Karpiak, A., Matseliukh, Y.: Structuring the fuzzy knowledge
 base of the IT industry impact factors. In: Computer sciences and information technologies
 : Proceed. of the 2018 IEEE 13th International Scientific and Technical Conference,
 (2018). DOI: https://doi.org/10.1109/STC-CSIT.2018.8526760.
 6. Matseliukh, Y., Vysotska, V., Bublyk, M.: Intelligent system of visual simulation of pas-
 senger flows. In: CEUR Workshop Proceedings, 2604, 906. (2020)
 7. Bublyk, M., Matseliukh, Y., Motorniuk, U., Terebukh, M.: Intelligent system of passenger
 transportation by autopiloted electric buses in Smart City. In: CEUR Workshop Proceed-
 ings, 2604, 1280. (2020) http://ceur-ws.org/Vol-2604/paper81.pdf
 8. Linear Regression in Python, https://realpython.com/linear-regression-in-python/
 9. Linear Reggression, https://scikit-
 learn.org/stable/modules/generated/sklearn.linear_model.LinearRegression.html
10. Pandas DataFrame, https://www.geeksforgeeks.org/python-pandas-dataframe/
11. Plotting with MatPlotLib, https://pandas.pydata.org/pandas-
 docs/version/0.13.1/visualization.html
12. Kravets, P.: Adaptive method of pursuit game problem solution. In: Modern Problems of
 Radio Engineering, Telecommunications and Computer Science Proceedings of Interna-
 tional Conference, TCSET, 62-65. (2006)
13. Kravets, P.: Game methods of construction of adaptive grid areas. In: The Experience of
 Designing and Application of CAD Systems in Microelectronics, 513-516. (2003)
14. Veres, O., Ilchuk, P., Kots, O.: Application of Data Mining to Exchange Rate Influence
 Identification. In: Computational Linguistics and Intelligent Systems, COLINS, CEUR
 workshop proceedings, Vol-2604, 1117-1126. (2020).
15. Babichev, S.: An Evaluation of the Information Technology of Gene Expression Profiles
 Processing Stability for Different Levels of Noise Components. In: Data, 3 (4), art. no. 48.
 (2018)
16. Babichev, S., Durnyak, B., Pikh, I., Senkivskyy, V.: An Evaluation of the Objective Clus-
 tering Inductive Technology Effectiveness Implemented Using Density-Based and Ag-
 glomerative Hierarchical Clustering Algorithms. In: Advances in Intelligent Systems and
 Computing, 1020, 532-553. (2020)
17. Berko, A.Y., Aliekseyeva, K.A.: Quality evaluation of information resources in web-
 projects. In: Actual Problems of Economics 136(10), 226-234. (2012)
18. Malachivskyy, P.S., Pizyur, Y.V., Andrunyk, V.A.: Chebyshev Approximation by the Sum
 of the Polynomial and Logarithmic Expression with Hermite Interpolation. In: Cybernetics
 and Systems Analysis, 54(5), 765-770. (2018)
19. Orekhov, S., Malyhon, H., Liutenko, I., Goncharenko, T.: Using Internet News Flows as
 Marketing Data Component. In: Computational Linguistics and Intelligent Systems,
 COLINS, CEUR workshop proceedings, Vol-2604, 358-373. (2020).
20. Lutskiv, A., Popovych, N.: Big Data Approach to Developing Adaptable Corpus Tools. In:
 Computational Linguistics and Intelligent Systems, COLINS, CEUR workshop proceed-
 ings, Vol-2604, 374-395. (2020).
21. Pavlenko, O., Tymofieieva, I.: Search Query Data Analysis: Challenges and Opportunities.
 In: Computational Linguistics and Intelligent Systems, COLINS, CEUR workshop pro-
 ceedings, Vol-2604, 452-461. (2020).
22. Berko, A., Alieksieiev, V.: A Method to Solve Uncertainty Problem for Big Data Sources.
 In: International Conference on Data Stream Mining and Processing, DSMP, 32-37. (2018)
23. Berko, A.Y.: Models of data integration in open information systems. In: Actual Problems
 of Economics, (10), 147-152. (2010)
24. Berko, A.Y.: Methods and models of data integration in E-business systems. In: Actual
 Problems of Economics (10), 17-24. (2008)
25. Berko, A.: Consolidated data models for electronic business systems. In: The Experience
 of Designing and Application of CAD Systems in Microelectronics, 341-342. (2007)
26. Zhezhnych, P., Markiv, O.: Recognition of tourism documentation fragments from web-
 page posts. In: 14th International Conference on Advanced Trends in Radioelectronics,
 Telecommunications and Computer Engineering, TCSET, 948-951. (2018)
27. Zhezhnych, P., Markiv, O.: Linguistic comparison quality evaluation of web-site content
 with tourism documentation objects. In: Advances in Intelligent Systems and Computing
 689, 656-667. (2018)
28. Zhezhnych, P., Markiv, O.: A linguistic method of web-site content comparison with tour-
 ism documentation objects. In: International Scientific and Technical Conference on Com-
 puter Sciences and Information Technologies, CSIT, 340-343. (2017)
29. Kravets, P.: Game method for coalitions formation in multi-agent systems. In: Internation-
 al Scientific and Technical Conference on Computer Sciences and Information Technolo-
 gies, CSIT, 1-4. (2018)
30. Kravets, P., Prodanyuk, O.: Game task of resource allocation. In: Experience of Designing
 and Application of CAD Systems in Microelectronics, CADSM, 437-438. (2009)
31. Kravets, P.: Game methods of the stochastic boundary problem solution. In: Perspective
 Technologies and Methods in MEMS Design, MEMSTECH, 71-74. (2007)
32. Chen, J., Dosyn, D., Lytvyn, V., Sachenko, A.: Smart data integration by goal driven on-
 tology learning. In: Advances in Intelligent Systems and Computing, 529, 283-292. (2017)
33. Lytvyn, V.: The similarity metric of scientific papers summaries on the basis of adaptive
 ontologies. In: Proceedings of 7th International Conference on Perspective Technologies
 and Methods in MEMS Design, MEMSTECH, 162. (2011)
34. Lytvyn, V.V., Tsmots, O.I.: The process of managerial decision making support within the
 early warning system. In: Actual Problems of Economics, 149(11), 222-229. (2013)
You can also read