Stock Market Analysis using Data Visualization - International ...
←
→
Page content transcription
If your browser does not render page correctly, please read the page content below
International Journal of Recent Technology and Engineering (IJRTE)
ISSN: 2277-3878, Volume-8 Issue-6, March 2020
Stock Market Analysis using Data Visualization
Bharat Gupta, Shefali Bhardwaj, K. Govinda, Rajkumar. R
however a major drawback of this is that it does not attempt to
Abstract: Stock market is an important part of the economy of predict the future and so we do not consider possible
any country. People generally use stocks as an investment and try situations and depend only on previous data. Value at Risk
to get a profit out of them. Investing in the stock market is a huge (VaR) [15] helps us find the risk in financial assets. It
risk-return. One bad decision can lead to huge losses while one
good decision can result in good profit. To make sure that our estimates how much a set of investments might lose, given
investment decisions are not bad, one must choose the right stock. normal market conditions, in a set time period such as a day.
In this project we have tried to do the same. We have incorporated VaR is typically used by firms and regulators in the financial
the functions to view data like closing prices, highs, lows etc. industry to gauge the amount of assets needed to cover
Using this data one can know the general trend of some stock but possible losses. It is an improvement over FCFF as it is a
how to know whether the stock is risky or not. In this paper, we
implemented two algorithms, namely Bootstrap method and
quantitative measure compared to FCFF but it retains the
Monte Carlo simulation for risk analysis. same drawback i.e. it does not consider possible situations of
the future.
Keywords: Correlation, Monte Carlo, Probability, GBM,
Geometric Brownian motion (GBM) [2] is a process where
Normal.
the logarithm of a time changing value follows Brownian
I. INTRODUCTION motion with drift. This is an innovation in stock market
analysis as it is the first predictive model in stocks. However,
Humans since a long time back have used pictures to it is not very reliable. Monte Carlo simulation [2] can be used
to find probability and simulate uncertain situations.
represent information and today it has become a very big, hot However, we can only analyze the maximum risk and
topic in computer science in the form of data visualization. confidence level from using plain Monte Carlo simulation.
[1]. Visualization is the graphical representation of Afterwards, an even better method was found which used
information while providing an analysis of the data in Monte Carlo simulation as a basis called geometric Brownian
graphical form so that the user can draw a conclusion from it. motion. It beats all the previous methods in the aspect that it
Information visualization is something related to finding uses techniques of Monte Carlo simulation to predict risk, can
relationships between numbers, datasets and functions. be used to build a predict model, which though not always
Numerical data analysis needs specialized knowledge to draw correct but is more reliable compared to the previously used
out information out of them. On the other hand, it is easier to method’s.
understand the visual representation of data. We can easily
find out relations and trends in data in this manner as we use III. PROPOSED METHOD
our visual senses which is more familiar to us. Pictures
generally mean more to humans and is easier and faster for us In this paper, we predict the risk by using the Bootstrap
to analyze and understand. method and Monte Carlo Simulation. Firstly we Store stock
prices in database and Retrieve data from database. Then Plot
Stock analysis is the analysis of a particular stock, stock
the closing prices of a stock. Calculate the moving averages
sector or the whole national market and one of its key parts is
for given days and daily returns. We Correlation between
finding out risks associated with stocks and the future prices
different stocks and predict Risk analysis by Bootstrap
of stocks as well. If done and utilised in a proper manner, it method and Monte Carlo simulation.
can be used to gain profit and avoid loss. Monte Carlo We have used Python as a base for our project with MySQL
simulations is a method used to find the probability (or set of as the database. We have connected these two using a Python
probabilities) of different events which cannot be easily library called SQLAlchemy. We are getting the requested
determined due to the interference of several random factors. stock data from Yahoo Finance through Pandas and storing
It is used to find out risk and uncertainty of risk. this data into our database. Then we use the data in the
database to illustrate this data in different ways and finally we
II. LITERATURE REVIEW show risk analysis using two different algorithms, Bootstrap
Free Cash Flow Analysis: It is a way to look at the flow of and Monte Carlo simulation.
cash to find which cash is available for use and the status of
A. Moving Average
the other cash also. It can used to determine how much cash
can be taken out from a company without disrupting its A moving average (MA) is a measure of stock prices which
operations. It is a very useful method for risk analysis, tends to remove unnecessary information such as a sudden
unreasonable spike in stock price for no reason. For example,
a 10-day moving average would be average of first 10 stock
Revised Manuscript Received on March 14, 2020. prices.
Bharat Gupta, SCOPE, VIT, Vellore, India
Shefali Bhardwaj, SENSE, VIT, Vellore, India
K. Govinda, SCOPE, VIT, Vellore, India
Rajkumar.R, SCOPE, VIT, Vellore, India
Published By:
Retrieval Number: C4193098319/2020©BEIESP Blue Eyes Intelligence Engineering
DOI:10.35940/ijrte.C4193.038620 & Sciences Publication
2629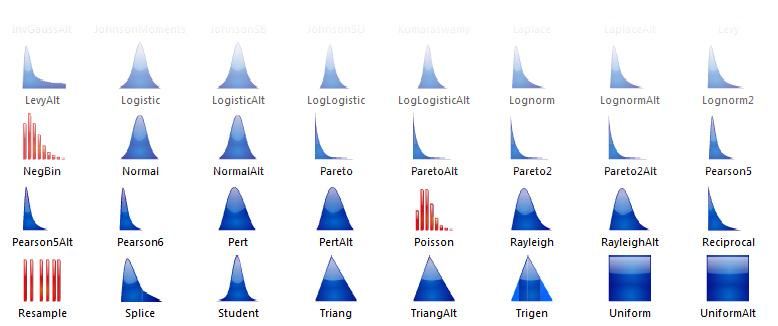
Stock Market Analysis using Data Visualization
Fig1. Calculating the Moving Averages
Return = ((Today’s price – Yesterday’s Price)/Yesterday’s
Price) *100.
#When return is a positive number, a profit is made.
#When return is a negative number, a loss is made.
B. Correlation of Stocks
Correlation [13] is the degree to which two variables move
with respect to each other. It is used to compare relation
between stocks. Correlation is calculated as correlation
coefficient also known as Pearson’s coefficient, which lies
between -1 to 1.
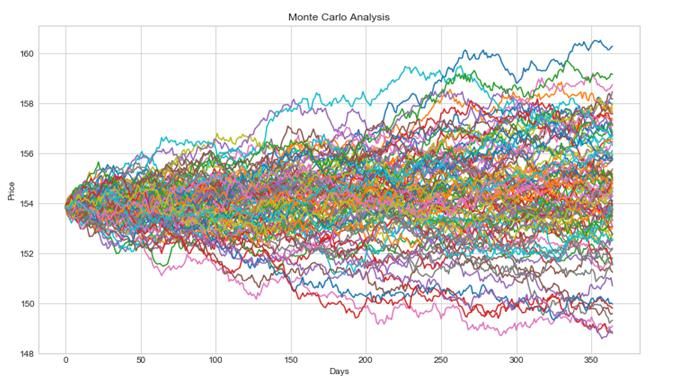
Fig3.Probability distribution graphs using Monte Carlo
Simulation
D. Bootstrap
Bootstrapping [6]is used to find standard error estimates
and confidence levels for measures like mean. It may also be
used to test hypotheses using sample tests. This method is
mostly used as another method for parametric estimates when
other methods’ assumptions are unreliable.
In Bootstrap method, samples are generated by resampling
Fig2. Correlation of Stocks the observed information many times. Whenever the
C. Monte Carlo Simulation distribution of the data is not known, Bootstrap method is
considered as the best method. The main advantage of
Monte Carlo simulation [2] can be used to find the Bootstrap method is that it does not make any assumptions,
maximum risk associated with a stock provided the conditions instead it generated the data from the past stock data. The fact
and its impact. It is used to find uncertainty in our prediction that sample distribution is poor for true distribution, is
models. The main feature of Monte Carlo simulation is that Bootstrap method’s main disadvantage.
given the range of variations of parameters that affect the To find the risk percentage, we calculate the quantile of the
quantity, we can determine the most likely outcomes. Daily returns. Suppose we have to find the number from a
In Monte Carlo simulation, a value/range of values is array of data where 30% values are below and 70% above
selected from a randomizing function which lies between the 6 9 11 12 12 13 19 21 22 31 32 35 38 45 44 52 55 68 79 80 81
given ranges. Using the randomized values, we calculate our 88 90 91 92 100 112 113 114 120 121 132 145 146 149 150
expected result. The result is recorded and we again start by 155 174 184 192
randomizing the values and calculating the result. This is Bootstraps follows the given procedure
repeated a huge number of times, so that most cases can be Order the given data
taken into account for more accurate prediction of our Find number of observations n
required values. The result of the simulation is large number We make q=0.3 as we want a number with 30% values
of plots based on several different input values and they all below it
represent several scenarios. Our ith observation=q(n+1)=0.3*(40+1)=12.3
Answer: The ith observation is 12.3 which upon rounding off
is 12. The 12th number in set is35, i.e. 35 is the number with
30% values below it.
Published By:
Retrieval Number: C4193098319/2020©BEIESP Blue Eyes Intelligence Engineering
DOI:10.35940/ijrte.C4193.038620 & Sciences Publication
2630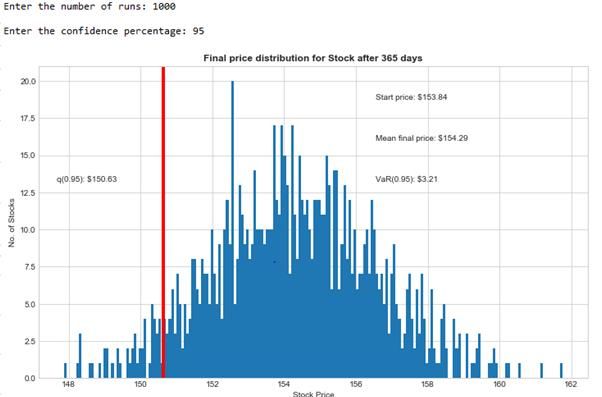
International Journal of Recent Technology and Engineering (IJRTE)
                                                                          ISSN: 2277-3878, Volume-8 Issue-6, March 2020

                       IV. RESULTS
  For first option: Store stock prices
  Input: AAPL (stock quote)
  Output: Stock stored in Database
    For second option: Retrieve stock data
    Input: AAPL.
                    Table1. Stock data

                                                                                Fig5. Moving averages for given days.

                                                                       A moving average (MA) is a broadly utilized marker in
                                                                    technical stock analysis that allows us to filter sudden random
                                                                    spikes in stock data which distort the trend in stocks. So, the
                                                                    Graph in blue is the graph for prices and the Graph in orange
                                                                    is the graph for moving average, which shows that the general
                                                                    trend is “Increase in prices”.
                                                                    For fifth option: Daily returns
                                                                    Input: AAPL

                Fig4. Closing Price of Stock

   The Figure4 shows the Adjusted Closing prices of the stock
for last one year. An Adjusted Closing price [17] is a stock's
end cost on some random day of exchange that has been
corrected to incorporate any circulations and corporate
activities that happened whenever before the following day's
open. For instance, an organization choose to part the                                      Fig6. Daily returns
organization's stock two-for-one. Along these lines, the
organization's shares outstanding increment by a various of         A Return or a Financial Return is simply known as the money
two, while its offer cost is isolated by two. In the event that a   made or lost by investing in a stock over certain period of
stock shut at $200 the day preceding its stock split, the end
                                                                    time. We can find return by simply finding the ratio of
cost is changed in accordance with $100, or $200 isolated by
                                                                    profit/loss and its last price. Y-axis here shows the return% of
2, per offer to demonstrate the impact of the corporate
                                                                    Apple stock for one year.
activity.
     For fourth option: Find moving averages for given              For Sixth Option: Correlation between different stocks
     days                                                           Input: AAPL FB TSLA
     Input: Stock Quote and No. of days

                                                                       Published By:
   Retrieval Number: C4193098319/2020©BEIESP                           Blue Eyes Intelligence Engineering
   DOI:10.35940/ijrte.C4193.038620                                     & Sciences Publication
                                                                2631
Stock Market Analysis using Data Visualization

         Fig7. Correlation between different stocks
As we know that denser and more linear the points are, more
is the Pearson’s correlation coefficient, we can tell that Apple
and Facebook are most correlated. In contrast, Apple and
Tesla are least correlated. Whereas, Tesla and Facebook are
moderately correlated.                                                     Fig9. Risk analysis by Monte Carlo simulation.

For seventh option: Risk analysis by Bootstrap method                 This was just a demonstration of how the graphs will look
Input: AAPL and Confidence percentage                              like for 100 runs. But for better results we have to calculate
                                                                   the average for at least a thousand possible values.

         Fig8. Risk analysis by Bootstrap method

   Or simply we can say that out of all the prices we have,                     Fig10. Price distribution of the stock
what is the minimum return, above which 95%(say) of the
prices reside.                                                     From this graph we can say that for stock Apple, if the start
                                                                   price is $153.84 then after one year the price should be
                                                                   $154.29. And with 95% confidence we can say that the loss
                                                                   would not be more than $3.21 i.e. your final price should not
                                                                   go below $150.63.
                                                                   If we compare Bootstrap algorithm and Monte Carlo
                                                                   Simulation, the Bootstrap algorithm is purely based on the
                                                                   past stock prices whereas Monte Carlo simulation works on
                                                                   both the average of the past prices and random value
                                                                   generation     over    huge
                                                                   number of runs and then

                                                                      Published By:
   Retrieval Number: C4193098319/2020©BEIESP                          Blue Eyes Intelligence Engineering
   DOI:10.35940/ijrte.C4193.038620                                    & Sciences Publication
                                                               2632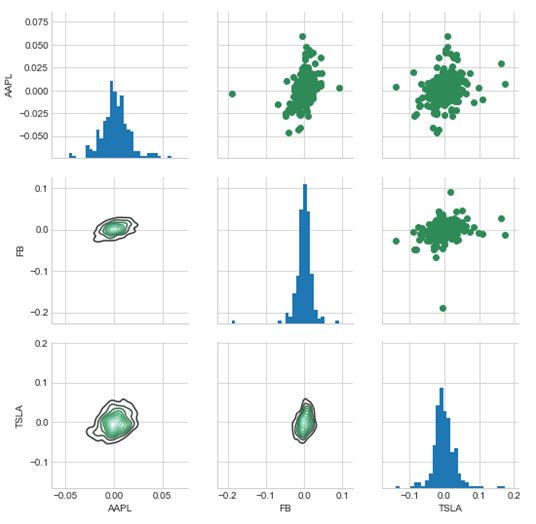
International Journal of Recent Technology and Engineering (IJRTE)
                                                                                    ISSN: 2277-3878, Volume-8 Issue-6, March 2020

taking the mean of those numbers.                                               9.    Kalyani, D., Ramasubbareddy, S., Govinda, K., & Kumar, V. (2020).
                                                                                      Location-Based Proactive Handoff Mechanism in Mobile Ad Hoc
                                                                                      Network. In International Conference on Intelligent Computing and
                    Table2. Comparative Analysis                                      Smart Communication 2019 (pp. 85-94). Springer, Singapore.
 METHOD                         CONFIDENCE                       VALUE          10.   Bhukya, K. A., Ramasubbareddy, S., Govinda, K., & Srinivas, T. A. S.
                                                                 AT RISK              (2020). Adaptive Mechanism for Smart Street Lighting System. In
                                                                                      Smart Intelligent Computing and Applications (pp. 69-76). Springer,
 Stock              Bootstrap                          95%       $3.47                Singapore.
 Apple              Method                                                      11.   Srinivas, T. A. S., Somula, R., & Govinda, K. (2020). Privacy and
 (AAPL)             Monte                              95%       $3.36                Security in Aadhaar. In Smart Intelligent Computing and Applications
                                                                                      (pp. 405-410). Springer, Singapore
                    Carlo                                                       12.   Rajasekaran Rajkumar, Mridul Bhasin, K.Govinda, Jolly Masih,
                    Simulation                                                        M.Sruthi: IoT-Based Health Services Framework for Endless Ailment
 Stock              Bootstrap                          95%       $1.78                Administration at Remote Areas. Incorporating the Internet of Things in
 Microsoft          Method                                                            Healthcare Applications and Wearable Devices, 10/2019: pages
                                                                                      184-198; IGI-global., ISBN: 2327-9354.
 (MSFT)             Monte                              95%       $1.54          13.   Rajkumar Rajasekaran, Govinda k, Ashrith Reddy, Uday Sai Reddy,
                    Carlo                                                             Yashwanth Reddy: Visual Analysis of Temperature Time Series and
                    Simulation                                                        Rainfall Using Big Data. DOI:10.36872/LEPI/V50I3/201023.
                                                                                14.   Rajasekaran Rajkumar, K.Govinda, Anushka Jindal, Rushil Mehtani,
 Stock              Bootstrap                          95%       $16.27               Jolly Masih, Maddineni Charan Sai: Visualization Effect of Changing
 Tesla              Method                                                            Climatic      Trends      on     Natural      Calamities:Hurricanes.
 (TSLA)             Monte                              95%       $20.60               DOI:10.36872/LEPI/V50I3/201022.
                    Carlo
                    Simulation                                                                          AUTHORS PROFILE
                                                                                Bharat Gupta, I am 20 years old. I’ve been born and brought up in New
                         V. CONCLUSION                                          Delhi, India. I live in a joint family which includes 5 members – My father,
                                                                                mother, sister, grandmother and me. Currently, I am pursuing Computer
  Stock analysis is one of the most important things in the                     Science Engineering from VIT Vellore. My hobbies include skating,
finance sector. Different graphical representations and                         swimming, chess, lawn tennis, badminton and table tennis. I have been an
                                                                                international level chess player..
mathematical calculation can avoid bad investments and
forecast future prices. We saw graphs for Moving Average
and Daily Return. We also saw correlation plots that show us                                             Shefali, is a student of 3rd year BTech Biomedical
                                                                                                         at VIT Vellore. She is an 19 year old from Delhi.
how two different stocks are dependent on each other. For risk
                                                                                                         She is the recipient of Scholar’s Gold Certificate
analysis we saw two different algorithms that are Bootstrap                                              for seven consecutive years during her school days
algorithm and Monte Carlo simulation. Bootstrap method                                                   and also won a Silver Medal in French Olympiad.
predicts the risk using past data which is not a practical                                               Shefali has completed her schooling from DPS
                                                                                                        RK Puram and cleared her CBSE with a percentile
approach. Monte Carlo simulation creates its own                                of 93.2%. As a person she is always willing to learn new things in life.
possibilities for hundreds of times following a mathematical
formula and then gives the final price after averaging the                                             Dr. K.Govinda. Associate Professor in VIT from
                                                                                                       2005 to till date, received the degree in computer
prices of each test case. Hence, we can conclude that Monte                                            science and engineering from Nagarjuna
Carlo Simulation is better than Bootstrap method.                                                      University in 1998. M.Tech from JNTU,
                                                                                                       Hyderabad. Life member in CSI, IEEE and ACM.
REFERENCES                                                                                             Published 100 + papers and participated in 50+
                                                                                                      conferences. Interest area include Database, Data
1.   https://www.cs.uic.edu/~kzhao/Papers/00course_Data_visualization.pd        Mining, Cloud Computing, IOT and Big Data.
     f
2.   https://stackoverflow.com/questions/16729574/how-to-get-a-value-fro
     m-a-cell-of-a-datafram.                                                                              Dr. Rajkumar Rajasekaran, graduated in
3.   Govinda.K, Sahaj Singh Maini, “Stock Market Prediction using Data                                    Electrical and Electronics Engineering from
     Mining Techniques“, in the Proceedings of International Conference on                                Madras University in 2000 and received Master’s
     Intelligent Sustainable System, Dec’2017.                                                            degree in Computer Science & Engineering from
4.   K.Govinda, Shruthi Hiremath, “Rainfall Prediction Using Artificial                                   VIT University, Vellore. He has completed his
     Neural Network”, International Journal of Applied Engineering                                        Ph.D. from Vellore Institute of Technology
     Research,Vol:9,No:23, pp: 21231-21241.                                                              University, Vellore in Computer Science and
5.   Krishna, A. V., Ramasubbareddy, S., & Govinda, K. (2020). A Unified        Engineering. Her research area includes Data Analytics, Data Mining, Big
     Platform for Crisis Mapping Using Web Enabled Crowdsourcing                Data, Machine learning and Data Visualization. He has been teaching from
     Powered by Knowledge Management. In International Conference on            last 17 years with emphasis on Data Science.
     Intelligent Computing and Smart Communication 2019 (pp. 195-205).
     Springer, Singapore..
6.   Saraswathi, R. V., Nalluri, S., Ramasubbareddy, S., Govinda, K., &
     Swetha, E. (2020). Brilliant Corp Yield Prediction Utilizing Internet of
     Things. In Data Engineering and Communication Technology (pp.
     893-902). Springer, Singapore.
7.   Kumar, I. P., Gopal, V. H., Ramasubbareddy, S., Nalluri, S., & Govinda,
     K. (2020). Dominant Color Palette Extraction by KMeans Clustering
     Algorithm and Reconstruction of Image. In Data Engineering and
     Communication Technology (pp. 921- 929). Springer, Singapore.
8.   Kumar, I. P., Sambangi, S., Somukoa, R., Nalluri, S., & Govinda, K.
     (2020). Server Security in Cloud Computing Using BlockChaining
     Technique. In Data Engineering and Communication Technology (pp.
     913-920). Springer, Singapore.

                                                                                     Published By:
     Retrieval Number: C4193098319/2020©BEIESP                                       Blue Eyes Intelligence Engineering
     DOI:10.35940/ijrte.C4193.038620                                                 & Sciences Publication
                                                                            2633
You can also read