Climate and Water Resources Summary for the Wellington Region - Autumn 2018 summary Winter 2018 outlook - Greater Wellington Regional Council
←
→
Page content transcription
If your browser does not render page correctly, please read the page content below
Climate and Water Resources Summary
       for the Wellington Region

            Autumn 2018 summary
             Winter 2018 outlook

Release date: 21 June 2018

Alex Pezza, Mike Thompson, Mike Harkness and
Jon Marks

Environmental Science Department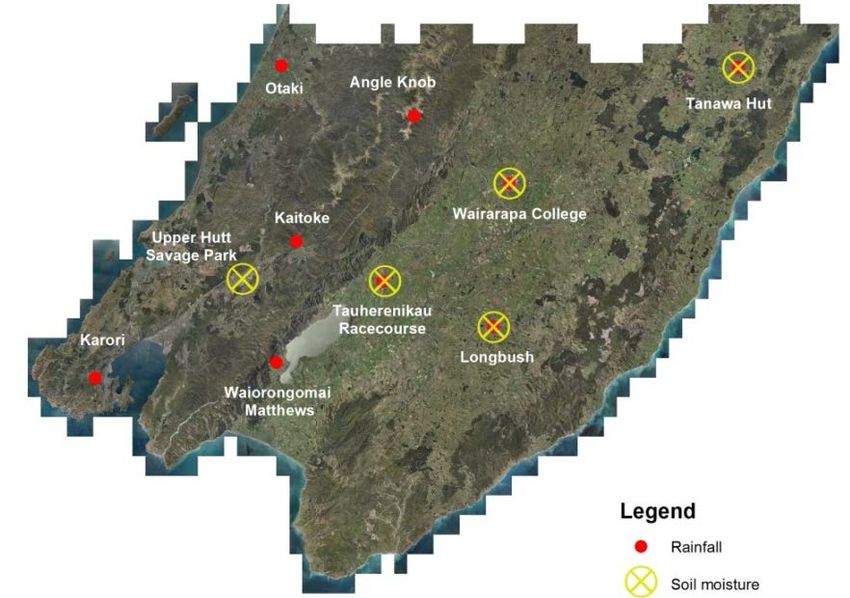
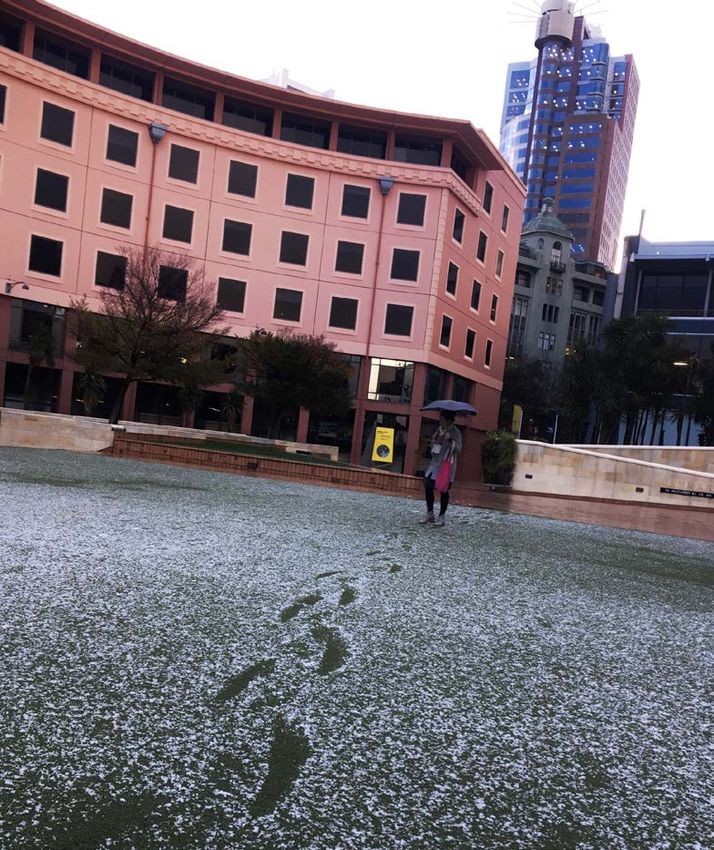
Wellington after a very cold hail storm on the morning of 28 May 2018.
  Photo: Dominion Post

DISCLAIMER
This report has been prepared by Environmental Science staff of Greater Wellington Regional Council (GWRC) and as
such does not constitute Council policy.
In preparing this report, the authors have used the best currently available data and have exercised all reasonable skill
and care in presenting and interpreting these data. Nevertheless, GWRC does not accept any liability, whether direct,
indirect, or consequential, arising out of the provision of the data and associated information within this report.
Furthermore, as GWRC endeavours to continuously improve data quality, amendments to data included in, or used in
the preparation of, this report may occur without notice at any time.
GWRC requests that if excerpts or inferences are drawn from this report for further use, due care should be taken to
ensure the appropriate context is preserved and is accurately reflected and referenced in subsequent written or verbal
communications. Any use of the data and information enclosed in this report, for example, by inclusion in a subsequent
report or media release, should be accompanied by an acknowledgement of the source.
Regional Overview

Overview
Autumn 2018
Autumn 2018 was marked by very unsettled weather patterns, starting very wet and
warm and leaning more towards a normal pattern in the second half of the period.
March was the second warmest on record in the far south around Ngawi, still
responding to the above normal warm waters that had prevailed since December. Then
on the 10th of April the region all of a sudden experienced a very strong blast of cold
Antarctic air that was very early in the season, with places like Upper Hutt having the
lowest April day time (maximum) temperature on record. The burst of cold air was a
shock to the system, even more so after the exceptional hot summer months. Also in
contrast to summer, the region was windier than normal, and a few notable gusts were
recorded both on the western hills and Wairarapa coast, including 143km/h in
Castlepoint. There were additional cases of flooding, heavy wind and lightning strikes
causing adverse impacts throughout the entire season, including a heavy hail shower in
Wellington (technically called ‘graupel’) on 28th May.

Climate drivers
The El Niño - Southern Oscillation (ENSO) phenomenon was in a neutral phase,
therefore, any prior La Niña influences over summer progressively reduced as the new
season advanced. This helps explain why the season progressively changed from
warmer anomalies to a normal pattern, even though the early cold burst in April was
exceptionally intense. The Southern Annular Mode (SAM) has been variable as
expected, but with a shift towards the negative phase. This helps explain the more
unsettled atmosphere compared to summer. An anomalous area of low pressure
southwest of the country formed as a consequence, leading to slightly windier
conditions than average for the entire region.

Climate outlook for winter 2018
The ENSO phenomenon is expected to remain neutral during winter (i.e., neither El
Niño nor La Niña in the Equatorial Pacific). The local sea surface temperatures are now
close to normal range around New Zealand, but remain anomalously warm to the east
and southeast of the country. This pattern is statistically associated with above normal
rainfall and soil moisture, particularly in the eastern part of the Wairarapa. As a result,
we expect a winter with near normal temperatures and normal to above rainfall, with
increased probability of significant easterly rainfall events.

Live regional climate maps (updated daily): Real time climate maps for regional
rainfall and soil moisture (updated daily) are provided online from GWRC’s
environmental data webpage (graphs.gw.govt.nz/#dailyClimateMaps)
Contents

Contents
Overview                                                                     i
Autumn 2018                                                                  i
Climate drivers                                                              i
Climate outlook for winter 2018                                              i

1.      Climate drivers                                                     1
1.1     El Niño – Southern Oscillation (ENSO)                               1
1.2     Sea Surface Temperature anomalies                                   1
1.3     Southern Annular Mode (SAM)                                         2

2.      What is the data showing?                                            4
2.1     Regional temperature                                                 4
2.2     Regional wind                                                        5
2.3     Regional soil moisture                                               5
2.4     Regional rainfall                                                    7
2.5     Climate change and variability indicators                            8
2.6     Observed rainfall and soil moisture conditions for selected sites   11
2.6.1   Rainfall accumulation for hydrological year (1 June to 31 May)      11
2.6.2   Soil moisture content (since 1 June 2017)                           14

3.      Outlook for winter 2018                                             16

Acknowledgments                                                             17
Climate Drivers

1.    Climate drivers
1.1   El Niño – Southern Oscillation (ENSO)
      La Niña is finished, with atmospheric indicators now showing that the equatorial and
      subtropical wind belts over the Pacific Ocean are consistent with neutral ENSO
      conditions. Most climate models are predicting that ENSO will remain neutral for
      most of winter, but now there is an increased likelihood (50% chance) that a new El
      Niño may form during spring. However, it is still early to know how intense the
      event will be in case it eventuates.

      Figure 1.1: ENSO projections (in green) show ENSO is expected to remain neutral
      during winter. Source: Australian Bureau of Meteorology.

1.2   Sea Surface Temperature anomalies
      The Sea Surface Temperature (SST) anomalies and the total sea ice extent (in white)
      are shown in Figure 1.2 for 7 June 2018. The pattern shows normal or slightly cooler
      than normal waters southwest of New Zealand, and warmer than normal waters to
      the east. The local sea surface temperature anomalies have been progressively
      cooling since the beginning of the year, coinciding with the demise of the La Niña
      conditions that prevailed during summer.

                                                                            PAGE 1 OF 17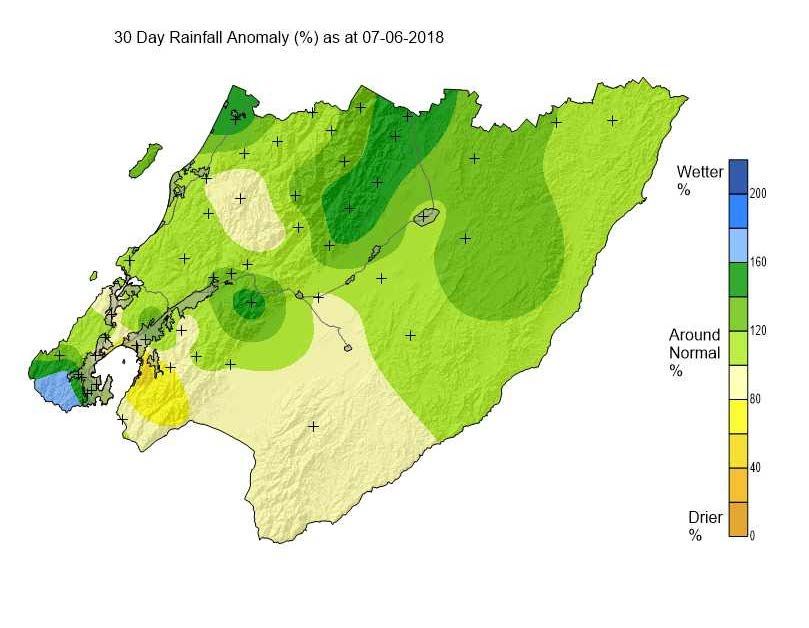
Climate Drivers

      Figure 1.2: Sea surface temperature (SST) anomalies for 7 June 2018. Sea ice coverage is
      shown in white. Waters around New Zealand have cooled significantly, and are now
      around normal. The Equatorial Pacific is in the neutral phase (neutral ENSO). Source:
      NOAA.

1.3   Southern Annular Mode (SAM)
      The SAM is the natural pressure oscillation between mid-latitudes and the Antarctic
      region. Normally positive SAM is associated with high pressures around the North
      Island, keeping the weather stable and dry/cloud-free (especially in summer),
      whereas the opposite is expected when the SAM is in the negative phase. Figure 1.3
      shows the blocking high that formed during spring 2017 moved further away from
      New Zealand, and was replaced by an anomalous area of low pressure to the
      southwest of the country. This pattern explains the progressive change in weather
      patterns becoming more variable, with windier and more unsettled conditions
      leading to an unseasonably early cold outbreak in April

                                                                            PAGE 2 OF 17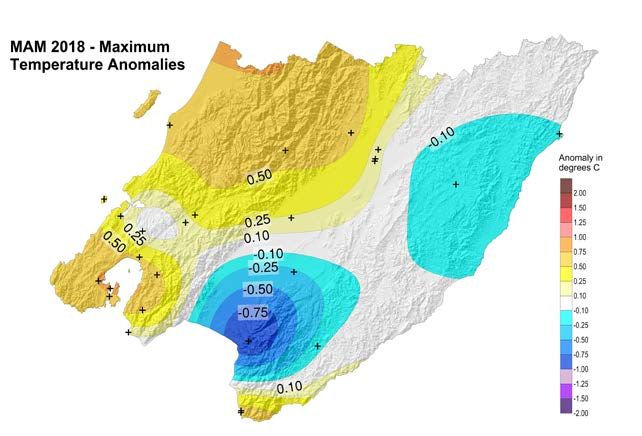
Climate Drivers

     Figure 1.3: Mean sea level pressure anomaly (hPa) for Mar-May 2018. The ‘H’ indicates
     the area of blocking high pressure that has now moved away from New Zealand,
     replaced by an area of lower than average pressure bringing more westerlies over New
     Zealand during autumn. Source: NCEP Reanalysis, map courtesy of NIWA.

                                                                           PAGE 3 OF 17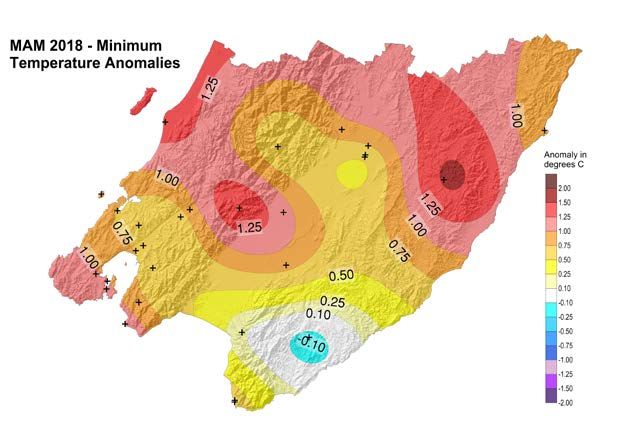
What is the Data Showing?

2.    What is the data showing?
2.1   Regional temperature
      Figure 2.1 shows the minimum and maximum temperature anomalies (against the
      1981-2010 reference period) for the region based on all monitoring sites available
      from GWRC, NIWA, MetService and New Zealand Rural Fire Authority (all
      meteorological stations indicated by dots).

      We can see that warmer than average temperatures prevailed for the most part,
      especially for the minimum temperatures. The excessive cloud cover and humidity
      contributed to this pattern, with fewer clear nights meaning less radiative cooling
      (heat lost into space under clear skies) kept temperatures from dropping. For
      maximum temperatures, parts of the Wairarapa had slightly lower than average
      anomalies, especially southwest of Martinborough towards the Aorangi ranges,
      possibly due to excessive daytime cloud cover over the ranges.

      Figure 2.1: Daily Average Min and Max temperature anomalies for MAM 2018. All
      anomalies calculated against the 1981-2010 reference period. Source: GWRC, using
      station data from the GWRC, NIWA, MetService and NZ Rural Fire Authority networks.

                                                                              PAGE 4 OF 17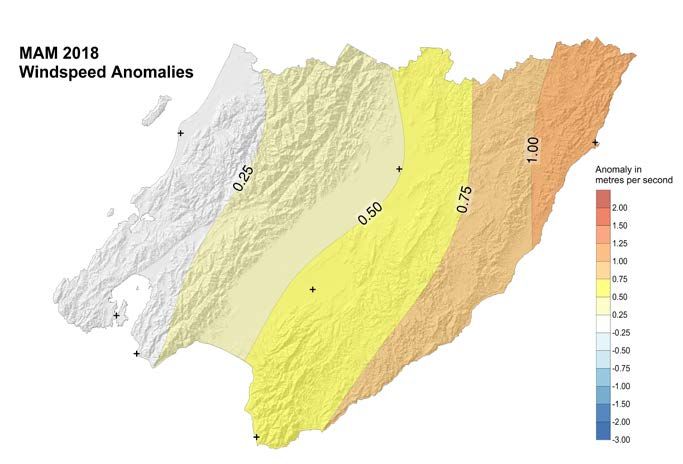
What is the Data Showing?

2.2   Regional wind
      Figure 2.2 shows the mean wind anomalies (against the 1981-2010 reference period)
      based on a smaller network of stations than for temperature. We can see that most of
      the region had a pattern of higher than normal wind speeds, especially in the east, in
      connection with the negative SAM and low pressure anomaly southwest of New
      Zealand discussed above.

      Figure 2.2: Daily mean wind anomalies (in m/s) for MAM 2018. All anomalies calculated
      against the 1981-2010 reference period. Source: GWRC, using station data from NIWA and
      MetService.

2.3   Regional soil moisture
      Figure 2.3 shows the 30 day soil moisture anomaly map for the region as at the
      beginning of winter. Most of the region shows around or above normal soil moisture
      levels – a pattern consistent with positive rainfall anomalies observed over summer
      and autumn.

      Live regional climate maps (updated daily): Real time climate maps for regional
      rainfall and soil moisture (updated daily) are provided online from GWRC’s
      environmental data webpage (graphs.gw.govt.nz/#dailyClimateMaps)

                                                                             PAGE 5 OF 17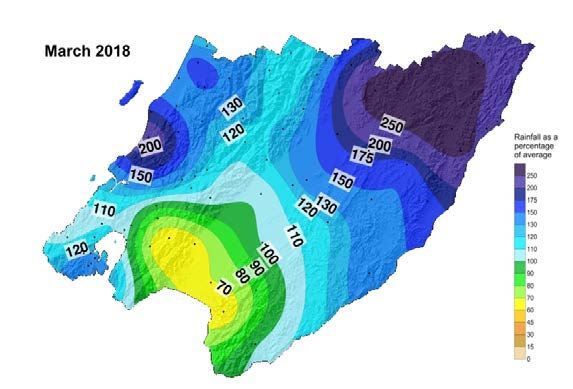
What is the Data Showing?

     Figure 2.3: Thirty day Soil Moisture Anomaly ending 7 June 2018. Moisture levels show
     normal or above normal conditions for most of the region. Source: GWRC, using
     selected Virtual Climate Station Network (VCSN) data kindly provided by NIWA. Note that
     this data is indirectly calculated by modelling and interpolation techniques, and does
     not necessarily reflect the results obtained by direct measurements. This map should
     only be used for a general indication of the spatial variability.

                                                                             PAGE 6 OF 17
What is the Data Showing?
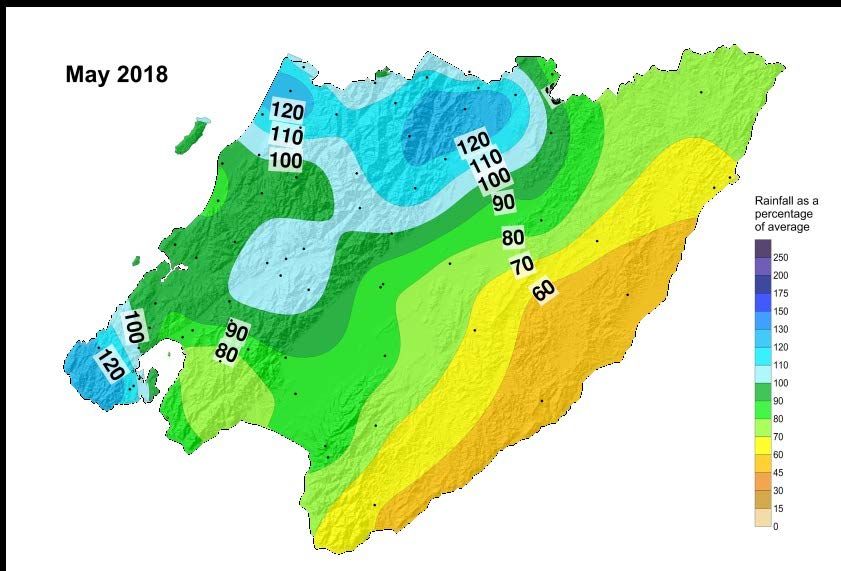
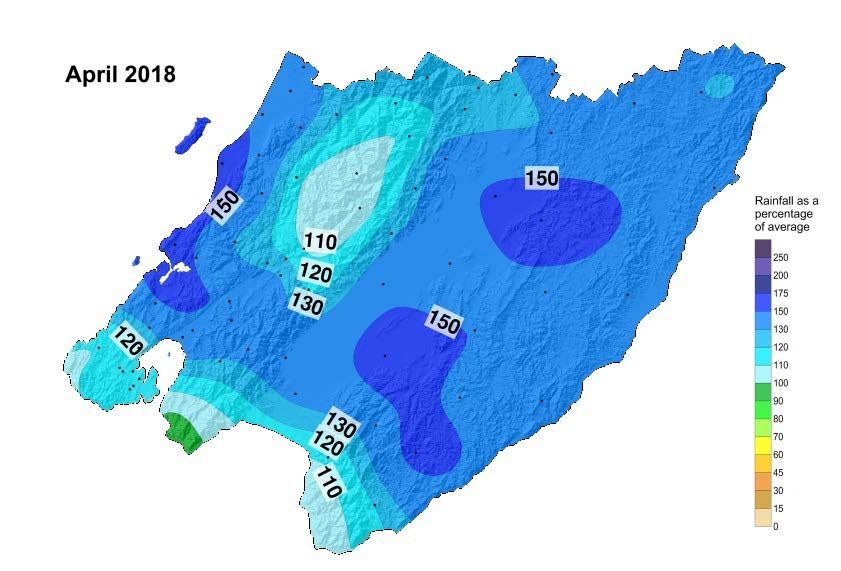
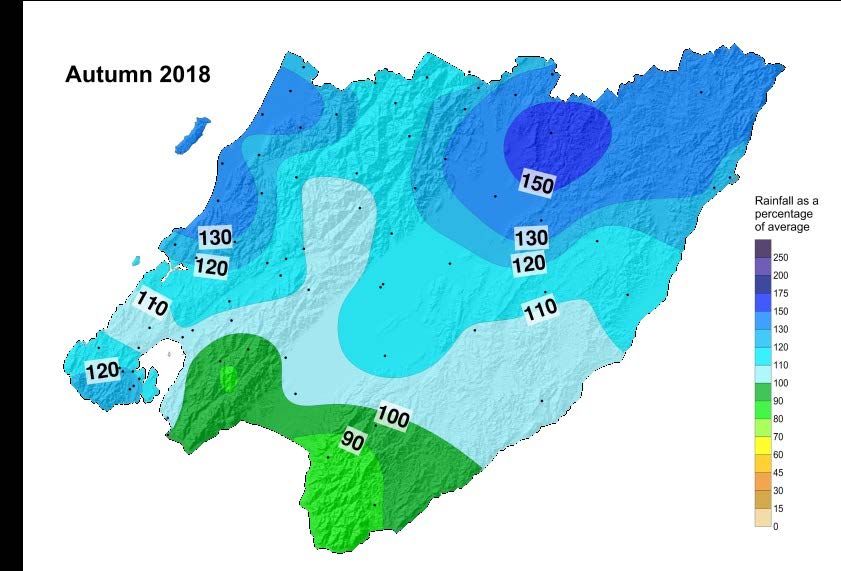
2.4 Regional rainfall
Figure 2.4 shows the regional month by month (and autumn) rainfall expressed as a
percentage of the long-term average. We can see that March and April were very
wet, especially in the Wairarapa, with more normal conditions in May. The overall
autumn pattern was of above average rainfall especially over the northern half of the
region.
March
April
May
MAM
Figure 2.4: Rainfall for March, April, May and MAM 2018 as a percentage of the long-
term average. Rainfall was predominantly above average during the entire season,
except the eastern Wairarapa coast in May. Source: GWRC and NIWA.
PAGE 7 OF 17What is the Data Showing?
2.5 Climate change and variability indicators
The graphs below (Figure 2.5) show summaries of seasonal climate change and
variability for Wellington and the Wairarapa using reference climate stations, chosen
based on length of data record and availability.
The key climate variables shown are: mean temperature, total sunshine hours, mean
wind, total rainfall and total number of rain days (above 0.1 mm). Temperature
measurements go back to the 1910s, allowing for a meaningful analysis of climate
change trends. Most other variables also have long periods of measurement greater
than 50 years, except sunshine hours and wind for the Wairarapa; these are only
available for less than two decades, which is a very short period climatologically
speaking and doesn’t allow for an analysis of trends.
The red and blue bars indicate the extreme years during the entire recorded period.
Red is used for warmer, drier, sunnier and less windy than average (a sense of
extreme hot/dry), and blue is used for colder, wetter, cloudier and windier than
average (a sense of extreme cold/wet). The reference climatological average (1981-
2010) is indicated by a horizontal bar where available.
All maps are grouped together for convenience of style, using the same scale
between Wellington and Wairarapa whenever possible (except for wind which is
much lower over the Wairarapa). The last bar in all graphs is the season covered in
this report; unless there are data missing (in this case a blank space is shown).
An analysis of linear trends associated with climate change is plotted onto the graph
only when the trends are statistically significant at 99% level according to the t-
Student test. To see further nuances and details we invite the reader to use the zoom
function of your browser.
The climate change and variability summary for autumn is:
• Statistically significant trends are seen only for temperature. There is a
significant warming trend of about 1oC per century in both Kelburn and
Masterton over the period 1910-2018;
• Autumn 2018 was warmer than average for both Wellington and the Wairarapa,
proportionally more so for Wellington;
• Sunshine hours were relatively low for both Wellington and Wairarapa during
autumn 2018. Wind was around average, and rainfall and rain days were above
average, more so in Wellington;
PAGE 8 OF 17What is the Data Showing?
PAGE 9 OF 17What is the Data Showing?
Figure 2.5: Climate change and variability graphs for autumn in Wellington and the Wairarapa.
The thick horizontal line shows the 1981-2010 average (when available), and the dashed line shows
the linear trend. Trends are plotted only when statistically significant at 99% confidence level. For all
graphs, the bright red and blue bars show the extreme min and max values for each time series (red for
warm, dry, sunny and calm and blue for cool, wet, cloudy and windy). The key variables shown are:
mean temperature, total number of sunshine hours, mean wind speed, total rainfall and total number of
rain days (>0.1mm). Missing bars means that no reliable mean seasonal data was available for that
particular year. The last bar of each graph shows the last available data for the currently analysed
season, unless there are missing data.
PAGE 10 OF 17What is the Data Showing?
2.6 Observed rainfall and soil moisture conditions for selected sites
Figure 2.6 shows the location of selected GWRC rainfall and soil moisture
monitoring sites. Plots of accumulated rainfall and soil moisture trends are provided
in the following pages.
Figure 2.6: Map of GWRC rainfall and soil moisture monitoring locations
2.6.1 Rainfall accumulation for hydrological year (1 June to 31 May)
The following rainfall plots show total rainfall accumulation (mm) for the
hydrological year at several locations. For comparative purposes, cumulative plots
for selected historic years with notably dry summers have been included as well as
the site average.
Many of the GWRC telemetered rain gauge sites in the lower lying parts of the
Wairarapa (i.e., not Tararua Range gauges installed for flood warning purposes)
have only been operating since the late 1990s so the period of data presented is
limited to the last two decades. For each historical record plotted, an indication of
ENSO climate state (El Niño, La Niña or neutral) at that time is also given. GWRC
does not operate a rain gauge in the southern-most parts of the Wairarapa Valley that
is suitable for presenting data in this report. This means that we cannot be confident
that the rainfall patterns seen elsewhere extend to this part of the region other than
the satellite and VCN data already presented.
Overall, rainfall accumulations for the year starting in June 2017 (labelled 2017 on
the plots) ended about or above average for most of the monitored sites. For most
Wairarapa and Hut Valley sites, the year started with very low accumulations, which
were replenished during late summer and autumn with copious amounts of rain
concentrated in a few events. The exception was Kaitoke Headworks and
Waikoukou at Longbush, which never fell substantially below average rainfall
during the period. For the Kāpiti Coast and Wellington, the accumulation has been
predominately above average for most of the hydrological year, falling only slightly
PAGE 11 OF 17What is the Data Showing?
below average at the start of summer. For these western sites the total accumulation
for the hydrological year ended up being significantly above average, especially for
the Kāpiti Coast.
Kāpiti Coast and Southwest (Wellington city)
1600 1600
Otaki Depot (Coastal Plain) Karori Sanctuary (Wellington City)
1400 1400
1200 1200
Cummulative Rainfall (mm)
Cummulative Rainfall (mm)
1000 1000
800 800
600 600
1982 (El Nino)
1997 (El Nino)
1997 (El Nino)
400 2002 (El Nino) 400
2007 (La Nina) 2007 (La Nina)
2012 (Neutral) 2012 (Neutral)
200 200 2014 (Neutral)
2014 (Neutral)
2015 (El Nino) 2015 (El Nino)
0 2016 (Neutral) 0 2016 (Neutral)
Mean (1990-2015) Mean (1990-2015)
-200 2017 (Neutral) -200 2017 (Neutral)
PAGE 12 OF 17What is the Data Showing?
Hutt Valley and Tararua Range
3000 8000
Kaitoke Headworks (Hutt River catchment) Tararua Range (Angle Knob)
7000
2500
6000
2000
5000
Cummulative mm
Cummulative mm
1500 4000
1997 (El Nino) 3000 1997 (El Nino)
1000
2002 (El Nino) 2002 (El Nino)
2007 (La Nina) 2000 2007 (La Nina)
500 2012 (Neutral) 2012 (Neutral)
2014 (Neutral) 1000 2014 (Neutral)
2015 (El Nino) 2015 (El Nino)
0 2016 (Neutral)
2016 (Neutral) 0
Mean (1990-2015) Mean (1990-2015)
-500 2017 (Neutral) -1000 2017 (Neutral)
Wairarapa
1800 1200
Waiorongomai at Matthews Tauherenikau at Alloa/Racecourse
1600
1000
1400
1200 800
Cummulative rainfall (mm)
Cummulative rainfall (mm)
1000
600
800
400
600 2002 (El Nino)
2012 (Neutral)
2007 (La Nina)
400 2013 (Neutral) 200 2012 (Neutral)
2014 (Neutral)
2014 (Neutral)
200 2015 (El Nino) 2015 (El Nino)
2016 (Neutral) 0
0 2016 (Neutral)
Mean (1990-2015) Mean (1990-2015)
-200 2017 (Neutral) -200 2017 (Neutral)
1000 1400
Masterton (Wairarapa College) Whareama at Tanawa Hut
900
1200
800
700 1000
Cummulative rainfall (mm)
Cummulative rainfall (mm)
600 800
500
600
400 1997 (El Nino)
2002 (La Nina)
400 2002 (El Nino)
300 2007 (La Nina)
2007 (La Nina)
2012 (Neutral)
200 2012 (Neutral)
2014 (Neutral) 200 2014 (Neutral)
100 2015 (El Nino) 2015 (El Nino)
2016 (Neutral) 0 2016 (Neutral)
0
Mean (1990-2015) Mean (1990-2015)
-100 2017 (Neutral) -200 2017 (Neutral)
PAGE 13 OF 17What is the Data Showing?
1200
Waikoukou at Longbush
1000
800
Cummulative rainfall (mm)
600
400
2007 (La Nina)
2012 (Neutral)
200 2013 (Neutral)
2014 (Neutral)
2015 (El Nino)
0
2016 (Neutral)
Mean (1990-2015)
-200 2017 (Neutral)
Live cumulative plots (updated daily): Real time graphs for cumulative rainfall are
available online from GWRC’s environmental data webpage (http://graphs.gw.govt.nz/).
Select a rainfall monitoring site, then choose Cumulative Historic from the Interval selector,
then optionally change the period from the last 12 months to the hydrological year (July –
June) as required.
2.6.2 Soil moisture content (since 1 June 2017)
The following soil moisture graphs show the seven day rolling average soil moisture
content (%) since 1 June 2017. This is plotted over an envelope of the range of historic
recorded soil moisture data (and the median) at the site to provide an indication of how
the current soil moisture compares with that for a similar period in past years.
While the soil moisture plots are useful for tracking change within the current season
and comparing relative differences between years, the absolute moisture content (%)
for any given site and date should not be considered accurate. Many of the GWRC soil
moisture sites have not yet been fully calibrated to provide accurate absolute measures
of soil moisture.
The soil moisture behaviour at all sites has been one of above average levels for most
of the period, except a short low spike at the beginning of summer, especially in the
Hutt Valley. For the southeast Wairarapa hills (Kaikoukou at Longbush), moisture
levels remained average or above even during the dry spell in December.
PAGE 14 OF 17What is the Data Showing?
(a) Wairarapa
45 70
Southeast Wairarapa hills (Waikoukou) Northeastern Wairarapa hills (Tanawa Hut)
40
60
Soil Moisture Content (%) - 7 day average)
35
50
30
25 40
20 30
15
20
10
Historic range (min to max)
10 20th to 80th percentile
5 Median (2003-2016)
2017/18
0 0
70 35
Masterton (Wairarapa College) Tauherenikau Racecourse
60 30
Soil Moisture Content (%) - 7 day average)
50 25
40 20
30 15
10
20
Historic range (min to max)
Historic range (min to max) 5 20th to 80th percentile
10 20th to 80th percentile Median (2013-2016)
Median (2002-2016) 2017/18
2017/18 0
0
Jun Jul Aug Sep Oct Nov Dec Jan Feb Mar Apr May
(b) Hutt Valley
40
Upper Hutt (Savage Park)
Live soil moisture plots (updated daily):
Soil Moisture Content (%) - 7 day average)
35
Real time “envelope” graphs for soil moisture
30
are available online from GWRC’s
environmental data webpage
(http://graphs.gw.govt.nz/). Select a soil
25
moisture monitoring site, then choose
Envelope Graph from the Interval selector,
20 then optionally change the period from the last
12 months to the hydrological year (July –
Historic range (min to max)
15 20th to 80th percentile
June) as required.
Median (2003-2016)
2017/18
10
PAGE 15 OF 17Outlook for Winter 2018
3. Outlook for winter 2018
• Neutral Equatorial Pacific, but chance of El Niño forming later in the year;
• Sea Surface Temperature cooling off to normal around New Zealand;
• Frequent south-easterlies in June, changing to a more south-westerly regime
later in the season;
• Long mild and settled periods likely in the west, interrupted by vigorous cold
outbreaks later in the season;
• Rainfall: average to above, heavy easterly events likely;
• Temperatures: normal in the west, normal to below in the Wairarapa;
• Wet soils with fewer frosts than average, but increasing frost risk later in the
season
Whaitua* Variables Climate outlook for winter 2018
Temperature: About average, long mild periods interrupted by abrupt
Wellington cold spells later in the season.
Harbour & Hutt
Valley
Rainfall: Average to above.
Temperature: Average to above, long mild periods interrupted by
Te Awarua-o- abrupt cold spells later in the season.
Porirua
Rainfall: Average to above.
Temperature: Average to above, long mild periods interrupted by
abrupt cold spells later in the season.
Kāpiti Coast
Rainfall: Average to above.
Temperature: Average to below, turning colder later in the season
with abrupt cold spells.
Ruamāhanga
Rainfall: Average to above.
Temperature: Average to below, turning colder later in the season
with abrupt cold spells.
Wairarapa Coast
Rainfall: Average to above.
*See http://www.gw.govt.nz/assets/Environment-Management/Whaitua/whaituamap3.JPG for whaitua
catchments
Note: Statistical rainfall projections for central Wairarapa via climate analogues is
not shown for this report due to the lack of reliable climate analogues for the current
configuration of the climate drivers.
PAGE 16 OF 17Acknowledgments
We would like to thank NIWA for providing selected VCSN data points for the calculation of
the regional soil moisture map and for supplementing the rainfall percentage maps in data
sparse areas.
Plot your own maps in real time (past, current and
future climate change prediction)
GWRC Climate mapping tools online
Daily Climate Maps
For real time daily climate anomaly maps (rainfall and soil moisture), go to:
http://graphs.gw.govt.nz/#dailyClimateMaps
Interactive climate change maps
For interactive climate change maps, go to:
1. GIS version
https://mapping1.gw.govt.nz/gw/ClimateChange/
2. Story map version
https://mapping1.gw.govt.nz/GW/ClimateChange_StoryMap/#
PAGE 17 OF 17You can also read


