Climate and Water Resources Summary for the Wellington Region - Summer 2020 summary Autumn 2020 outlook - Greater Wellington Regional
←
→
Page content transcription
If your browser does not render page correctly, please read the page content below
Climate and Water Resources Summary
       for the Wellington Region

            Summer 2020 summary
             Autumn 2020 outlook

Release date: 2 April 2020

Environmental Science Department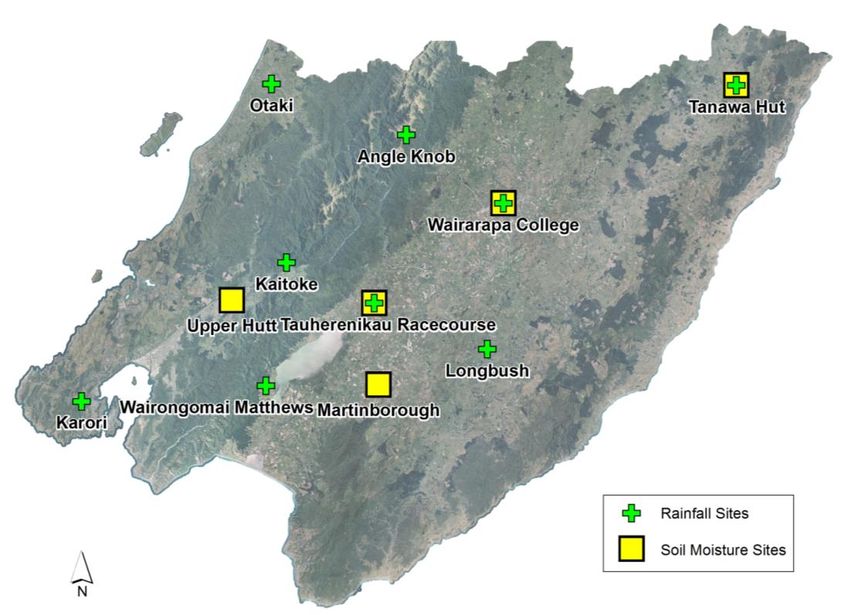
A prominent feature of the summer 2020 was the ongoing dryness, as seen in this
photo of the Wairarapa taken on 27th February. The entire North Island, and half of
the South Island, were extremely dry. The large spatial extent of the event, and the
fact that the ‘climate influencers’ are not particularly active, are a stark reminder of
the effects of climate change on our landscape. Climate projections for mid-century
show that even if we contain global warming under 1.5-2 degrees, the average
summer could be as dry as this year. This suggests that the current conditions may, in
fact, become the new normal by 2040.

DISCLAIMER
This report has been prepared by Environmental Science staff of Greater Wellington Regional Council (GWRC) and as
such does not constitute Council policy.
In preparing this report, the authors have used the best currently available data and have exercised all reasonable skill
and care in presenting and interpreting these data. Nevertheless, GWRC does not accept any liability, whether direct,
indirect, or consequential, arising out of the provision of the data and associated information within this report.
Furthermore, as GWRC endeavours to continuously improve data quality, amendments to data included in, or used in
the preparation of, this report may occur without notice at any time.
GWRC requests that if excerpts or inferences are drawn from this report for further use, due care should be taken to
ensure the appropriate context is preserved and is accurately reflected and referenced in subsequent written or verbal
communications. Any use of the data and information enclosed in this report, for example, by inclusion in a subsequent
report or media release, should be accompanied by an acknowledgement of the source.
Contents

Overview

Summer 2020
Summer 2020 was quite remarkable in some ways, and unremarkable in others. It was
once again a season of contrasts, with a strong westerly flow keeping the weather dry
and cool for the most part, even though the average seasonal temperatures ended up
ranging from normal around the coastal areas to above normal for the Wairarapa. The
most prominent feature was the rainfall, which started above average in December and
was followed by less than 20% the monthly average for both January and February in
parts of the Wairarapa. This dry spell was associated with a large scale drought event
affecting the entire North Island and parts of the South Island, with Northland being the
worst hit area. MPI eventually declared the drought a large scale adverse event on 12 th
March, which was the first time this classification was given since 2013.

Climate drivers
The climate drivers (influencers) were mostly neutral throughout summer, making it
difficult to explain the reasons for the drought. As discussed in our previous reports, the
phenomenon known as Southern Stratospheric Warming had a significant impact
throughout spring, promoting a much more active than normal westerly wind flow
around mid-latitudes. This flow influenced most of the summer, helping to shelter the
country from northeasterly flows which would have helped to provide humid flows for
rainfall and thunderstorms inland. The situation only slowly started to revert back to
normal in March, culminating with a remarkable rainfall event at the end of the month
in the Wairarapa, with about 250mm recorded on the east coast. This extreme event will
be discussed in our next report.

Climate outlook for autumn 2020
The current atmospheric set up points to neutral climate influencers, without any
phenomenon in particular influencing the long-term outlook either way, except for the
ongoing effects of global warming. As such, we expect the remainder of autumn and
beginning of winter to have temperatures ranging between normal and above normal.
Rainfall should be subject to large month to month variations with high chance of
further extreme rainfall events on both the east and west coasts. There is low confidence
for the total seasonal rainfall accumulation.

Live regional climate maps (updated daily): Daily updated climate maps of
regional rainfall and soil moisture are provided on GWRC’s environmental data
webpage (graphs.gw.govt.nz/#dailyClimateMaps).
Contents

Contents
Overview                                                                     i

Summer 2020                                                                  i
Climate drivers                                                              i
Climate outlook for autumn 2020                                              i

1.      Climate drivers                                                     1
1.1     El Niño – Southern Oscillation (ENSO)                               1
1.2     Sea Surface Temperature anomalies                                   1
1.3     Southern Annular Mode (SAM)                                         2

2.      What is the data showing?                                            4
2.1     Regional temperature                                                 4
2.2     Regional wind                                                        5
2.3     Regional soil moisture                                               6
2.4     Regional rainfall                                                    7
2.5     Climate change and variability indicators                            8
2.6     Observed rainfall and soil moisture conditions for selected sites   11
2.6.1   Rainfall accumulation for hydrological year (1 June to 31 May)      11
2.6.2   Soil moisture content (since 1 June 2019)                           14

3.      Outlook for autumn and early winter 2020                            17

Acknowledgments                                                             18

Online resources                                                            19
Climate Drivers

1.    Climate drivers
1.1   El Niño – Southern Oscillation (ENSO)
      The ensemble projections of the Australian climate model below show that the
      ENSO phenomenon is predicted to remain neutral over the next few months.
      Therefore, ENSO should not be a significant player in the unfolding autumn climate
      pattern.

      Figure 1.1: Averaged modelled projections (in green) show ENSO is expected to remain
      in a neutral phase for the time being. Source: Australian Bureau of Meteorology.

1.2   Sea Surface Temperature anomalies
      The Sea Surface Temperature (SST) anomalies and the total sea ice extent (in white)
      are shown in Figure 1.2 as of 9 March 2020. The pattern shows warmer than normal
      waters north of New Zealand and colder than normal south of the country, with a mixed
      neutral signal in the Equatorial Pacific Ocean.

      The sea ice cover around Antarctica was below normal, but recovered somehow in
      February (even though we can see patches of very little ice immediately south of New
      Zealand).

                                                                           PAGE 1 OF 20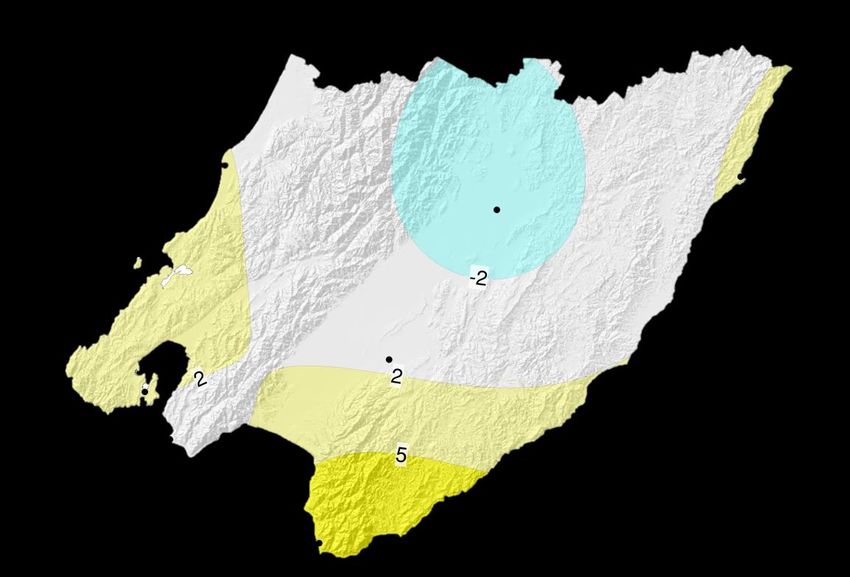
Climate Drivers

      Figure 1.2: Sea surface temperature (SST) anomalies as of 9 March 2020. Sea ice coverage
      is shown in white. Waters around New Zealand are warmer than average in the Tasman
      Sea and north of the country, and cooler than average to the south. The Equatorial Pacific
      (ENSO) is currently neutral, and is expected to remain so over the next few months.
      Source: NOAA.

1.3   Southern Annular Mode (SAM)
      The SAM is the natural pressure oscillation between mid-latitudes and the Antarctic
      region. Normally, positive SAM is associated with high pressures around the North
      Island, keeping the weather stable and dry/cloud-free (especially in summer),
      whereas the opposite is expected when the SAM is in the negative phase.

      Figure 1.3 shows that the summer pattern was characterised by high pressure
      anomalies north of New Zealand, and low pressure south the country. This set up has
      contributed to strengthen the westerly flow, shifting and confining the rain-bearing
      systems to the southern part of the South Island. For the North Island, the close
      proximity of the high pressure cell helps explain the greater intensity of the drought
      around Northland, even though the SAM was in fact mostly negative, and tending
      neutral towards the end of the summer.

      As a reminder, the SAM has been predominantly negative since the onset of the
      enhanced westerly pattern later in spring, in connection to the Sudden Stratospheric
      Warming discussed in previous reports. It is difficult to explain the overall drought
      development on the North Island based on the traditional climate influencers alone,
      and it is worth noting that the dry summer pattern is consistent with climate change
      projections.

                                                                              PAGE 2 OF 20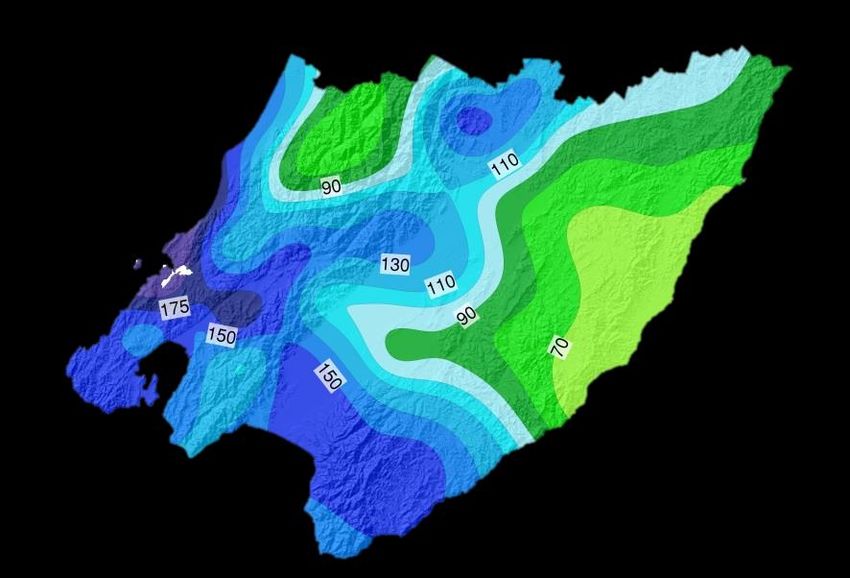
Climate Drivers

     Figure 1.3: Mean sea level pressure anomaly (hPa) for summer (December, January,
     February) 2020. The ‘H’ indicates the position of the blocking high close to Northland
     (explaining the dry pattern), and the ‘L’ indicates the average low pressure southwest
     of New Zealand. This pattern was associated with the negative phase of the Southern
     Annular Mode, which tended neutral later in the season. Source: NCEP Reanalysis.

                                                                             PAGE 3 OF 20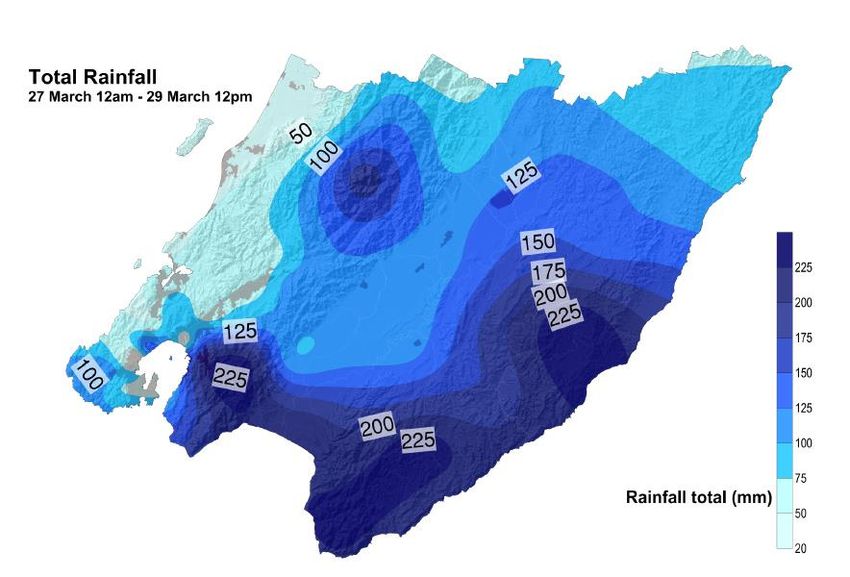
2. What is the data showing?
2.1 Regional temperature
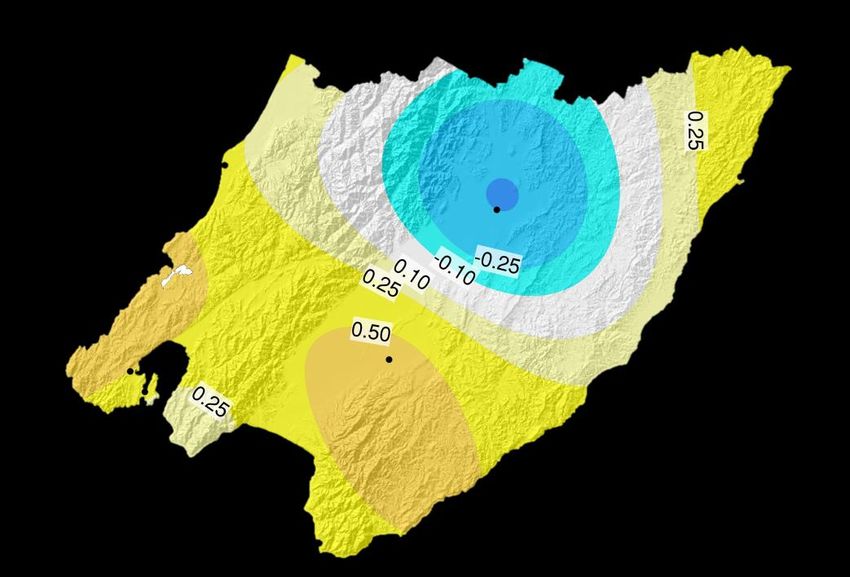
Figure 2.1 shows the seasonal minimum and maximum temperature anomalies
(against the 1981-2010 reference period) for the region based on all monitoring sites
available from GWRC, NIWA, MetService and New Zealand Rural Fire Authority
(all meteorological stations indicated by dots).
Slightly warmer than average temperatures continued for the region, especially for
maximum temperatures in the Wairarapa. Masterton continued to experience cooler
than average nighttime temperatures, also highlighting the influence of the dry
conditions facilitating the radiative cooling at night.
DJF 2020 – Minimum
Temperature Anomalies
Figure 2.1: Daily Average
Minimum and Maximum
temperature anomalies for
DJF 2020.
All anomalies calculated
against the 1981-2010
reference period.
Source: GWRC, using station
data from GWRC, NIWA,
MetService and NZ Rural Fire
Authority networks.
DJF 2020 – Maximum
Temperature Anomalies
PAGE 4 OF 20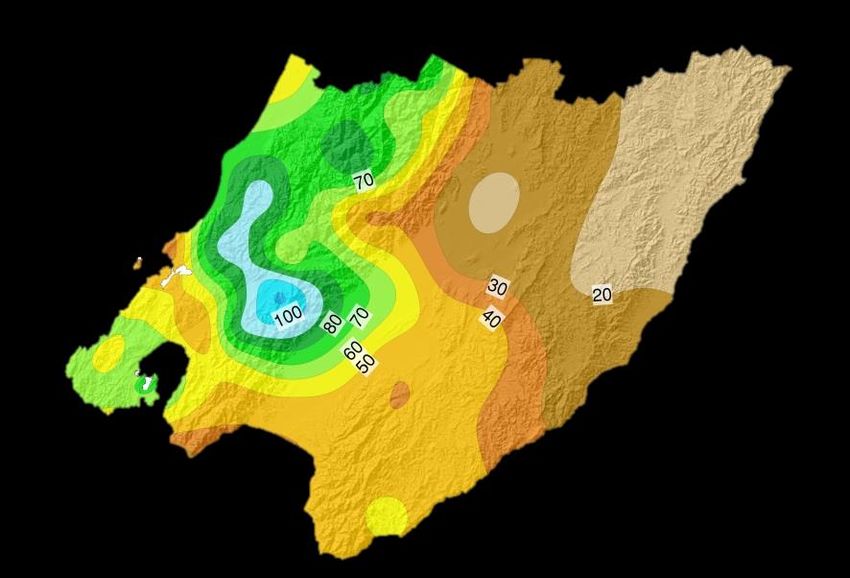
2.2   Regional wind
      Figure 2.2 shows the mean seasonal wind anomalies (against the 1981-2010
      reference period) based on a smaller network of stations than for temperature. The
      region experienced slightly higher than normal wind speeds near the coastal areas
      (between 2 and 10% above average), as a result of the increased westerly flow
      discussed earlier.

        DJF 2020
        Windspeed Anomalies

      Figure 2.2: Daily mean wind anomalies (as percentage departure from the average) for
      DJF 2020. All anomalies calculated against the 1981-2010 reference period.
      Source: GWRC, using station data from NIWA and MetService.

                                                                            PAGE 5 OF 20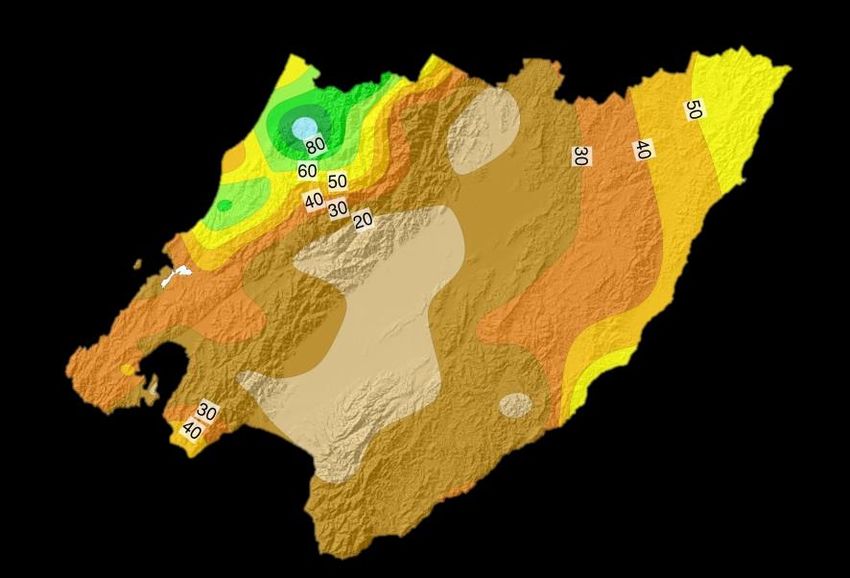
2.3   Regional soil moisture
      Figure 2.3 shows that the soil moisture levels were below normal for the entire
      region at the end of summer. This pattern reflected the vigorous westerly regime that
      dominated the atmospheric circulation, in connection to the negative SAM discussed
      before.

      Live regional climate maps (updated daily): Climate maps for regional rainfall
      and soil moisture (updated daily) are provided online at GWRC’s environmental
      data webpage (graphs.gw.govt.nz/#dailyClimateMaps).

      Figure 2.3: 30 Day soil moisture anomaly as at 8th March 2020. The whole region had
      below normal soil moisture. Source: GWRC, using selected Virtual Climate Station Network
      (VCSN) data kindly provided by NIWA. Note that this data is indirectly calculated by
      modelling and interpolation techniques, and does not necessarily reflect the results
      obtained by direct measurements. This map only provides a general indication of the
      spatial variability.

                                                                               PAGE 6 OF 20
2.4 Regional rainfall
Figure 2.4 shows the regional monthly winter rainfall expressed as a percentage of
the long-term average. December was the wettest month compared to normal, with
areas in the south and west well above average. Rainfall in January and February
was below average across the entire region with more extreme dry conditions
experienced to the east.
Rainfall over the entire summer season ranged from 50 percent of average in the east
to near normal in parts of the west coast.
December
January
February
Summer (DJF)
Figure 2.4: Rainfall for December (upper left), January (upper right), February (lower left)
and Summer-DJF (lower right) 2019-20 as a percentage of the long-term average. Summer
as a whole had a pattern of near average rainfall in the west to below average in the
Wairarapa. Source: GWRC.
PAGE 7 OF 202.5 Climate change and variability indicators
The graphs below (Figure 2.5) show summaries of seasonal climate change and
variability for Wellington and the Wairarapa using reference climate stations, chosen
based on length of data record and availability.
The key climate variables shown are: mean temperature, total sunshine hours, mean
wind, total rainfall and total number of rain days (above 0.1 mm). Temperature
measurements go back to the 1910s, allowing for a meaningful analysis of climate
change trends. Most other variables also have long periods of measurement greater
than 50 years, except sunshine hours and wind for the Wairarapa; these are only
available for less than two decades, which is a very short period climatologically and
doesn’t allow for an analysis of trends.
The red and blue bars show the extreme years of the entire measurement period. Red
indicates seasons that were warmer, drier, sunnier and less windy than average (i.e.,
extreme hot/dry), and blue indicates seasons that were colder, wetter, cloudier and
windier than average (i.e., extreme cold/wet). The reference climatological average
(1981-2010) is shown by a horizontal bar where available. The maps use the same
scale except for wind which is much lower over the Wairarapa.
An analysis of linear trends associated with climate change is plotted onto the graph
only when the trends are statistically significant at 99% level according to the
Student’s t-test.
The climate change and variability summary for summer is:
Statistically significant trends are seen only for temperature (Wellington and
Masterton) and wind (Wellington), meaning summer is getting warmer and less
windy in general. The long-term warming is about one degree per century in
both Wellington and Masterton;
Summer 2020 temperatures were above average for both Wellington and the
Wairarapa, more so for Masterton;
Sunshine hours were well slightly below average for Wellington (data not
available for Martinborough, graph shown for data ending in 2019);
Wind speed was slightly above average for Wellington;
Rainfall was below average in Wellington and well below average in the
Wairarapa;
Total rain days was about normal in Wellington and well below average in the
Wairarapa.
PAGE 8 OF 20PAGE 9 OF 20
Figure 2.5: Climate change and variability graphs for summer in Wellington and the Wairarapa.
The thick horizontal line shows the 1981-2010 average (where available), and the dashed line shows
the linear trend. Trends are plotted only when statistically significant at 99% confidence level. For all
graphs, the bright red and blue bars show the extreme min and max values for each time series (red for
warm, dry, sunny and calm and blue for cool, wet, cloudy and windy). The key variables shown are:
mean temperature, total number of sunshine hours, mean wind speed, total rainfall and total number of
rain days (>0.1mm). Missing bars means that no reliable mean seasonal data was available for that
particular year. The last bar of each graph shows the last available data for the currently analysed
season, unless there are missing data.

                                                                                       PAGE 10 OF 20
2.6 Observed rainfall and soil moisture conditions for selected sites
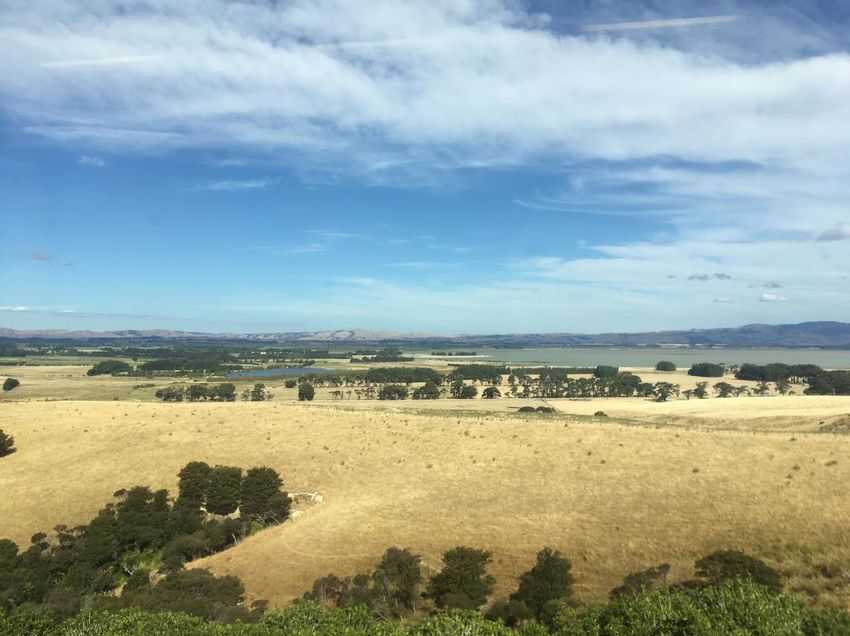
Figure 2.6 shows the location of selected GWRC rainfall and soil moisture
monitoring sites. Plots of accumulated rainfall and soil moisture trends are provided
in the following pages.
Figure 2.6: Map of GWRC rainfall and soil moisture monitoring locations
2.6.1 Rainfall accumulation for hydrological year (1 June to 31 May)
The following rainfall plots show total rainfall accumulation (mm) for the
hydrological year at several locations. For comparative purposes, cumulative plots
for selected historic years with notably dry summers have been included as well as
the site average.
Many of the GWRC telemetered rain gauge sites in the lower lying parts of the
Wairarapa have only been operating since the late 1990s so the period of data
presented is limited to the last two decades. For each historical record plotted, an
indication of ENSO climate state (El Niño, La Niña or neutral) at that time is also
given.
GWRC does not operate a rain gauge in the southern-most parts of the Wairarapa
Valley that is suitable for presenting data in this report. This means that we cannot
be confident that the rainfall patterns seen elsewhere extend to this part of the region
other than the VCSN data already presented.
PAGE 11 OF 20Overall, total rainfall accumulations since June have been about average over the
Kāpiti Coast, Southwest and Hutt catchment parts of the region.
Rainfall accumulation at sites across the Wairarapa have flattened off markedly
since the end of December. A one in a 50-year extreme rainfall event (about 250
mm) brought significant recovery to the eastern Wairarapa late in March. This event
will be discussed in our next report.
Kāpiti Coast and Southwest (Wellington city)
1400 1600
Otaki Depot (Coastal Plain) Karori Sanctuary (Wellington City)
1200 1400
1200
Cummulative Rainfall (mm)
1000
1000
800
800
600
600
1982/83 (El Nino)
400 1997/98 (El Nino)
2002/03 (El Nino) 1997/98 (El Nino)
400 2007/08 (La Nina)
2007/08 (La Nina)
200 2014/15 (Neutral) 2014/15 (Neutral)
2015/16 (El Nino) 200 2015/16 (El Nino)
2016/17 (Neutral) 2016/17 (Neutral)
0 2017/18 (Neutral) 0 2017/18 (Neutral)
Mean (1990-2017) Mean (1990-2017)
-200 2019/20 -200 2019/20
PAGE 12 OF 20Hutt Valley and the Tararua Range
3000 8000
Kaitoke Headworks (Hutt River catchment) Tararua Range (Angle Knob)
7000
2500
6000
2000
5000
Cummulative mm
1500 4000
1997/98 (El Nino)
1000 1997/98 (El Nino) 3000
2002/03 (El Nino)
2002/03 (El Nino)
2007/08 (La Nina)
2007/08 (La Nina) 2000
500 2014/15 (Neutral)
2014/15 (Neutral)
2015/16 (El Nino)
2015/16 (El Nino) 1000
2016/17 (Neutral)
2016/17 (Neutral)
0 2017/18 (Neutral)
2017/18 (Neutral) 0
Mean (1990-2017) Mean (1990-2017)
-500 2019/20 -1000 2019/20
Wairarapa
1800 1200
Waiorongomai at Matthews Tauherenikau at Alloa/Racecourse
1600
1000
1400
1200 800
Cummulative mm
1000
600
800
400 2002/03 (El Nino)
600 2013/14 (Neutral) 2007/08 (La Nina)
2014/15 (Neutral) 2017/18 (Neutral)
400 200
2015/16 (El Nino) 2014/15 (Neutral)
200 2016/17 (Neutral) 2015/16 (El Nino)
2017/18 (Neutral) 0 2016/17 (Neutral)
0 Mean (2009-2017) Mean (1990-2017)
2019/20 2019/20
-200 -200
1000 1400
Masterton (Wairarapa College) Whareama at Tanawa Hut
900
1200
800
1000
700
Cummulative rainfall (mm)
600 800
500
600
400 1997/98 (El Nino)
2002/03 (La Nina)
400 2002/03 (El Nino)
300 2007/08 (La Nina) 2007/08 (La Nina)
2014/15 (Neutral) 2014/15 (Neutral)
200
2015/16 (El Nino) 200 2015/16 (El Nino)
100 2016/17 (Neutral) 2016/17 (Neutral)
2017/18 (Neutral) 0 2017/18 (Neutral)
0
Mean (2002-2017) Mean (1992-2017)
-100 2019/20 -200 2019/20
PAGE 13 OF 201200
Waikoukou at Longbush
1000
800
Cummulative rainfall (mm)
600
400
2007/08 (La Nina)
2013/14 (Neutral)
200 2014/15 (Neutral)
2015/16 (El Nino)
2016/17 (Neutral)
0
2017/18 (Neutral)
Mean (1990-2017)
-200 2019/20
Live cumulative plots (updated daily): Real-time graphs for cumulative rainfall
are available online at GWRC’s environmental data webpage
(http://graphs.gw.govt.nz/). Select a rainfall monitoring site, then choose Cumulative
Historic from the Interval selector, then optionally change the period from the last
12 months to the hydrological year (July – June) as required.
2.6.2 Soil moisture content (since 1 June 2019)
The following soil moisture graphs show the seven day rolling average soil moisture
content (%) since 1 June 2019. This is plotted over an envelope of the range of historic
recorded data (and the median) at the site to provide an indication of how the current
soil moisture compares with that for a similar period in past years.
While the soil moisture plots are useful for tracking change within the current season
and comparing relative differences between years, the absolute moisture content (%)
for any given site and date should not be considered accurate. Many of the GWRC soil
moisture sites have not yet been fully calibrated to provide accurate absolute measures
of soil moisture.
Soil moisture levels were tracking at around average levels until the end of December
2019. Masterton and Martinborough soil moisture reached very low levels towards the
end of summer.
PAGE 14 OF 20(a) Wairarapa
70 70
Northeastern Wairarapa hills (Tanawa Hut) Masterton (Wairarapa College)
60 60
Soil Moisture Content (%) - 7 day average)
50 50
40 40
30 30
20 20
Historic range (min to max) Historic range (min to max)
10 20th to 80th percentile 10 20th to 80th percentile
Median (2003-2017) Median (2002-2017)
2019/20 2019/20
0 0
35 60
Tauherenikau Racecourse Martinborough (NIWA)
30
50
Soil Moisture Content (%) - 7 day average)
25
40
20
30
15
20
10
Historic range (min to max) Historic range (min to max)
5 20th to 80th percentile 10
20th to 80th percentile
Median (2003-2017) Median (2002-2017)
2019/20 2019/20
0 0
40
Upper Hutt (Savage Park) (b) Hutt Valley
Soil Moisture Content (%) - 7 day average)
35 Live soil moisture plots (updated daily):
Real-time “envelope” graphs for soil moisture
30 are available online at GWRC’s environmental
data webpage
25 (http://graphs.gw.govt.nz/). Select a soil
moisture monitoring site, then choose
Envelope Graph from the Interval selector,
20
then optionally change the period from the last
Historic range (min to max)
12 months to the hydrological year (July –
15 20th to 80th percentile June) as required.
Median (2003-2017)
2019/20
10
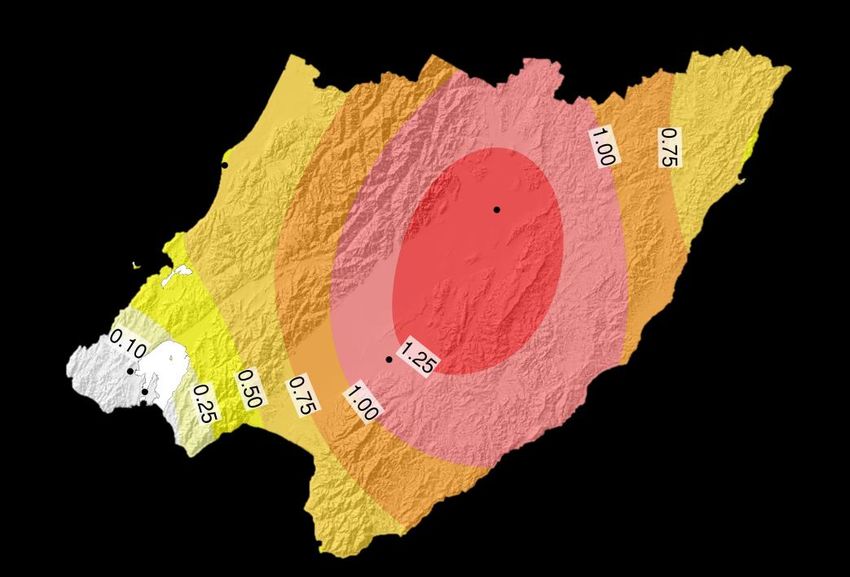
PAGE 15 OF 20Preliminary analysis into March: The map below shows the total accumulated precipitation
during the (easterly) extreme rainfall event that took place at the end of March. As mentioned
earlier, this event had return periods of a one in a 50 year event in some areas. The impacts of
this beneficial rainfall on the ongoing dry spell over the North Island and Wairarapa are still
being assessed, and will be discussed in our next report. For real time updates, please refer to
our drought monitor webpage:
https://www.gw.govt.nz/drought-check/
Total rainfall (mm) from 12 am 27 March to 12 pm 29 March. Source: GWRC.
PAGE 16 OF 203. Outlook for autumn and early winter 2020
ENSO (El Niño – Southern Oscillation) is expected to remain neutral;
Sea Surface temperatures around New Zealand about normal to slightly cooler
than normal in the south;
High chance of heavy rainfall events (both east and west coasts);
Temperatures normal to above normal;
Low confidence for total seasonal rainfall accumulation, high month-to-month
variability;
Wairarapa drought conditions ameliorated by a more favourable easterly
regime. Large scale circulation likely oscillating between easterly and westerly
flow during the season.
Whaitua* Variables Climate outlook for autumn 2020
Average to above.
Wellington Temperature:
Harbour & Hutt
Valley Low confidence for seasonal average. Heavy rainfall
Rainfall:
events likely.
Temperature: Average to above.
Te Awarua-o-
Porirua Low confidence for seasonal average. Heavy rainfall
Rainfall: events likely.
Temperature: Average to above.
Kāpiti Coast
Low confidence for seasonal average. Heavy rainfall
Rainfall: events likely.
Average to above.
Temperature:
Ruamāhanga
Low confidence for seasonal average. Heavy rainfall
Rainfall:
events likely.
Temperature: Average to above.
Wairarapa Coast
Low confidence for seasonal average. Heavy rainfall
Rainfall: events likely.
*See http://www.gw.govt.nz/assets/Environment-Management/Whaitua/whaituamap3.JPG for whaitua
catchments
PAGE 17 OF 20Acknowledgments
We would like to thank NIWA for providing selected VCSN data points for the calculation of
the regional soil moisture map and for supplementing the rainfall percentage maps in data
sparse areas.
PAGE 18 OF 20Online resources
GWRC online climate mapping tools
Live regional climate maps (updated daily): Climate maps for regional rainfall and
soil moisture (updated daily) are provided online at GWRC’s environmental data webpage
(graphs.gw.govt.nz/#dailyClimateMaps)
Drought check: http://www.gwrc.govt.nz/drought-check/
Interactive climate change and sea level rise maps: This webpage provides easy to
plot climate change mapping that illustrates the predicted future impacts of climate change in
the Wellington Region. Maps are available for every season, for mid (2040) and late century
(2090). A total of 21 climate variables can be plotted, for every greenhouse gas emission
scenario modelled by the IPCC. Dynamical downscaling provided by NIWA:
https://mapping1.gw.govt.nz/gw/ClimateChange/
Key Reports
Main climate change report (NIWA 2017)
http://www.gw.govt.nz/assets/Climate-change/Climate-Change-and-Variability-report-
Wlgtn-Regn-High-Res-with-Appendix.pdf
Main climate drivers report (Climate Modes) (NIWA 2018)
http://www.gw.govt.nz/assets/Our-Environment/Environmental-monitoring/Environmental-
Reporting/GWRC-climate-modes-full-report-NIWA-3-Sep-2018-compressed.pdf
Climate change extremes report (NIWA 2019)
https://www.gw.govt.nz/assets/Climate-change/GWRC-NIWA-climate-extremes-
FINAL3.pdf
PAGE 19 OF 20GWRC Main Climate Portals
GWRC Climate change webpage
http://www.gw.govt.nz/climate-change/
GWRC Seasonal climate variability and water resources webpage
http://www.gw.govt.nz/seasonal-climate-and-water-resource-summaries-2/
PAGE 20 OF 20You can also read