P-Cable Reservoir Monitoring - Case Study - NCS-SubSea
←
→
Page content transcription
If your browser does not render page correctly, please read the page content below
P-Cable Reservoir Monitoring
Case Study

  History of the P-Cable System
                                                                                       The Challenge
  Industry and academia use P-Cable to acquire ultrahigh resolution (UHR) 3D
  subsurface images. The technology has been applied to a variety of targets           The expense of offshore oilfield development in deeper waters and the value
  including marine exploration, site surveys, geohazard assessment, 4D seismic         of residual oil in these fields are two key factors that have a profound impact
  imaging and applied marine geology. Since 2004, over 85 worldwide commercial         on the economics of deep-water resource production. Even modest increases
  and research surveys have been acquired and more than 100 peer-reviewed              in the resource recovery factor can have a significant impact on the financial
  articles and abstracts have been published based on the data.                        success of an offshore oilfield project. This observation is one key driver for
                                                                                       the application of 4D time-lapse seismic monitoring of offshore fields.
  2001 – First Tow Test; Patent by Planke and Berndt in 2003-2004
  2004 – First Data Acquisition; Offshore Svalbard; P-Cable (16 km²)                   Our client, a major international E&P company, needed to develop a low-cost
  2009 – Academic Survey; Barents Sea; Lundin Norway (250 km²)                         methodology for routinely performing 4D time-lapse seismic monitoring
  2010 – Developed Commercial System; P-Cable and Geometrics Inc                       of deep-water oil fields in the US Gulf of Mexico that are being produced by
  2014 – First Multi-Client Norway Survey; Barents Sea (431 km²)                       water injection. Previous attempts at performing time-lapse seismic surveys
  2014 – First UHR3D Multi-Client Geohazard Survey; US Gulf of Mexico (400 km²)        using marine streamer technology proved problematic due to poor positional
  2015 – Second Multi-Client Norway Survey; Barents Sea (271 km²)                      repeatability of the streamers caused by current-induced streamer feathering.
  2015 – US Atlantic UHR3D Stratigraphic Survey; New Jersey (590 km²)                  As a result, targeted Ocean Bottom Node (OBN) surveys were being used for
  2016 – UHR3D Field Development Survey; Barents Sea (299 km²)
                                                                                       time-lapse monitoring in these fields, and although the positional repeatability
  2016 – UHR3D Baseline (Two-Field Campaign); US Gulf of Mexico (175 km²)
                                                                                       for these surveys was excellent, the costs were too high to justify relatively
  2017 – UHR4D Monitor (Two-Field Campaign); US Gulf of Mexico (175 km²)
                                                                                       frequent monitoring (e.g., once or twice per year) of the reservoirs.
  2018 – P-Cable XR System Field Trials; US Gulf of Mexico
  2019 – UHR3D Geohazard and Reservoir; Malaysia (30 km²)
  2019 – UHR3D Geohazard FEED Study; West Africa (41 km²)
  2019 – UHR4D Monitor (Two-Field Campaign); US Gulf of Mexico (270 km²)

                                               info@pcable.com          |         281.491.3123        |         info@ncs-subsea.com                   A Marine Seismic Company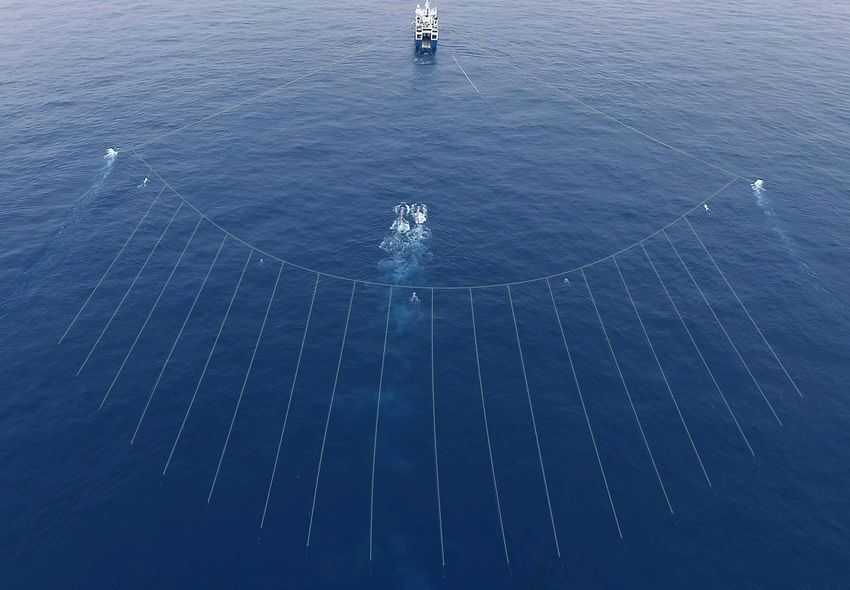
The Repeatability Pilot Study
In 2014, NCS SubSea performed a 4D repeatability pilot study using a unique,
                                                                                                Supplied Navigation Differences: Base vs Monitor
streamer-based seismic acquisition technology known as P-Cable. The P-Cable
acquisition system is designed to provide much higher temporal and spatial                                         35.00
resolution than conventional marine streamer systems and is comprised of a
large number of closely-spaced, short-offset multichannel streamer cables. A                                       25.00
typical P-Cable system configuration is shown in Figure 1.

                                                                                                           Value
                                                                                                                   15.00
The repeatability study involved acquiring two non-adjacent sail lines twice in
order to assess the positional repeatability of the streamer hydrophone group                                       5.00
positions in particular. Although the P-Cable streamers are as susceptible to
feathering due to currents as any other streamer-based system, the minimal                                         -5.00
length of the streamers (for the pilot study 100-meter long streamers were                                                 Absolute Maximum   Range     Mean    Standard Deviation
used) translated into much smaller receiver position shifts compared to                                 sht-x (m)                 9.50        15.80     -0.18         3.23
conventional long-offset streamers, which are often 4 to 8 kilometers in                                sht-y (m)                14.10        22.60     -0.12         4.83
                                                                                                        rec-x (m)                19.20        25.40      2.66         4.07
length. Subsequent analysis of the repeated sail lines confirmed excellent                              rec-x (m)                25.20        33.50      2.27         5.71
positional repeatability with source repeatability better than 10 meters;                               offset (m)                8.20        15.70      1.00         1.94
receiver repeatability better than 20 meters; and average repeatability for                             azimuth (deg)             7.40        10.60      1.53         1.65

both sources and receivers better than 5 meters as shown in Figure 2. This
level of repeatability was particularly impressive given that there was a 2+
                                                                                                Figure 2. Histograms of source and receiver repeatability from 2014 P-Cable Pilot
knot loop current oriented in the sail line direction during the acquisition of
                                                                                                Study showing excellent repeatability for both source and receiver positions.
the repeatability test lines.

  P-Cable Spread Diagram                                                                      These positive results provided our client with reasonable confidence that
                                                                                              P-Cable would provide sufficient source and receiver repeatability for them to
                                                                                              be able to detect 4D responses at least for shallow reservoirs (in particular,
                                                                                              reservoirs above the first water-bottom multiple). There were, however, still
                                    Vessel                                                    concerns of the applicability of this method for imaging deep reservoirs
                                                                                              given the limited offset distribution of P-Cable data. In particular, the limited
                                                        Tow Rope                              offset range inherent in the P-Cable methodology means this type of data is
                                                              Signal Cable                    not suitable for semblance-based velocity analysis or any type of multiple
                    Recovery Line
                                                                                              attenuation based on differential moveout. In addition, there was concern
                                         Gun Array
                                                                                              that the small source arrays used for P-Cable surveys (typically 200 to 300
    Paravane
                                                                                              in3, about one-tenth the volume of a conventional source array) might not have
                                        Cross Cable
                                                                                              sufficient output to image deeper targets.
                                                                             Spur Line
        Drop Lead                                                                             Although it is most certainly the case that the limited offset nature of P-Cable
                                                                                              data precludes moveout based multiple attenuation, this does not mean there
         Streamers
                                                                                              are no viable methods of multiple attenuation for this data type. In particular,
                                                                                              the fact that P-Cable is near zero-offset makes it particularly well suited for
                                                                                              multiple attenuation methods such as Surface Related Multiple Elimination
                                                                                              (SRME) that use the zero-offset wavefield to estimate the multiple wavefield.
  Figure 1. The number of streamer cables is typically between 12 and 24, with                Applying SRME to the 2014 P-Cable dataset confirmed that P-Cable data in
  3.125 to 12.5 meter crossline separation between cables. The individual                     deep-water settings respond exceptionally well to this method of multiple
  streamers are connected to a cross-cable (known as the “P” or perpendicular                 attenuation. This still leaves the issue of velocity estimation to contend
  cable) and typical cable lengths range from 25 to 100 meters, with a receiver               with, but since our client had quality velocity fields derived from previously
  group interval of 3.125 or 6.25 meters. This very compact receiver array allows             acquired conventional 3D and 4D surveys over their fields of interest, the
  the seismic vessel to operate in close proximity to oilfield infrastructure such as         legacy velocity field was used for processing and imaging of the P-Cable data.
  platforms or FPSOs.

                                                      info@pcable.com           |        281.491.3123               |             info@ncs-subsea.com             A Marine Seismic Company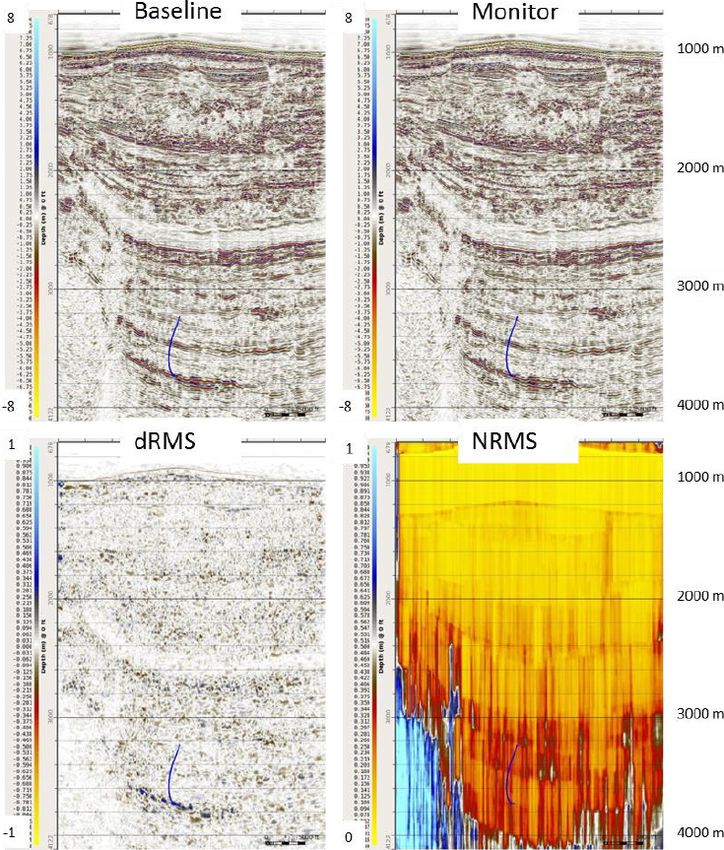
Testing the Theory: The Baseline 4D Surveys Processing of the baseline survey also confirmed that the P-Cable data
responded particularly well to SRME for multiple attenuation due the minimal
Based on the 2014 repeatability pilot study results, in 2016 our client source-to-receiver offset distances for the P-Cable spread, with targets
commissioned two 4D baseline surveys over producing deep-water fields in imaged well below both first and second order water-bottom multiples. Even
the US Gulf of Mexico using the P-Cable acquisition system. The first field more importantly, these baseline surveys confirmed the economics of P-Cable
surveyed is located offshore Louisiana in water depths of approximately surveys were supportive of relatively frequent monitor surveys, with the cost
1000 meters. This field had been surveyed previously using OBN technology of P-Cable data acquisition coming in at approximately one-tenth the cost of
to acquire a high-fold, full-offset, rich-azimuth dataset. In contrast, the the corresponding full-azimuth, long-offset OBN surveys.
P-Cable baseline survey was designed to produce a low-fold, limited-offset In addition to providing high-quality imaging of the deeper reservoir targets,
dataset, so there was concern over the ability of P-Cable to image the deeper the P-Cable baseline survey showed a tremendous uplift in terms of both
reservoirs, which are below the first water-bottom multiple. These deeper vertical and lateral resolution for delineating the shallow overburden.
reservoir targets were considered “stretch” targets for the initial baseline Although such shallow imaging was not the primary economic driver for the
survey. Indeed, because the main producing sands were initially considered baseline 4D, a detailed understanding of both the seafloor topography and the
beyond the depth of penetration for P-Cable, the survey design was optimized shallow overburden is obviously important for determining optimal locations
for imaging of shallower targets. In particular, the source and receiver tow for seafloor infrastructure, which can be impacted by shallow faulting,
depths for the baseline were quite shallow (4 and 3 meters, respectively) in slumping, fluid expulsion features or subsidence.
order to emphasize high frequencies for the shallow reservoir targets and the
source volume remained exceptionally small (300 in³) by conventional seismic The second deep-water field surveyed by our client was located offshore Texas
survey standards. Despite this small source volume, the depth of penetration in water depths up to 3000 meters. Once again, this survey confirmed the
achieved was more than sufficient for imaging targets up to 3 kilometers ability of P-Cable to image targets much deeper than originally anticipated. For
below seabed. Due to the long record lengths required to capture the both of the fields surveyed, the results were promising enough to commission
deeper targets, continuous recording with overlapping shots was employed, repeat (monitor) surveys to confirm the viability of P-Cable for monitoring
with source deblending performed during data processing to separate the time-lapse changes in reservoir properties as a result of hydrocarbon
overlapping shot records. production and water injection.
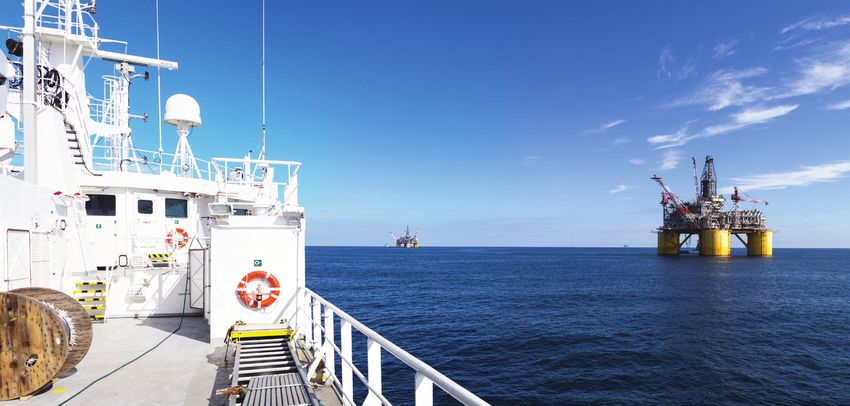
P-Cable Close Pass
P-Cable's compact receiver spread allows crews to acquire ultrahigh resolution (UHR) marine seismic data in close proximity to platforms and drillships, minimizing the need
for expensive undershooting. Image courtesy Alexey Shmatkov.
info@pcable.com | 281.491.3123 | info@ncs-subsea.com A Marine Seismic Company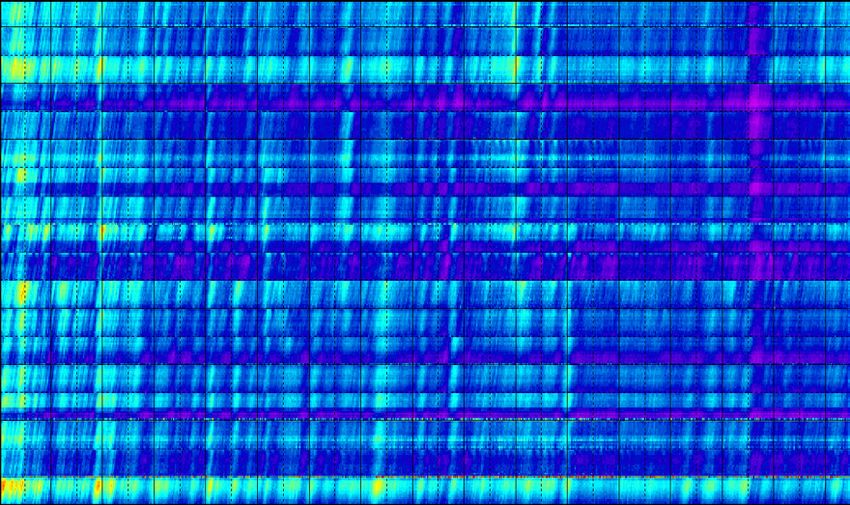
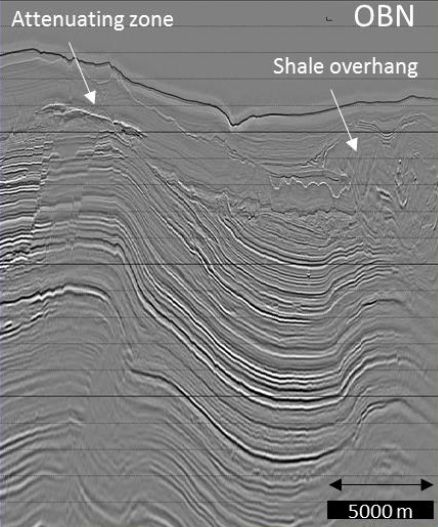
Ocean Bottom Node vs P-Cable UHR4D (Louisiana)                                             Ocean Bottom Node vs P-Cable UHR4D (Texas)
    1000 m

                                                                  OBN                                                                                       OBN

                                                                                               3000 m
    2000 m

                                                                                               4000 m
    3000 m

                                                                                               5000 m
    1000 m

                                                               P-Cable                         3000 m                                                    P-Cable
    2000 m

                                                                                               4000 m
    3000 m

                                                                                               5000 m

Figure 3. Comparison of 200-fold OBN data (25 x 25 meter bin) and 4-fold P-Cable           Figure 4. Comparison of 200-fold OBN data (25 x 25 meter bin) and 4-fold P-Cable
data (3.125 x 6.25 meter bin) from the offshore Louisiana survey. Note in                  data (3.125 x 6.25 meter bin) from the offshore Texas survey. Although the
particular the absence of water-bottom multiple contamination on the P-Cable               P-Cable data is somewhat noisier due to lower fold, the deep image results
image, which is attributable to the short-offset distribution making P-Cable data          are nonetheless impressive, especially considering the volume of the P-Cable
particularly favorable for multiple suppression techniques such as 3D SRME                 source array is one-tenth that of the OBN source array.
used in the processing of the P-Cable data.

                                                info@pcable.com           |         281.491.3123        |          info@ncs-subsea.com                      A Marine Seismic Company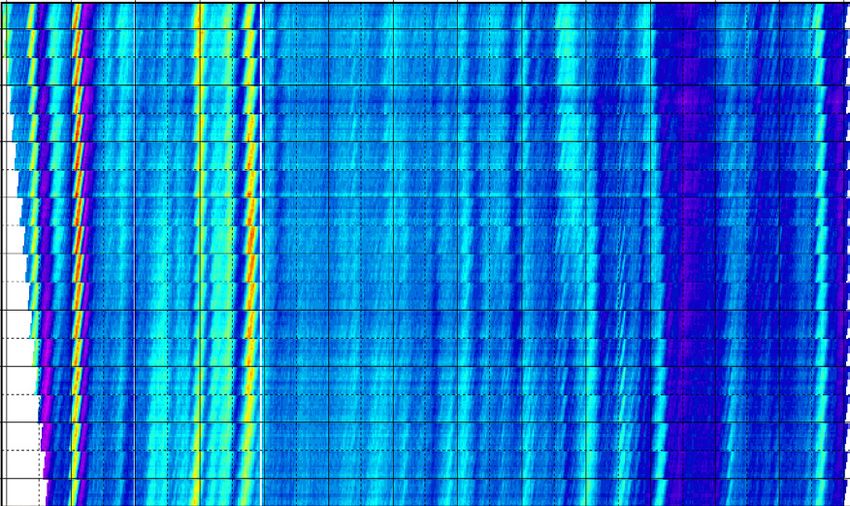
Ocean Bottom Node vs P-Cable UHR4D (Wellbores)

                         Wellbore #2 and #3                            Wellbore #1                            Wellbore #2 and #3                           Wellbore #1

   Figure 5. Comparison of OBN (left) and P-Cable (right) imaging of the upper 300 meters below seafloor. Note in particular the level of detailed imaging of both thin beds and
   shallow fault blocks on the P-Cable dataset. The red vertical lines indicate the locations of plugged and abandoned exploration wells, which leave a clear imprint on the
   P-Cable data.

Confirming the Theory: The First 4D Monitor Surveys                                         Fortunately, careful attention to noise attenuation and signal preservation
                                                                                            during the processing effort was successful in recovering 4D responses, even
In 2017, approximately one year after the completion of the baseline surveys,               for very deep reservoir targets as seen in the offshore Louisiana example
our client commissioned monitor 4D surveys over both the Louisiana and                      shown in Figure 6.
Texas offshore fields surveyed in 2016. Although our client’s initial concerns              Meanwhile, the ability of P-Cable data to recover 4D signals for deeper
about signal penetration and multiple contamination had been allayed by the                 reservoirs was also confirmed during the offshore Texas survey, which was
baseline results, it remained to be seen whether P-Cable data would be able                 also able to detect the progression of water flooding associated with the
to detect time-lapse changes in the seismic data due to production effects,                 injector well used to support production as shown in Figure 7.
particularly for the deeper reservoirs.
                                                                                            Although these initial monitor surveys confirmed the viability of P-Cable data
Making this challenge even more intriguing is the relatively short-time interval            as a reservoir management tool, there continued to be a concern with respect
between the baseline and the monitor survey. Although time-lapse surveys in                 to the 4D signal-to-noise ratio for deeper reservoir targets with P-Cable data,
fields that utilize permanently installed receivers buried in the seafloor (PRM             in terms of both absolute signal level and the noise levels associated with
or Permanent Reservoir Monitoring) may have survey intervals of a year or                   strumming and swell noise.
less, it is rather uncommon for a more traditional OBN 4D survey to have a
survey time interval this short – many have an interval of 3 to 5 years, in
large part due to the expense of these surveys. One of the questions to be
addressed by this first set of monitor surveys was whether there would be                         The economics of P-Cable surveys support
a detectable 4D seismic response after such a short-time interval. Another
concern arose while processing the 4D monitor surveys – evaluation of the
                                                                                                  relatively frequent reservoir monitoring, with the
monitor surveys revealed that these surveys had significantly higher noise                        cost of data acquisition at approximately one-tenth
levels associated with cross-cable strumming and swell noise. Although this                       the cost of corresponding full-azimuth, long-offset
noise could be attenuated during processing, there was an increased risk that                     OBN surveys.
this noise would contaminate the 4D reservoir signals that we were trying to
capture.

                                                  info@pcable.com           |          281.491.3123          |          info@ncs-subsea.com                      A Marine Seismic Company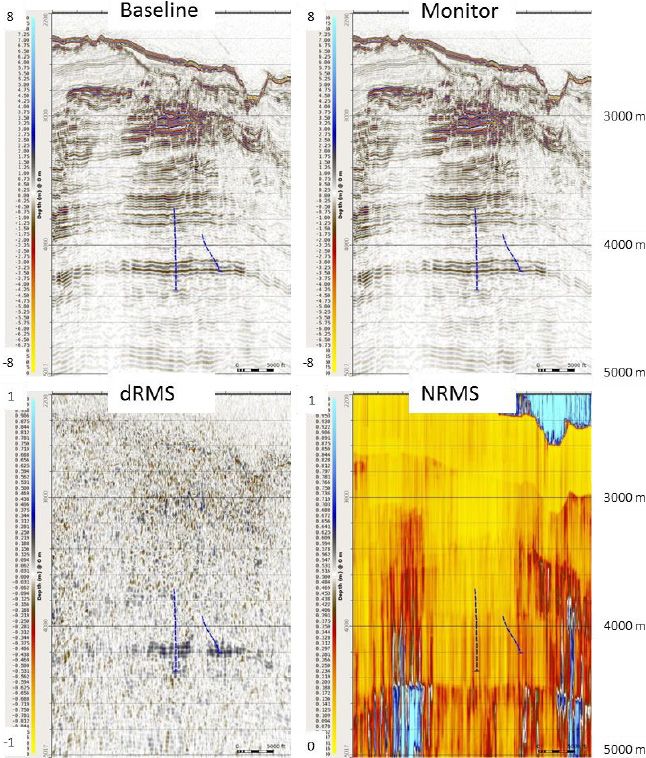
4D Sections and dRMS Map (Louisiana)                                                         4D Sections and dRMS Map (Texas)

                  Baseline                           Monitor                                                     Baseline                        Monitor
                                                                         1000 m

                                                                                                                                                                    3000 m
                                                                         2000 m

                                                                                                                                                                    4000 m
                                                                         3000 m

                                                                         4000 m                                                                                     5000 m
                    dRMS                              NRMS                                                        dRMS                           NRMS
                                                                         1000 m

                                                                                                                                                                    3000 m
                                                                         2000 m

                                                                                                                                                                    4000 m
                                                                         3000 m

                                                                         4000 m                                                                                     5000 m

     Extracted along reservoir horizon showing hardening near the injection                       Extracted along reservoir horizon showing hardening around both
     well due to water replacing oil and softening to the east due to oil                         injection wells due to water replacing oil. The southwest was injecting
     movement into a previous water zone.                                                         prior to the baseline survey and shows little additional change at the
                                                                                                  toe of the well.

                      dRMS                                                                                       dRMS
    Hardening

                                                                                                 Hardening

                                                                                                                            Injector
                                                                                                                             Wells
    Softening

                                                                                                 Softening

                          Injector
                            Well

Figure 6. 4D results for the offshore Louisiana field showing a clear 4D signal              Figure 7. 4D results for the offshore Texas field showing a clear 4D signal
associated with the illustrated injector well for a reservoir 2.8 kilometers below           associated with the two illustrated injector wells for a reservoir 1.6 kilometers
seafloor. The blue colors related to hardening due to water replacing oil while the          below seafloor. The blue colors related to hardening due to water replacing oil
red colors indicated softening due to oil replacing water. Although the NRMS plot            while the red colors indicated softening due to oil replacing water.
does indicate reduced signal-to-noise for these deeper reservoirs, the 4D signal
is nonetheless clearly visible. The extremely high NRMS values at the lower right
of the figure are associated with a salt body.

                                                 info@pcable.com            |         281.491.3123           |        info@ncs-subsea.com                      A Marine Seismic Company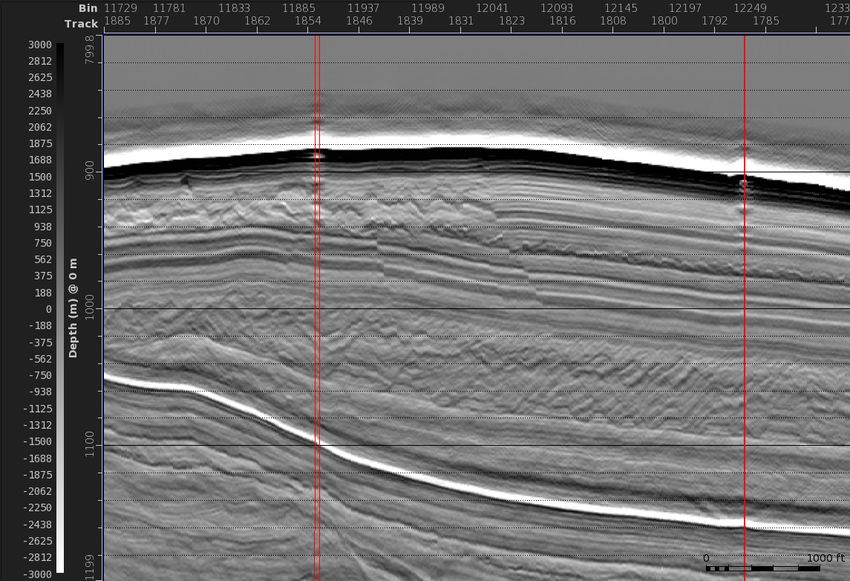
Refining the Solution: The Second 4D Monitor Surveys                                             3. A new streamer system, called the XR Solid streamer, with a 12-meter head
                                                                                                 section designed to help isolate the streamer hydrophones from cross-cable
In order to address both the signal side and noise side of the signal-to-noise                   strumming noise was employed in an effort to reduce the impact of strumming
issues, we used a multi-pronged approach to design a second set of 4D                            noise.
monitor surveys that were conducted in 2019:                                                     Although we do not currently have permission to show results from this
1. The source output was increased by using a larger volume 2280 in3 airgun                      second set of 4D monitor surveys, we can share some general observations
array instead of the 300 in3 source array that had been used for the previous                    about the data collected during 2019. An unplanned benefit of the new XR Solid
baseline and monitor surveys. This larger volume source had approximately                        streamer system was improved channel-to-channel amplitude consistency,
268.45% more output power in the 5 – 128 Hz bandwidth.                                           which simplified amplitude treatment during data processing and also allowed
                                                                                                 for more meaningful diagnostics during offshore QC processing.
2. The source and cable depths were increased to emphasize lower
frequencies, which were most relevant for the deeper reservoir targets of
interest. The previous baseline and monitor surveys had employed a source
depth of 4 meters and a streamer depth of 3 meters, resulting in a dominant
output frequency of approximately 105 Hz. The 2019 monitor survey employed                               Simultaneous Distributed Acoustic Sensing
a source depth of 5 meters and a cable depth of 8 meters, resulting in a                                 (DAS) and Vertical Seismic Profiling (VSP) is
dominant output frequency of approximately 55 Hz. Although this change
meant sacrificing higher frequencies that are important for optimizing
                                                                                                         possible during P-Cable acquisition. Our client took
resolution in the shallow overburden, the deeper reservoir targets were not                              advantage of this capability by monitoring three
benefited by these higher frequencies so it was essential to enhance the                                 fiber optic DAS systems during the acquisition of
lower frequencies that actually illuminated these deeper reservoir targets.                              the offshore Louisiana surveys.
The deeper tow depths for the streamers also reduced the impact of swell
noise on the P-Cable data by moving the streamers further from the sea
surface that generated that noise.

   GeoEel Solid vs NCS XR Solid

      18                                                                                            18

      14                                                                                            14
                                                                                         Cable

      10                                                                                            10

       6                                                                                            6

       2                                                                                            2
           1050     1150     1250     1350     1450      1550    1650     1750                       1150      1250       1350       1450       1550       1650       1750
                                        Shotpoint                                                                                    Shotpoint

   Figure 8. RMS amplitude displays for all 18 streamers from the 2017 monitor survey (left) using the legacy P-Cable system and from the 2019 monitor survey (right) using the
   XR Solid P-Cable system. The vertical axis for both plots is channel number and the horizontal axis is shotpoint along the acquisition line. The vertical striping corresponds to
   changes in geology along the survey line, while horizontal striping corresponds to channel-to-channel amplitude inconsistencies.

                                                      info@pcable.com         |          281.491.3123           |          info@ncs-subsea.com                       A Marine Seismic Company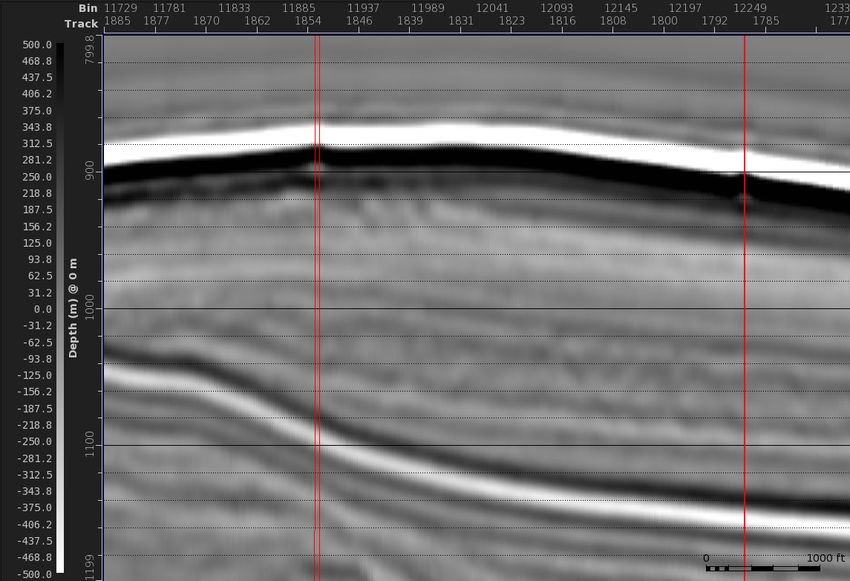
Refining the Solution: The Second 4D Monitor Surveys                                                                                 The Results So Far and The Way Forward
Analysis of the signal-to-noise ratio for all three sets of surveys confirmed the                                                    In conclusion, the analysis of the results obtained confirm the P-Cable
use of a more powerful source array and deeper tow depths for the source                                                             ultrahigh resolution acquisition system is well suited to time-lapse surveying
and streamers had a dramatic, positive impact – improving signal-to-noise                                                            for even deep reservoirs in areas where the 4D response can be captured
fourfold compared to the 2017 monitor survey. Indeed, the signal-to-noise                                                            by short-offset data. Although the examples shown in this case study are
impact was so dramatic, our client was able to see the 4D response from the                                                          based on 4D signals associated with zero-offset amplitude changes as water
2019 monitor survey using only brute stack data processed with a relatively                                                          replaces hydrocarbons in the reservoir, this method is also able to detect and
simple, streamlined processing flow. This observation has our client excited                                                         delineate zero-offset time shifts, which are another key signal of interest in
about the possibility of monitoring 4D signals during data acquisition using                                                         time-lapse (4D) reservoir studies.
standardized onboard processing flows, potentially allowing the survey
                                                                                                                                     It is also worth noting the compact receiver spread that the P-Cable surveys
design to be adjusted in the field based on preliminary results from onboard
                                                                                                                                     employ allowed us to acquire data in close proximity to platforms during the
processing.
                                                                                                                                     baseline and monitor surveys, imaging the primary areas of interest without
                                                                                                                                     the need for expensive undershooting. Our focus for this technology going
                                                                                                                                     forward includes further reduction of noise levels associated with strumming;
                                                                                                                                     increasing system reliability with more robust system components; and
                                                Since 2013, NCS SubSea | P-Cable                                                     reducing overall survey costs through innovative survey designs and
                                                has successfully operated with zero                                                  acquisition configurations tailored to the specific 4D signals being monitored.
                                                recordable incidents, a reflection of                                                Even though P-Cable has already proven to be an efficient and flexible
                                                our commitment to safety.                                                            alternative and complement to long-offset streamer 4D and ocean bottom 4D
                                                                                                                                     surveys, we continue to seek ways to make this a more powerful and cost-
                                                                                                                                     effective tool for maximizing hydrocarbon recovery.

   Signal-to-Noise Improvement

                                          2019 P-Cable                                                                  2016 P-Cable                                                                  2017 P-Cable
                            80                                                                      80                                                                                 80

                            60                                                                      60                                                                                 60
    Signal-to-Noise Ratio

                                                                            Signal-to-Noise Ratio

                                                                                                                                                               Signal-to-Noise Ratio

                            40                                                                      40                                                                                 40

                            20                                                                      20                                                                                 20

                            0                                                                       0                                                                                  0
                                0   20          40            60       80                           1000         1200         1400           1600       1800                           1000   1200          1400          1600          1800
                                         Shot Record Number                                                             Shot Record Number                                                           Shot Record Number

                                                                                                           S/N Ratio (Color = Channel Number)

   Figure 9. The estimated signal-to-noise ratio for the three sets of 4D P-Cable surveys. The 2019 dataset, with a more powerful source array and deeper tow
   depths, has the best signal-to-noise ratio with a maximum of approximately 40:1. The 2016 baseline survey is next best with a maximum of approximately
   20:1 and the 2017 monitor survey is worst with a maximum of approximately 10:1.

                                                                   info@pcable.com                               |          281.491.3123            |                        info@ncs-subsea.com                                 A Marine Seismic Company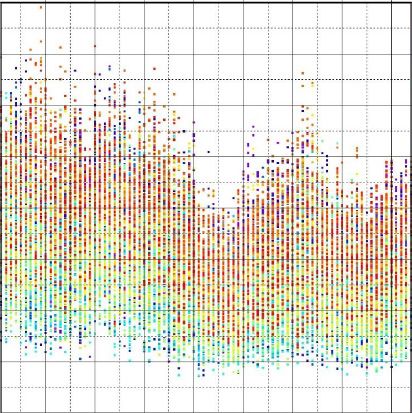
You can also read