ENROLMENT DATA OF DISABLED STUDENTS OF IGNOU: A CASE STUDY USING ID3
←
→
Page content transcription
If your browser does not render page correctly, please read the page content below
Nidhi Chopra                                        13

 ENROLMENT DATA OF DISABLED STUDENTS OF
      IGNOU: A CASE STUDY USING ID3

                                                Nidhi Chopra
                                 Research and Teaching Assistant
                           School of Computer and Information Science
                   Indira Gandhi National Open University, Delhi – 110068, India
                                     nidhichopra@ignou.ac.in

ABSTRACT
In this paper, a methodology based on ID3 – a decision based learning technique for
classification of disabled students of IGNOU has been evolved, for creating peer-to-peer
groups. This can facilitate an environment for mutual help and academic interaction. The
purpose is to promote blended social learning.

KEYWORDS: Educational Data Mining, Disability, Social Learning

1. INTRODUCTION
Data Mining or Pattern Finding is one of the established areas of Computer Science. Data
Mining is a confluence of various other disciplines – artificial intelligence, statistics,
databases, machine learning, visualization etc. Further it involves knowledge of the domain
of application viz. finance, medicine, industries, education. Educational data mining is a new
domain where data obtained from educational institution is used to analyze and find
interesting patterns. This study is regarding grouping disabled students of IGNOU using ID3
[7].

Initiating grouping of students is a problem. It is an even bigger problem when it is
concerned with special learners in the institution. Special learners include – disabled
students, females, economically backward, socially deprived etc. The number of disabled
students in a class is generally very small and a similar student is not available with whom
they can comfortably interact or do other activities specifically designed for them as per
curriculum. These students can of course interact with normal students but many issues they
face, are not faced by normal students. More over in a distance learning scenario, students
meet only for two days in a week i.e. Saturdays and Sundays. The normal students here are
mostly working or have personal responsibilities or may be both. These points limit the
possibility of interactions. A solution to this is to bring these students in contact with a similar
peer. In this paper, there is a grouping method described using real world data.

              Research Cell: An International Journal of Engineering Sciences, Issue June 2013, Vol. 8
                      ISSN: 2229-6913 (Print), ISSN: 2320-0332 (Online) - www.ijoes.org
            © 2013 Journal Anu Books. Authors are responsible for any plagiarism issues.
Nidhi Chopra                                        14

1.1 ABOUT IGNOU
IGNOU (Indira Gandhi National Open University) is an open distance learning university
which receives maximum enrollment globally. It operates through Regional and Study
Centers. There is at least one RC (Regional Center) in each state and SC (Study Centers)
are under these RCs where learners get counseling, material, forms for administrative work.
This counseling is provided by counselors to around 3 million students around the country.

IGNOU specially enrolls students who are disabled, females, deprived or minorities. There is
only a small fraction of total students who are disabled who enter the university system,
which can be grouped according to three attributes each having some attributes values –
Area (Urban, Rural, Tribal) i.e. A1, B2, C3; Region (Central, Delhi, East, West, North,
South) i.e. C, D, E, W, N, S; Handicap Nature or A1, B2, C3, D4, E5, / Type of Handicap
(Locomotor Impairment, Low Vision, Any other Please specify, Visual Impairment, Speech
and Hearing Impairment) respectively. These attributes have been selected as per the
mandate of the university.

General learners settle in groups easily and can manage through activities required for the
course, but disabled learners – who are just one or two in a study centre can’t be easily
grouped for interaction and other activities. This makes creation of groups all the more useful
in the case of disabled students.

2. DATA
For classification, data or profile of disabled students was obtained from SRD (Student
Registration Division) of IGNOU for two cycles or semesters of the year 2009. Students
provided this data by filling the enrolment forms. Out of this data students who joined SOCIS
(School of Computer and Information Sciences) in both cycles were selected. The school
offers four distance learning courses.

•   MCA (Master of Computer Applications)
•   BCA (Bachelor of Computer Applications)
•   CIT (Certificate in Information Technology)
•   CIC (Certificate in Computing)

The dataset is highly detailed and there were many errors. After data cleaning, following
attributes were selected for grouping students:

    1. Area
    2. Handicap Nature
    3. Region

              Research Cell: An International Journal of Engineering Sciences, Issue June 2013, Vol. 8
                      ISSN: 2229-6913 (Print), ISSN: 2320-0332 (Online) - www.ijoes.org
           © 2013 Journal Anu Books. Authors are responsible for any plagiarism issues.
Nidhi Chopra 15
Students in with same/similar attributes can be put in one group. This facilitates group
learning. This is in accordance with blended learning where students in same group
communicate online as well as offline. This justifies the choice of attributes as students with
same handicap nature have similar problems and solutions of those problems. Students
from same area and type of region may again encounter similar hurdles.
3 ANALYSIS METHODS
3.1 STATISTICS
From the enrolment data of the students, month of birth was extracted out of date of birth
column while data transformation using simple statistical functions. During data cleaning
phase, records with empty fields were rejected. Figure 1 was plotted using combined data of
two of cycles. This curve in figure 1 has a bell shape or an extreme in monsoon. Similar
studies have suggested that a summer born child has bad nature [3] whereas winter born
has a higher IQ. This is a normal distribution. Most biological phenomenon exhibit normal
distribution [8]. Enrollment number is primary key in the dataset [2].
Figure 1: Month of Birth graph (combined data of 2 cycles)
3.2 CLASSIFICATION
ID3 (Iterative Dichotomiser 3) is a Decision Tree based Data Mining technique, invented by
J. Ross Quinlan in 1986 [7]. It is based on the concept of entropy. Entropy is a measure of
disorderness or randomness in data. Here, it is a measure of uncertainty or indetermination
for a piece of information.
Research Cell: An International Journal of Engineering Sciences, Issue June 2013, Vol. 8
ISSN: 2229-6913 (Print), ISSN: 2320-0332 (Online) - www.ijoes.org
© 2013 Journal Anu Books. Authors are responsible for any plagiarism issues.Nidhi Chopra 16
3.2.1 DECISION TREES
Figure 2: A simple decision tree [11]
Decision trees are a data structure oriented data mining tool. They look like a tree shaped
graph. As the name suggests, they enable decision making in various fields and studies like
engineering, industry, medical research, education and psychology etc. A Decision Tree
gives rules on the basis of which decisions are made and added to a knowledge base.
Figure 2 is an example of a DT. The first node is called root node (age in this case). First or
root node is the best classifier. This called level 0. This yields in 4 branches which are pre-
decided categories namely Age>55, 36Nidhi Chopra 17
3.2.3 Derivation of the formula
A variable X has k possible values, all equally probable. As its n instances i.e. X1, X2…Xn
occur, the probability of a combination of all Xis’is defined as P(X1X2…Xn) = 1/(k^n)
i.e. kn = 1/P(X)
or n*log(k) = - log(P(X) (taking logarithm with base k throughout, using logkk = 1)
n = - log(P(X))
where n is a measure of uncertainty or indetermination for a piece of information i.e.
combination or set X1X2…Xn. It is called Entropy. The unit of Entropy is ‘bit’ [5].
Consider weighted mean of all n, entropy E of a random variable X(w) with a probability
distribution P(X(w)=x) is defined by:
E = - ∑P(X(w)=x) * log2(P(X(W)=x) for all x [4].
Conventionally, 0*log20 = 0 (using concept of limits)
3.2.4 Data Analysis and Results
This concept can be used to partition huge data into clusters or sets. Here 59 records,
without wrong values and blanks were selected. If entropy decreases after partitioning then
information is gained. The target here is, to find, which attribute can give the maximum gain.
First step is to calculate the entropy of the present system, i.e. E(0) at level-0. Next, gain is
found for partitioning by Region, Area and Handicap Nature one by one. This is level-1.
For partitioning by Region, number of students who enrolled in MCA, BCA, CIT, CIC is
counted for every value of the attribute area. Entropy for partitioning by a variable is
weighted sum of entropies obtained for each value of attribute under consideration. The
weight is number of elements in the branch over the total number of elements.
Region yields maximum gain ratio. This becomes the root node of ID3 decision tree, Figure
3.
Figure 3: Root Node of the ID3 decision tree
No rules are obtained as entropy of no branch is zero.
Research Cell: An International Journal of Engineering Sciences, Issue June 2013, Vol. 8
ISSN: 2229-6913 (Print), ISSN: 2320-0332 (Online) - www.ijoes.org
© 2013 Journal Anu Books. Authors are responsible for any plagiarism issues.Nidhi Chopra 18
For Region = Central i.e. C, entropies are calculated for other two variables – Handicap
Nature and Area. Following rules are obtained:
1. If Region = C, Area = A1, Course = BCA
2. If Region = C, Area = B2, Course = MCA
For, Region = D i.e. Delhi and other values, total of 24 rules are obtained:
3. If Region = D, Handicap = B2, Course = CIC
4. If Region = D, Handicap = C3, Course = BCA
5. If Region = E, Handicap = A1, Course = BCA
6. If Region = E, Handicap = B2, Area = A1, Course = CIC
7. If Region = E, Handicap = B2, Area = B2, Course = BCA
8. If Region = E, Handicap = C3, Course = BCA
9. If Region = E, Handicap = D4, Course = MCA
10. If Region = E, Handicap = E5, Course = BCA
11. If Region = N, Handicap = B2, Area = A1, Course = BCA
12. If Region = N, Handicap = B2, Area = B2, Course = BCA, CIT
13. If Region = N, Handicap = C3, Course = BCA
14. If Region = N, Handicap = D4, Course = BCA
15. If Region = N, Handicap = E5, Area = A1, Course = BCA, MCA
16. If Region = N, Handicap = E5, Area = B2, Course = BCA, MCA, CIT
17. If Region = S, Handicap = A1, Course = BCA
18. If Region = S, Handicap = B2, Area = A1, Course = BCA, MCA
19. If Region = S, Handicap = B2, Area = B2, Course = MCA
20. If Region = S, Handicap = C3, Course = BCA
21. If Region = S, Handicap = D4, Area = B2, Course = BCA, MCA
22. If Region = S, Handicap = D4, Area = C3, Course = BCA
23. If Region = S, Handicap = E5, Area = A1, Course = BCA, MCA
24. If Region = S, Handicap = E5, Area = B2, Course = MCA
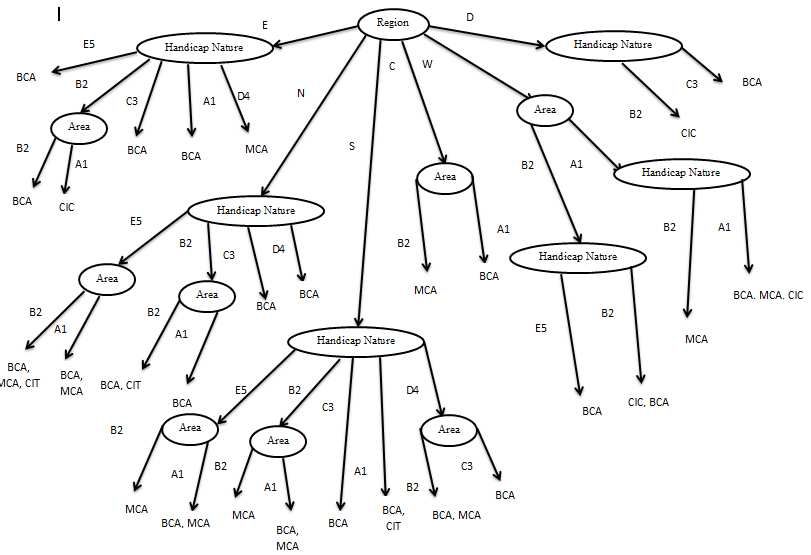
Decision tree finally obtained is shown in Figure 4. The rules above and clusters or sets in
this figure are the recommendations generated using ID3. These rules can be read from this
visual itself by traversing it in top to bottom fashion starting from first node, moving along its
branches to other nodes. Nodes represent attributes and branches emerging from them are
their values.
Research Cell: An International Journal of Engineering Sciences, Issue June 2013, Vol. 8
ISSN: 2229-6913 (Print), ISSN: 2320-0332 (Online) - www.ijoes.org
© 2013 Journal Anu Books. Authors are responsible for any plagiarism issues.Nidhi Chopra 19
Figure 4: Decision Tree obtained using ID3
Challenges and Limitations:
• Sparsity: The provided database was scanty and scattered.
• Cold start: New items and new users pose a significant challenge.
The above can be overcome by:
• Better data collection methodology
• Change in enrolment methods and forms: online, adaptive and accessible
4. DISCUSSION
Analysis in 3.1 requires further investigation to generalize. A relation in season of birth and
disability can also be used for counseling disabled students and their parents as their
various kinds of myths and superstitions prevalent in India regarding disability.
Analysis in 3.2 can be used for various purposes. These categorized students can now be
informed about others who are in their group. After obtaining their consent, their e-mail ids
Research Cell: An International Journal of Engineering Sciences, Issue June 2013, Vol. 8
ISSN: 2229-6913 (Print), ISSN: 2320-0332 (Online) - www.ijoes.org
© 2013 Journal Anu Books. Authors are responsible for any plagiarism issues.Nidhi Chopra 20
and other information can be given to their possible peers in the same group. They can be
similarly grouped on the university’s portal where they do activities with a similar peer. This
includes sharing accessible notes (or material), media, bookmarks, books or e-books
(magazines, articles), places visited, programs or workshops attended. They can also share
information about various schemes or benefits they are getting from Government to spread
awareness.
In the above analysis attributes like age, gender and marital status were discarded to avoid
touching personal issues. Also, controversial attributes were removed like caste, religion etc.
Clustering or classifying students on the basis of such attributes may not be good for their
educational development.
Inclusion of attributes like Area, Region and Handicap Nature is done so that students can
communicate even face to face. Their problems are likely to be same when they are from
same Area and Region, and suffer same type of disability. This also gives a platform for
context based mobile learning. This selection is demographic in nature and in accordance
with mandate of the university.
Such analysis can extended to any population for categorizing students or in general,
people. These groups obtained in the rules shown are just suggestions. Groups keep getting
made and broken, ultimately students settle down in some company. These are
recommendations to give a start to disabled students of IGNOU who joined SOCIS in 2009
5. SUMMARY
Grouping students can help in interactions. Suggesting peers can initiate the process of GCI
(Group Controlled Instructions) where students can discuss code, projects and work on data
(if possible) as per their need and comfort. Students can learn to take up social roles [6].
Such an attempt maintains the inclusive nature of education and at the same time provides
benefits of segregation as well.
When this study is extended or generalized to all the students then students of different
years in same course are grouped together more and more content can be build up and peer
to peer learning can be implemented more effectively. This will build up a spirit anti to
ragging which is prevalent in modern education system. Online learning and peer to peer
learning can also help in decreasing dependence on coaching institutions and tuitions [1].
Learning in groups can be motivating and joyous. Moreover, university and NGOs can get in
touch with students to provide links and information as per the type of group (see rules).
Now, during census Indian Government has collected more and more data about citizens of
India and is also assigning UIDs (Unique Identification Number) to them [10]. Based on this
Research Cell: An International Journal of Engineering Sciences, Issue June 2013, Vol. 8
ISSN: 2229-6913 (Print), ISSN: 2320-0332 (Online) - www.ijoes.org
© 2013 Journal Anu Books. Authors are responsible for any plagiarism issues.Nidhi Chopra 21
data people can be categorized on the basis of their profiles and targets (again part of
profile).
6. FUTURE WORK
Analysis in 3.1 requires further investigation using a much larger dataset so as to establish a
link between season and disability. Once confirmed the results can be applied for the
counseling of the disabled students and their parents who often have many superstitions,
especially those in developing countries.
By combining this case study with assessment data, better holistic image may come up.
ACKNOWLEDGMENTS
Author thanks Prof. Manohar Lal (supervisor) who gave useful suggestions.
REFERENCES
1. CHOPRA, N. (2010). Education Stress Syndrome. Science Reporter (ISSN 0036-
8512, March 2010, p. 15.
2. ELMASRI R., NAVATHE S., (2007). “Fundamentals of Database System”, 5th ed.
Addison Wesley, USA.
3. MANGAL, S.K. (2004). Advanced Educational Psychology, PHI.
4. MUNAKATA, T. (2008). Fundamentals of New Artificial Intelligence. Springer-Verlag.
5. NEUBAUER A., FREUDENBERGER J., KUHN V. (2007). Coding Theory:
Algorithms, Architectures and Applications, WILEY.
6. PIROLLI P., PREECE J., SHNEIDERMAN B. (2010). Cyberinfrasturcture for Social
Action on National Priorities. IEEE Computer. p. 20-21.
7. QUINLAN, J.R. (1986). Induction of Decision Tees, Communications of the ACM.
Vol.1, Issue1 1. p. 81-106.
8. SUNDAR RAO P.S.S., RICHARD J., (1999). An Introduction to Biostatistics; 3rd edn,
Prentice Hall of India, New Delhi.
9. WITTEN I.H. & FRANK E. (2005). Data Mining – Practical Machine Learning Tools
and Techniques. California: Morgan Kaufmann Publishers.
10. http://uidai.gov.in/ (accessed on 20th November, 2010).
11. http://www.igvita.com/2007/04/16/decision-tree-learning-in-ruby/ (accessed on 30th
December, 2010).
*****
Research Cell: An International Journal of Engineering Sciences, Issue June 2013, Vol. 8
ISSN: 2229-6913 (Print), ISSN: 2320-0332 (Online) - www.ijoes.org
© 2013 Journal Anu Books. Authors are responsible for any plagiarism issues.You can also read