Technical Reference - Energy Star
←
→
Page content transcription
If your browser does not render page correctly, please read the page content below
Technical Reference
                                                Climate and Weather
OVERVIEW
The climate of the area where your property is located and the annual fluctuations you experience in weather
conditions can affect how much energy you need to operate your buildings. Portfolio Manager includes metrics
designed to incorporate these effects and help you understand your energy performance. These procedures rely on
temperature data collected by weather monitoring stations and published by the National Climatic Data Center
(NCDC), which is part of the National Oceanic and Atmospheric Administration (NOAA). To discuss how we use this
data, it is helpful to introduce two concepts:
    •    Climate. Refers to regional variations in average weather conditions. For example, Florida has a warmer
         climate than Maine.

    •    Weather. Refers to annual variations at a single location over time. For example, this year we had a very
         hot summer.

In Portfolio Manager, there are two key metrics that account for these effects:
    •    Weather Normalized Energy. Weather normalized energy is the energy your building would have used
         under average conditions (also referred to as climate normals). The weather in a given year may be much
         hotter or colder than your building’s normal climate; weather normalized energy accounts for this difference.
         Note that the adjustment is for weather only, but not climate. That is, the metric evaluates your building
         over time, but does not account for differences between your building and other locations that have different
         average (normal) climates. Weather normalized energy is not available for new building design projects
         because they have not yet experienced years with different weather.

    •    ENERGY STAR Score. The 1 - 100 ENERGY STAR score is a percentile ranking, which compares your
         building to its peers. The ENERGY STAR score accounts for both climate and weather. To provide a
         score, a regression equation is used to predict the energy your building is expected to use given its climate,
         weather, and business activity. Buildings that use less energy than this prediction score better and vice
         versa. The regression equation used for your prediction is based on a national analysis that includes
         buildings in all locations with different climates. Because of this national representation, regression
         coefficients on terms like Cooling Degree Days (CDD) and Heating Degree Days (HDD) incorporate the
         differences among these climates. To predict energy for your building in any given year, we will incorporate
         your actual experienced weather data for that year. Your building is predicted to use more energy in a very
         hot year, for example. In the case of a new building design, the ENERGY STAR score will use the average
         normal climate conditions to compute the energy prediction, as no actual weather has been experienced.

This document explains where we obtain weather and climate data and how we incorporate it into metrics:

         GETTING CLIMATE AND WEATHER DATA ....................................................................................2
         WEATHER NORMALIZED ENERGY ................................................................................................4
         ENERGY STAR SCORE ...................................................................................................................9

August 2020                                                   Climate and Weather                                                                 Page 1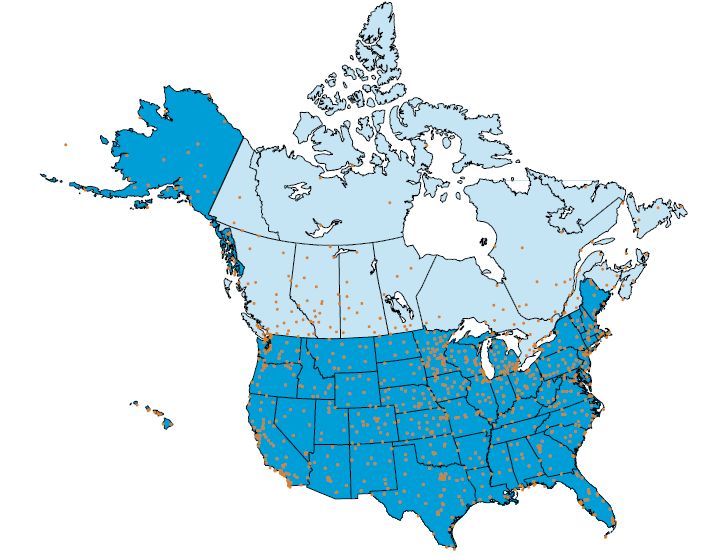
Technical Reference
GETTING CLIMATE AND WEATHER DATA
Portfolio Manager uses two main types of data: Daily Weather Data and Average (Normal) Climate Data. The
appropriate weather and climate data are selected for your buildings by using the latitude and longitude of your postal
code.
Daily Weather Data
EPA obtains daily weather data for stations all around the world using the Global Surface Summary of the Day
(GSOD) dataset. 1 This dataset provides daily temperature, precipitation, air pressure and wind speed observed for
weather stations around the world. This data is used to compute key weather metrics used in Portfolio Manager,
including the actual average monthly temperature, Heating Degree Days (HDD), and Cooling Degree Days (CDD). 2
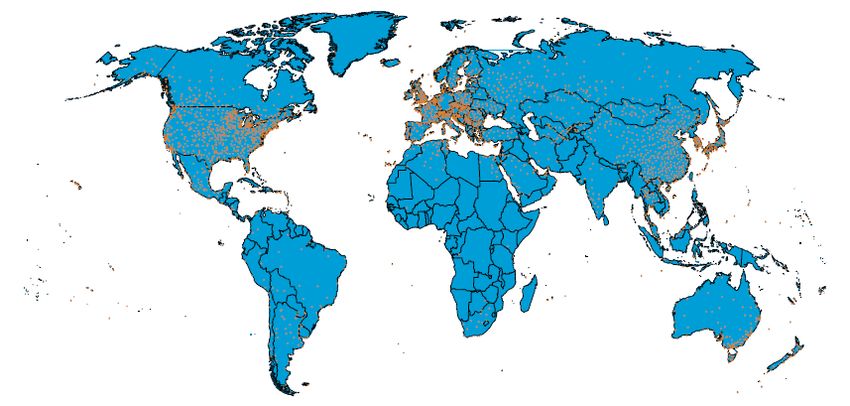
The GSOD set includes thousands of weather stations. In order to determine which stations to use, EPA follows
rigorous procedures to identify stations with sufficient historical data for use in Portfolio Manager. 3 Based on this
analysis, there are 770 stations used for the United States, 433 stations used for Canada, and 2,148 stations used
for other countries around the world. Figures 1 and 2 illustrate the locations of these stations, demonstrating the
diverse coverage of weather data offered in Portfolio Manager.
Figure 1 – Weather Stations in the U.S. and Canada
1 To access the GSOD data from NOAA’s ftp site, visit: https://catalog.data.gov/dataset/global-surface-summary-of-the-day-gsod.
2 HDD and CDD measure the deviation from a temperature of 65 degrees Fahrenheit over the course of the year. For each day with an
average temperature lower than 65 degrees, HDD is the difference between the average temperature and 65 degrees. The annual HDD is the
sum of this difference across all days with an average temperature below 65 degrees. CDD is calculated in a similar manner, to measure
deviations above 65 degrees. Note that 65oF is equivalent to 18oC.
3 A comprehensive review of GSOD data resulted in updates to weather stations in Portfolio Manager in July 2013. EPA requires complete
data going back to at least the year 2000 for stations in the United States and international stations outside of Canada. NRCan determines
historical data requirements for weather stations in Canada. Annual review of weather stations is conducted to ensure continued data
availability. In cases where stations no longer meet data availability requirements, an alternative station is assigned. Qualifying stations were
most recently updated in August 2020.
August 2020 Climate and Weather Page 2Technical Reference
Figure 2 – All Weather Stations in Portfolio Manager
Occasionally an individual station may be missing one or more days of data. When data is missing, EPA will fill in
gaps by averaging the preceding and following days together. This process of averaging values together is consistent
with how NCDC fills in gaps for their own datasets and analyses. In the case that an entire month is missing, EPA will
use the climate normal value to fill in that month. If a weather station stops reporting data for a period of several
months, then EPA will remove that station from our list and use a replacement station with accurate data.
NCDC updates the GSOD data on a regular basis as better information becomes available. To make sure data in
Portfolio Manager is up-to-date, EPA reviews data regularly and will update historical data on an annual basis to
accommodate any modifications and corrections from NCDC.
Average (Normal) Climate Data
The term “climate normals” is used to refer to average conditions within a certain climate region. Whereas daily
weather data sets report actual measurements taken at individual stations, climate normal datasets are compiled
based on a rigorous analysis of average trends. These datasets are generally reviewed and updated every 10 years.
Because of these detailed procedures there are fewer sources of data, and many sources are country-specific.
Portfolio Manager accesses three different sets of data for climate normals:
• United States. NCDC maintains a dataset of climate normals that is updated every 10 years. The most
recent set expresses the average conditions experienced between 1981 and 2010
(https://catalog.data.gov/dataset/u-s-daily-climate-normals-1981-2010).
• Canada. Environment Canada maintains climate normals and updates this data over time. The most recent
set expresses the average conditions experienced between 1981 and 2010.
(http://climate.weather.gc.ca/climate_normals/index_e.html).
• Other Countries. The World Meteorological Organization publishes climate normals for other countries.
However, this data does not include HDD and CDD, nor the daily data necessary to derive these fields. For
August 2020 Climate and Weather Page 3Technical Reference
this reason, it is not acceptable for Portfolio Manager. In its place EPA has computed 10-year climate
normals from the GSOD daily data, using the average of reported data from 2001-2010.
Assigning a Weather Station to Your Property
In order to provide performance metrics to your specific building, we need to know which daily weather station and
which climate normal to use: 4
• United States. We use the latitude/longitude coordinates of the daily weather stations and the U.S. ZIP
Codes to determine which weather station is closest to each ZIP code. This weather station is assigned to
any properties located in that ZIP code. In addition, based on the experience of ENERGY STAR partners
benchmarking in coastal and mountainous regions with unique weather patterns, we have performed an
additional manual review of some ZIP codes to identify areas where the closest station may not provide a
good representation of the weather. Fewer than 1.5% of ZIP codes in the U.S. are mapped to a weather
station other than the closest station.
• Canada. Geographic regions in Canada are identified by the six-digit postal code. The latitude/longitude of
these postal code regions and the Canadian weather stations are used to determine which weather station
is closest to each region. Through this process, the same weather station is assigned to all properties that
have the same first three digits in their postal code.
• Other Countries. For other countries, Portfolio Manager does not include an up-to-date inventory of
postal codes. When you are entering your property, you are able to select your own weather stations for
use. A map is provided to help you identify the closest station, which you can then choose from a dropdown
list.
WEATHER NORMALIZED ENERGY
Weather normalized energy is a means of adjusting for weather and should be used to compare a building to itself
over time. That is, the metric evaluates your building over time, but does not account for differences between your
building and other locations that have different average (normal) climates.
How energy use varies with temperature
In order to normalize energy consumption for varying weather, we need to understand how energy use changes
when it gets very hot or very cold. For most buildings, more energy is used at very extreme (hot or cold)
temperatures. However, it is typical for commercial buildings to have a large baseload of energy that is used
regardless of temperature. For example, energy associated with ventilation and with equipment such as lighting,
computers, and copiers is not related to weather. Figure 3 shows the typical variation between energy use and
temperature for a commercial building.
4The process of selecting weather stations with sufficient data and assigning them to properties in Portfolio Manager can be complicated,
especially in certain geographic areas. In the event that a user submits a question regarding the weather station assignment for a specific
property, EPA will review the request and consider alternative station assignment. Any station re-assignments will occur as part of a scheduled
annual review.
August 2020 Climate and Weather Page 4Technical Reference
Figure 3 – Typical Building Profile for Energy and Temperature
While energy may increase at higher and lower temperatures, there is a large amount of base load. For this reason,
year-to-year weather changes in commercial buildings may not have as big of an effect as you might think. The
purpose of weather normalization is to understand the energy to weather relationship in your building in order to
make year-to-year comparisons. Figure 3 shows the total energy use for an entire building, which may include
multiple fuels. It is important to note that some fuels are not used for both heating and cooling. Plotting each fuel
separately might look like Figure 4.
Figure 4 – Example Energy Use by Fuel Type
To account for the fact that different fuels will cover different loads in your building, the normalization process is
performed separately for each fuel that is present (electricity, gas, district steam, etc.). The normalized values for
each fuel are added together to get the normalized value for the property. Please note that the normalization process
described below requires monthly data in order to determine the relationship between monthly energy consumption
and monthly temperature. If you do not supply monthly data you will not be able to receive accurate normalization for
that fuel.
August 2020 Climate and Weather Page 5Technical Reference
Step-by-Step normalization process
To compute your weather normalized energy in Portfolio Manager, we plot the specific energy-temperature graph for
your buildings. An example of this plot is shown in Figure 5. We use this energy-temperature relationship to
understand how much energy your building is expected to use in the current year as compared with a hypothetical
year that has the average (normal) climate conditions. The relationship between these two values provides a
normalization factor so that we can tell you how much energy you would have used under normal climate conditions.
An overview of this process is presented in Figure 6.
Figure 5 – Example Plot and Fit for 24 Months of Actual Energy and Weather Data
900,000
800,000
Monthly Energy (kWh)
700,000
600,000
500,000
400,000 Measured Data
Calculated Fit
300,000
10 20 30 40 50 60 70 80 90 100
Temperature (oF)
The methodology we use to weather normalize building energy data is based on E-Tracker, a software tool
developed by Dr. Kelly Kissock of the University of Dayton. Information on this tool is available at:
http://academic.udayton.edu/kissock/http/Weather/ (a copy of the tool may be downloaded for free for Educational or
Non-Commercial uses). The initial code was updated by EPA in both 2007 and 2013 to streamline calculations, but
conceptually the process has not changed.
Weather normalization is a calculation that is available for existing buildings only and does not apply to commercial
building design. Inherently, the process of weather normalization requires information on actual experienced weather
conditions, which are not available when a building is in the design phase.
August 2020 Climate and Weather Page 6Technical Reference
Figure 6 – Steps to Normalize Energy for Weather
1 User Enters energy data into Portfolio Manager (only step required by user)
• Monthly bills in increments of 65 days or less are required for weather normalization because energy use is
compared to monthly weather data. For this reason, it may not be available for fuels that are delivered in bulk.
• Normalization is based on the most recent 24 calendar months of data. If 24 calendar months of data are not
available, the most recent 12 months are used.
2 Portfolio Manager splits energy data into whole calendar months
• Data is apportioned to calendar months based on the average energy use per day.
For example, if a bill runs from January 10 through February 9, it covers 31 days: 22 in January and 9 in
February. Of the total bill, 22/31 (71%) is assigned to January and 9/31 (29%) is assigned to February.
3 Portfolio Manager plots energy use and actual temperature for each fuel
• The actual temperature for each of the 24 calendar months is retrieved from the daily weather station.
• A plot is generated with energy on the vertical axis and temperature on the horizontal axis (Figure 5).
• Separate plots are created for each fuel type in the building.
4 Portfolio Manager calculates the relationships between energy and temperature
• For each individual fuel type, a series of linear regressions is performed to determine the equation of the best
fit line for the building, based on the solution with the highest correlation (R2).
• Different fits are explored to account for how a fuel is used in a particular building. A fuel may be used for
heating, cooling, or a combination of heating and cooling. A fuel used for heating only is expected to have a
graph that has a sloped line at cold temperatures and remains flat during warm temperatures. The opposite is
true for cooling-only fuels. Fuels used for both heating and cooling will have opposite slopes at cold and warm
temperatures. The regression process reviews all potential profiles and adjusts the “change” points where the
curve shifts, in order to find the solution with the highest R2.
• It is possible to have no calculated fit, meaning a building’s energy does not vary significantly as temperature
changes. This may be true for buildings that use electricity for only the base load, buildings that have limited
heating or cooling loads, or buildings with high internal loads like data centers and hospitals. EPA requires a
minimum R2 that varies based on the type of fit, ranging from 0.4 for simpler fits to 0.7 for more complex fits.
5 Portfolio Manager computes a normalization ratio for each fuel type
• For each fuel type, this is a ratio of the expected energy for the average (normal) climate year to the expected
energy of the current year (12 month period selected).
• The expected energy values are computed using the relationship from Step 4, and solving for energy using
the average (normal) climate temperatures and the actual daily temperatures, respectively. The expected
values represent the energy a building would use if it exactly followed the regression equation.
For example, if the current year is very hot, a building might be expected to use twice as much energy than
under average (normal) climate conditions. The normalization ratio would be ½. The actual energy would be
multiplied by ½ to determine what would have been used if it had not been so hot.
6 Portfolio Manager computes normalized energy
• The actual annual energy is multiplied by the normalization ratio to provide a weather normalized value for
each individual fuel at the building.
• The weather normalized values of all fuel types are added together. This aggregate normalized value
represents the energy the building would have used under average (normal) climate conditions.
August 2020 Climate and Weather Page 7Technical Reference
Specific Example
Let us look at an example of how the process might work for a building with two fuels, as shown in Figure 7. Based
on the energy use and temperature values for the building, the relationships discovered in Step 4 of the process
show that electricity is used for base load and cooling whereas the natural gas is used for heating only. Both of these
relationships have strong fits with R2 values of 0.85 and 0.90, respectively.
Using these relationships, two expected values are computed. The first is the expected value using the average
(normal) climate temperatures; the second is the expected value using the actual daily temperature for the current
year. The normalization ratio is the ratio of these two expected values. This shows, based on our fit, how much more
(or less) energy we expect that the building should use in the current year relative to a hypothetical year with average
(normal) climate conditions. Note that assuming a strong fit, the “expected value” of the current year should be very
close the actual value in the current year (as shown in Figure 7).
In this example, it must have been relatively hot in the summer and cold in the winter. We see this because the
expected energy of the current year is higher than the expected energy in the average (normal) climate year. That is,
the building had to use more energy because of the weather in the current year. For this reason, the weather
normalized energy is lower than the actual energy. In an average year, the building would have used less.
For each fuel, the normalization ratio is multiplied by the actual annual energy consumption to yield weather
normalized site energy. The individual normalized values for electricity and natural gas are separate metrics available
in Portfolio Manager. In addition, aggregate weather normalized site energy for the building is obtained by adding
together the normalized values for each individual fuel. Finally, weather normalized source energy for the building is
obtained by multiplying the individual fuel-specific normalized values by their source energy factors. 5 You can learn
more about source energy and the factors for both the U.S. and Canada at: www.energystar.gov/SourceEnergy.
Figure 7 – Example Calculation of Weather Normalized Energy
Electricity Natural Gas
Measured Values
Annual Consumption (kBtu) 1,234,882 488,725
Aggregate Site Energy (kBtu) 1,723,607
Aggregate Source Energy (kBtu) 3,970,831
Weather Relationships
Energy for base load Energy for heating only
Fit determined through regression process.
and cooling (R2=0.85) (R2 =0.90)
Normalization Ratio
Expected Energy for a year with the Climate
1,000,000 450,000
Normal Conditions (kBtu)
Expected Energy for the Current Year (kBtu) 1,200,000 475,000
Normalization Ratio 0.8333 0.9474
Normalized Energy
Weather Normalized Site Energy (kBtu) 1,029,027 463,018
Aggregate Normalized Site Energy (kBtu) 1,492,045
Aggregate Normalized Source Energy (kBtu) 3,367,445
5 Source energy is the amount of raw fuel required to operate your building. In addition to what you use on-site, source energy includes losses
from generation, transmission, and distribution of energy. Source energy enables the most complete and equitable energy assessment. Learn
more at: www.energystar.gov/SourceEnergy. U.S. Factors for electricity (2.80) and natural gas (1.05) are used in this example.
August 2020 Climate and Weather Page 8Technical Reference
ENERGY STAR SCORE
The ENERGY STAR score provides a peer group comparison that accounts for both weather and climate. It should
be used to compare your buildings with other buildings in your country (either the U.S. or Canada).
Calculation Overview
To compute your ENERGY STAR score, Portfolio Manager compares your actual, measured source energy use
intensity (EUI) with a predicted source EUI. Those buildings that use less energy than predicted score relatively
higher, and vice versa. A detailed description is available in our Technical Reference for the ENERGY STAR Score
www.energystar.gov/ENERGYSTARScore. The predicted Source EUI is computed from a regression equation that is
based on nationally representative data. This regression equation includes inputs for your use details (e.g., hours,
workers, computers) along with inputs that capture weather and climate (e.g., HDD, CDD). For each of these inputs
in the regression equation, your building’s prediction is adjusted to account for the correlation between that input and
EUI, when all other inputs are simultaneously considered.
• Accounting for Climate. Because the predictive equation is based on a nationally representative sample
with buildings in locations all around the country (either the U.S. or Canada), the coefficients for HDD and
CDD capture regional differences across the country and therefore account for the impact of the average
(normal) climate in your area.
• Accounting for Weather. For any individual year when your prediction is computed, Portfolio Manager
will use the actual experienced HDD and CDD for the daily weather stations closest to your building.
Therefore, during a year with extremely hot and/or extremely cold temperatures your building will be
predicted to use more energy. In this way, the ENERGY STAR score also accounts for weather effects from
year to year.
When the ENERGY STAR score is computed for a design project, the average (normal) HDD and CDD values are
used to generate the predicted score. This enables an adjustment for climate to help you during design stages. By
definition, a design project has not experienced any actual weather conditions yet.
Value of HDD and CDD as Indicators of Climate and Weather
It is important to note that HDD and CDD are not the only ways to quantify climate and weather. There are other
measures such as temperature, humidity, cloud cover, and precipitation. Many of these numerous weather
characteristics are correlated with each other. For example, buildings with higher HDD tend to have lower CDD (i.e.,
colder climates). Similarly, buildings with higher CDD tend to have higher dew points (warmer, more humid climates).
In general, a regression analysis will isolate the effect of one variable while simultaneously normalizing for the other
variables. When two independent variables are highly correlated with each other, it is prudent to include only one of
the two, because they end up capturing the same effect.
To explore the effects of humidity, EPA ran regression models that included HDD, CDD, and Dew Point. This
analysis showed that a separate relationship for humidity was not statistically significant. Although removing moisture
from the air requires energy, this energy requirement cannot necessarily be isolated as a statistically significant
differentiator among buildings. The regression analysis simultaneously adjusts for each independent variable. It was
observed that dew point is highly correlated with CDD. Therefore, in a regression analysis independent statistically
significant correlations for both CDD and dew point cannot be obtained. This indicates that the impact of dew point
can be accounted for by the inclusion of CDD.
August 2020 Climate and Weather Page 9Technical Reference
EPA has also performed analysis to look at Average Temperature as an alternative (or addition) to HDD and CDD. It
was not found that Average Temperature offered a separate (or superior) correlation with Source EUI than HDD and
CDD on their own. Ultimately, we will typically use HDD and/or CDD as the primary indicators of weather conditions
in the regression equations. Statistical correlations for these variables successfully account for weather differences
across the country and additional terms for factors such as humidity are not shown to be effective.
Specific Example
Finally, it is helpful to consider how these calculations work in the context of an example building. Figure 8 presents
the calculation of the score in two office buildings. These buildings are the same size, with the same hours of
operation and numbers of workers and PCs. These buildings are also experience the same number of HDD.
Although HDD is the same, Building A is located somewhere with fewer CDD: 500 as compared with 1,500 at
Building B.
Because Building B has higher CDD, it needs more energy to cool. This is reflected in both the predicted and the
actual source EUI. That is, Building B is predicted to use more energy than Building A and it actually does use more
energy. Ultimately, Building A and Building B earn the same score. This is because the prediction that is computed
takes into account the higher cooling need at Building B. Because the prediction takes into account the actual
experienced HDD and CDD for your buildings, buildings with all types of weather conditions are able to earn the
same scores.
Figure 8 – Comparison of Two Buildings with Different CDD
Building A Building B
(Low cooling load) (High cooling load)
Size 250,000 250,000
Hours 70 70
Workers 600 600
Computers 800 800
CDD 500 1,500
HDD 4,800 4,800
Predicted Source EUI 237.1 243.3
Actual Source EUI 180.0 185.0
Energy Efficiency Ratio 0.76 0.76
ENERGY STAR Score 60 60
ENERGY STAR® is a U.S. Environmental Protection
Agency program helping businesses and individuals fight
climate change through superior energy efficiency.You can also read